


Gold Technical Picture for 2022
The article presents recent technical picture of gold for 2022 using long term yearly chart. Gold prices increase as a result of the base formation at the forecasted inflection number of $1,680. Price rise by more than $300 as a result of the deep investigation by Gold Predictors in 2021. The Russia-Ukraine conflict has significantly altered the global geopolitical situation. Numerous assumptions can be made based on the current state of the war. However, it is assumed that the war will not be resolved by 2022, and consequences will have impact on gold.
Geopolitical Instability and Inflation
The outlook for the economy has shifted significantly as a result of expected Federal Reserve rate increases and weaker economic growth. The Fed’s rate hikes to combat energy-induced price inflation is expected to accelerate the risk of a recession. Some people are afraid that inflation will be more important than conflict. They also don’t want new sanctions from the West on Russia or other countries that support Russia, like China. Following February’s CPI of 7.9%, the United States is likely to face double-digit inflation.
Gold is being sought after by investors as a hedge against geopolitical instability, inflation, and the possibility of a future recession. The decision by Russia’s central bank to sell gold to avoid Western sanctions should be closely scrutinized. There are positive risks to non-Western central banks increasing their gold holdings as a result of the war’s inflationary consequences and the possibility that the West will sanction their US dollar holdings at any time.
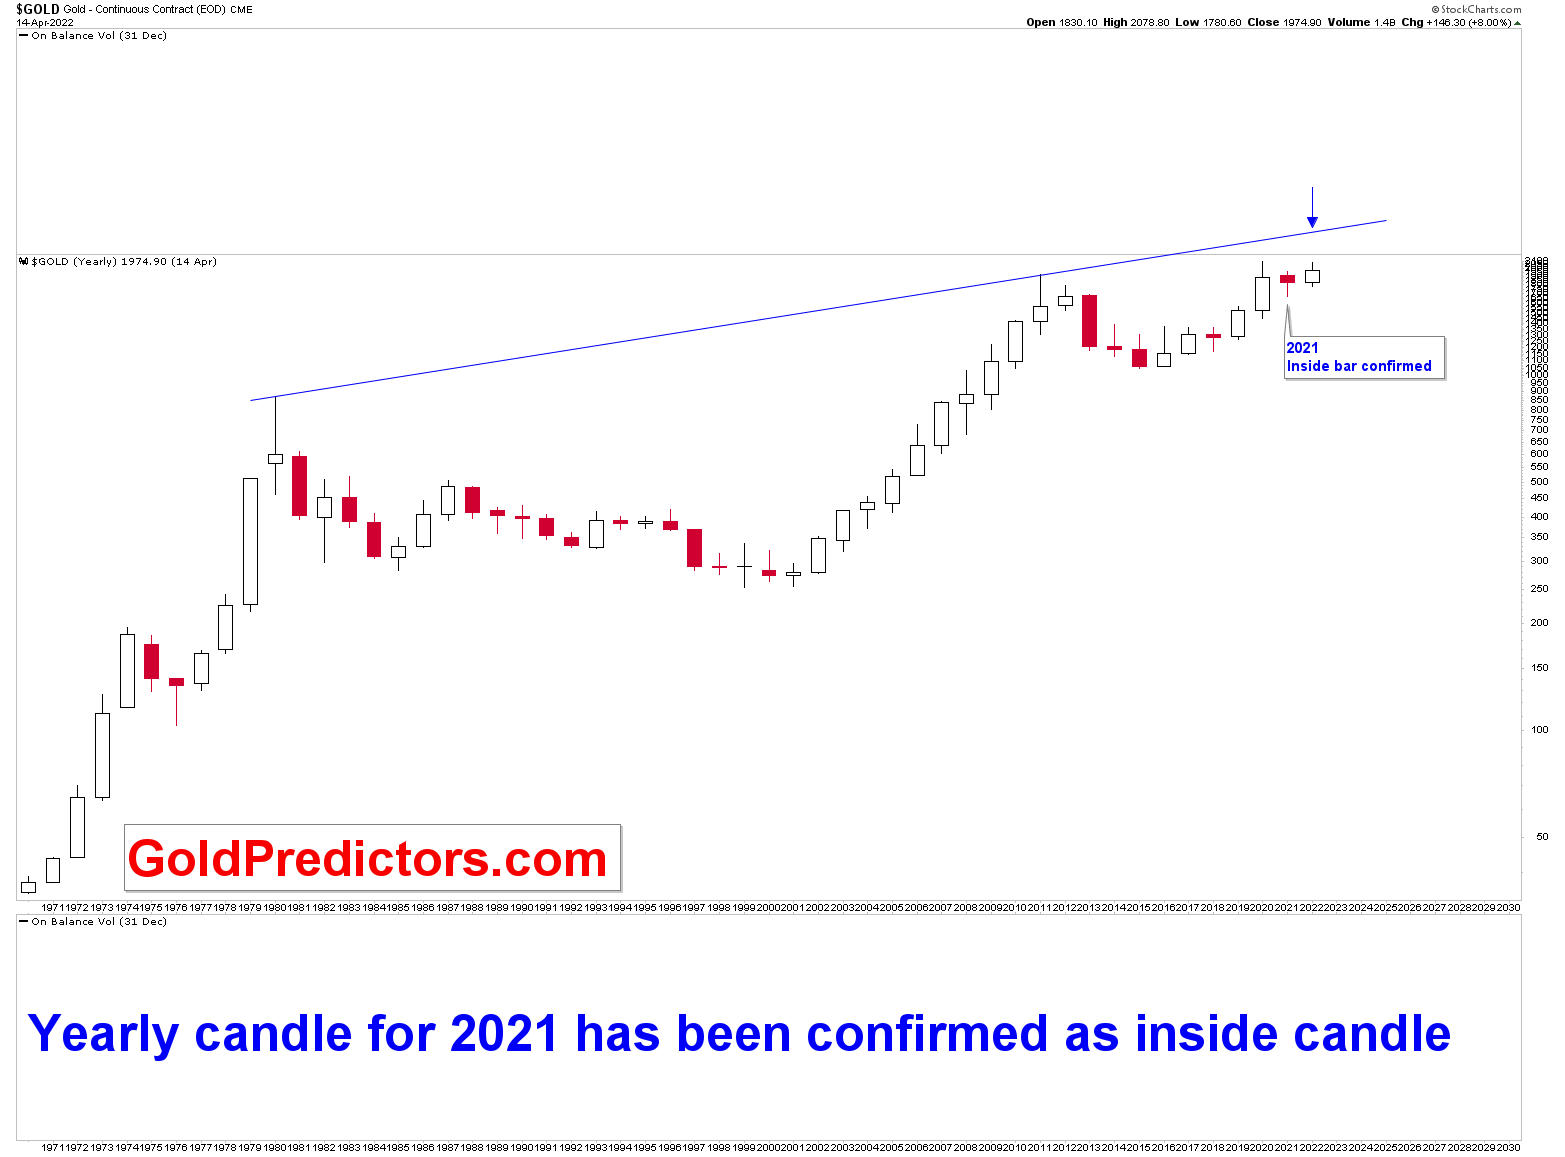
According to Gold Predictors, the low for 2021 was expected at $1,680 within 1st week of March 2021, and the yearly candle for 2021 was expected to be an inside candle, indicating wide ranges and price fluctuations throughout 2021. The analysis proved with 100% success rate as the low for the year was $1,676 on 10th March 2021 and the yearly inside candle was confirmed with the close of the year on December 2021. The same analysis will be used for analysis and prediction to forecast the year 2022. As prices move, premium members will continue to receive analysis on quarterly and monthly charts regarding this prediction.
Gold Technical Picture for 2022
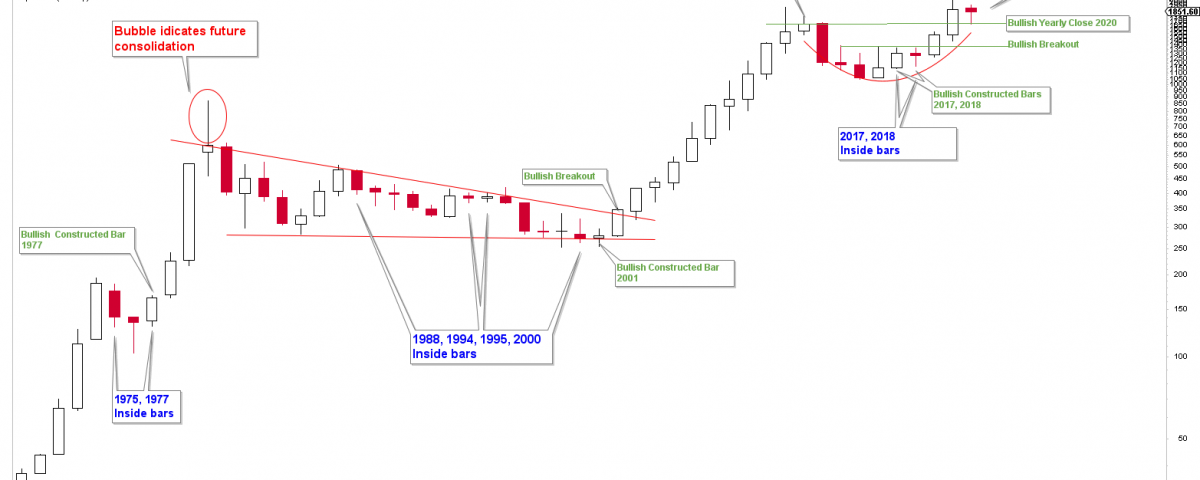
The chart below was posted to various social media channels on November 19, 2021, and depicts the yearly outlook for gold on a logarithmic scale. For the year 2021, a bullish inside yearly candle was expected. The inside candle is a compression candle that appears after a period of wide consolidation, and the highs and lows are within the previous candle. Any breakout from the inside candle indicates a large move. Since the yearly candle for 2021 was forecasted to be an inside candle, the year 2021 was expected a consolidation year. This prediction was proven with a 100% success rate because 2021 was a consolidation year between $2,100 and $1,680, which are both yearly inflection numbers calculated by the Gold Predictors Analysts.
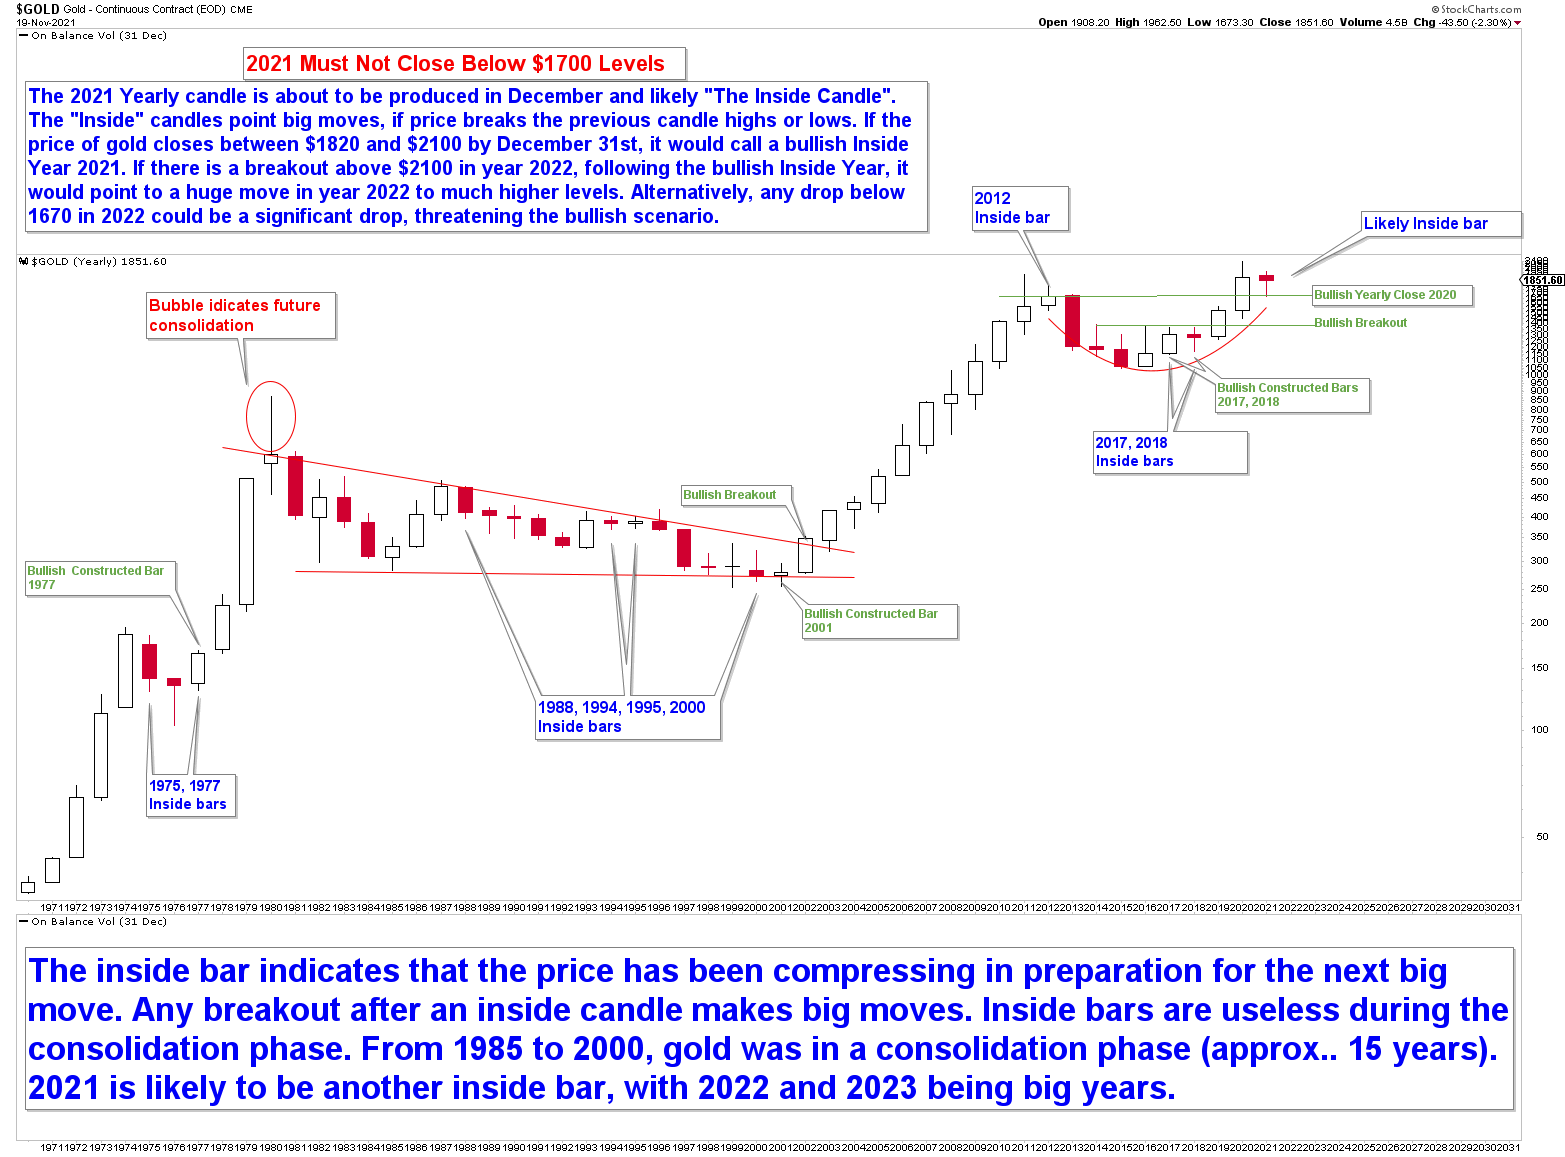
The 50 years chart reveals only 9 inside yearly candles for the years 1975, 1977, 1988, 1994, 1995, 2000, 2012, 2017, and 2018. The next expected inside candle was due in 2021, and already produced, with price highs and lows within 2020. It is easy to see in the chart that gold prices are likely to trade with sharp moves following the formation of the inside yearly candles. The sharp moves after the bullish inside candles can be seen in the years 1977, 2000, and 2018. The situation was different for inside yearly candles of 1988, 1994, and 1995 because gold was in a long-term consolidation phase from the year 1980 to 2000. However, once the year 2000 candle was broken, prices began a nearly ten-year rally that culminated in the cyclical high in 2011.
The chart also shows that the inside yearly candle of 2012 has been reversed since the lows of the inside candle were broken to the downside, and the long-term cycle high was registered in 2011, indicating a breakdown and consolidation for at least 3-4 years after 2012.
The 2021 gold forecast was released in February 2021 by Gold Predictors. “The low in gold prices for 2021 are expected in the month of March 2021 at the inflection point of $1,680, and the final low was $1,676″.
The Confirmation Year
Looking for the confirmation candle after the inside candle is another way to read the chart. In the above chart, there are nine inside yearly candles. The confirmation is only seen in the 1977, 2001, and 2018 yearly candles, where three largest rallies began in following years. As a result, based on the breakout from 2021 inside the yearly candle, 2022 and 2023 must be the years when the next unstoppable rally may begin. This analysis will be expanded on the quarterly and monthly charts for premium members to determine the time zone for the next upward move.
The chart above depicts a log view of the most recent gold yearly chart, which confirms the 2021 yearly candle as the inside candle and points to higher prices. We’ve been discussing with premium members the significance of $2,075 as the yearly pivot for 2022, and the rally has already reached the pivot of $2,075, followed by a significant pullback to the $1,920 support region. All eyes are now focused on the breakout from the yearly inside candle at $2,075-$2,100.
The Premium content is open to Gold Predictors Free Members for the next few days.
Please subscribe to the link below to receive free updates.


