


Is US Dollar Rally Over?
Although the US dollar has bounced back from major support levels, the long-term outlook remains bearish. Last week, the value of the US dollar was observed to be weak in major forex pairs. Today, we’ll look on technical charts to see if the US dollar rally is over?
Highlights
- Last report highlighted the weakest currencies as EUR, NZD, CHF, and JPY. These currencies traded to the sands and then bounced off from the major supports, with the GBP retreating from the strong resistance area.
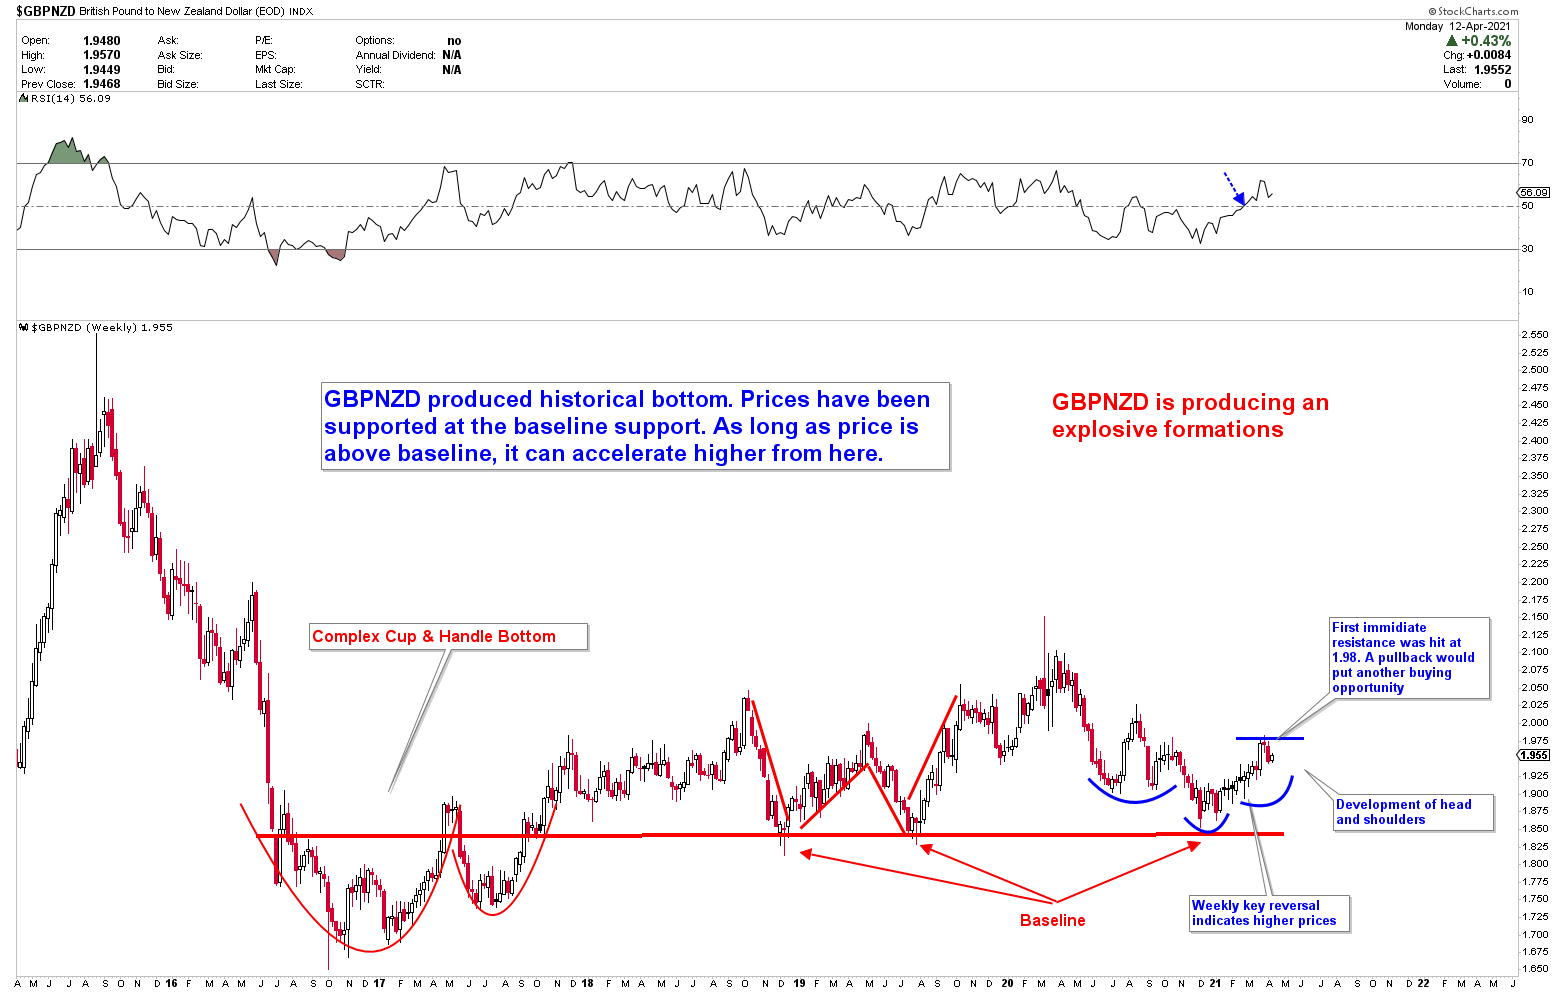
- For the past three weeks, we’ve been discussing the JPY’s inflection point. Japanese Yen produced a mini reversal but because these are long-term patterns, there are some price deviations. A breakout from this inflection would point a major shift in long term bear market. GBPNZD, on the other hand, surged higher in line with our expectations. The initial target was set at 1.98, and the price reversed from the level at 1.9819. The pullback in this instrument must be a buying opportunity as per historical price pattern formations, but the depth of pullback is undefined at the moment.
- US Dollar rally from major supports is under way
Weakest currency: NZD, AUD
Strongest Currency: EUR, CAD
Best Instruments to Focus:
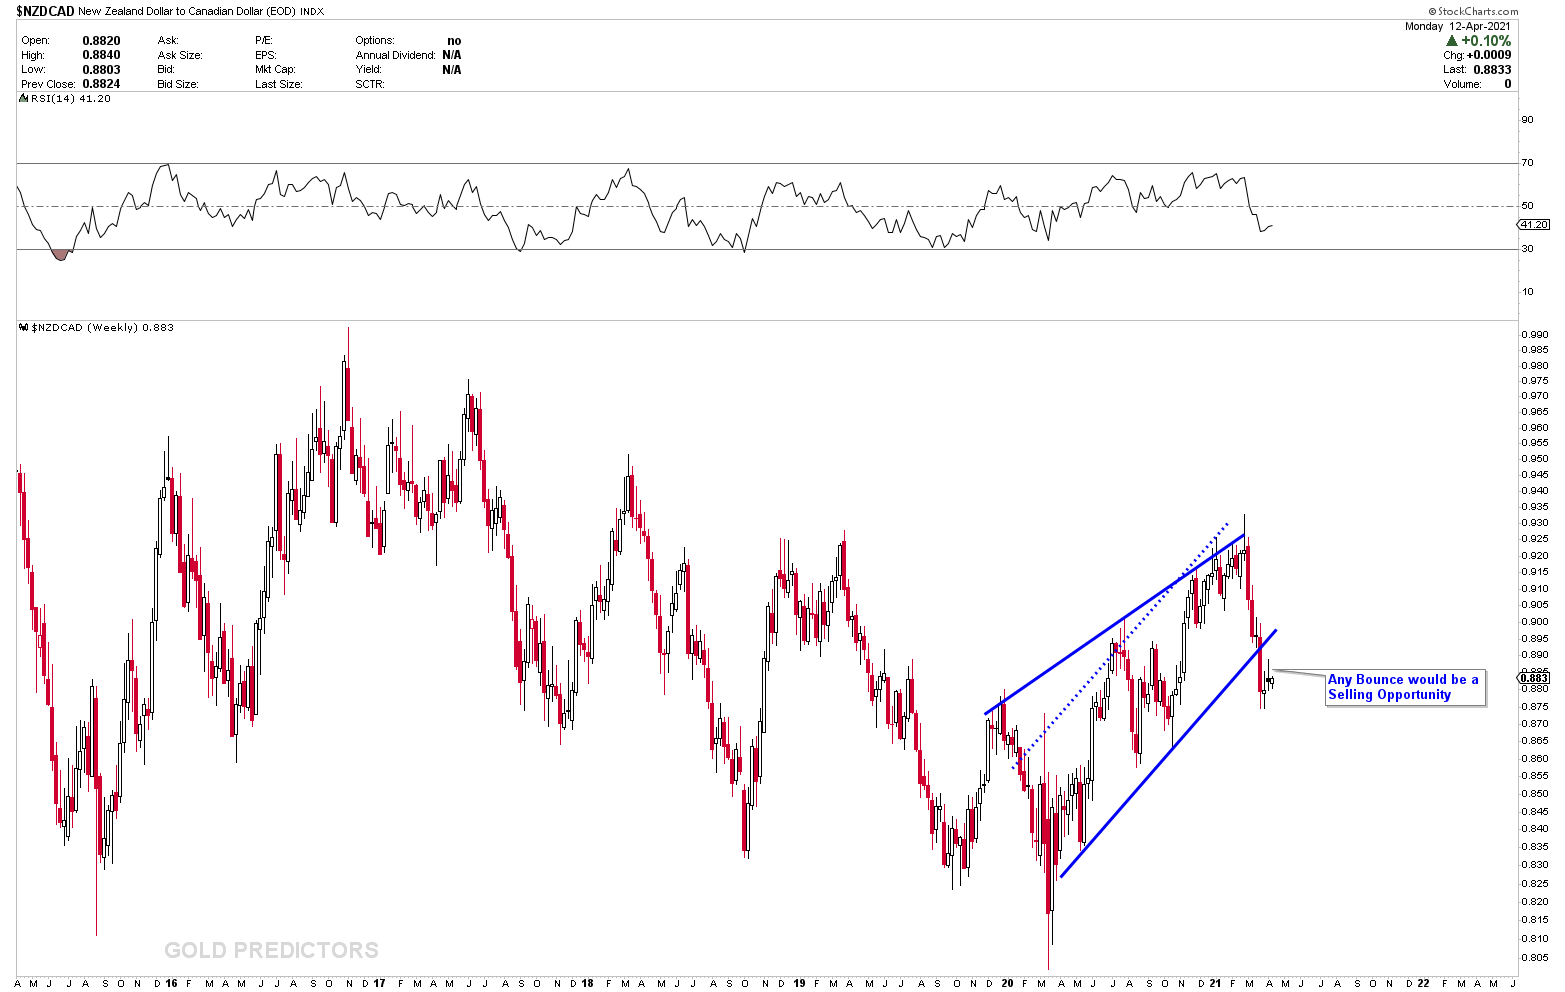
SHORT NZDCAD
LONG EURAUD (Risky)
Is US Dollar Rally Over?
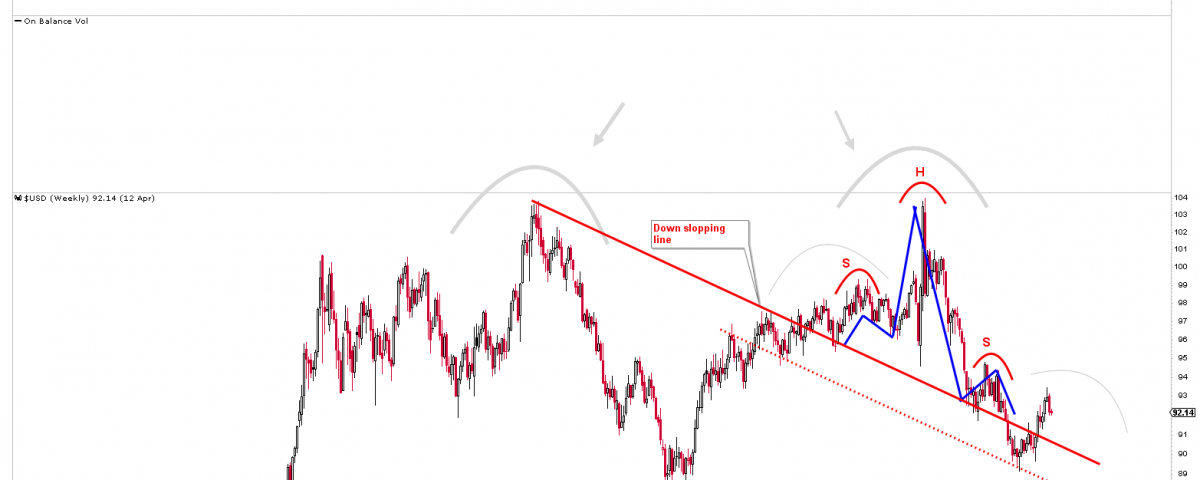
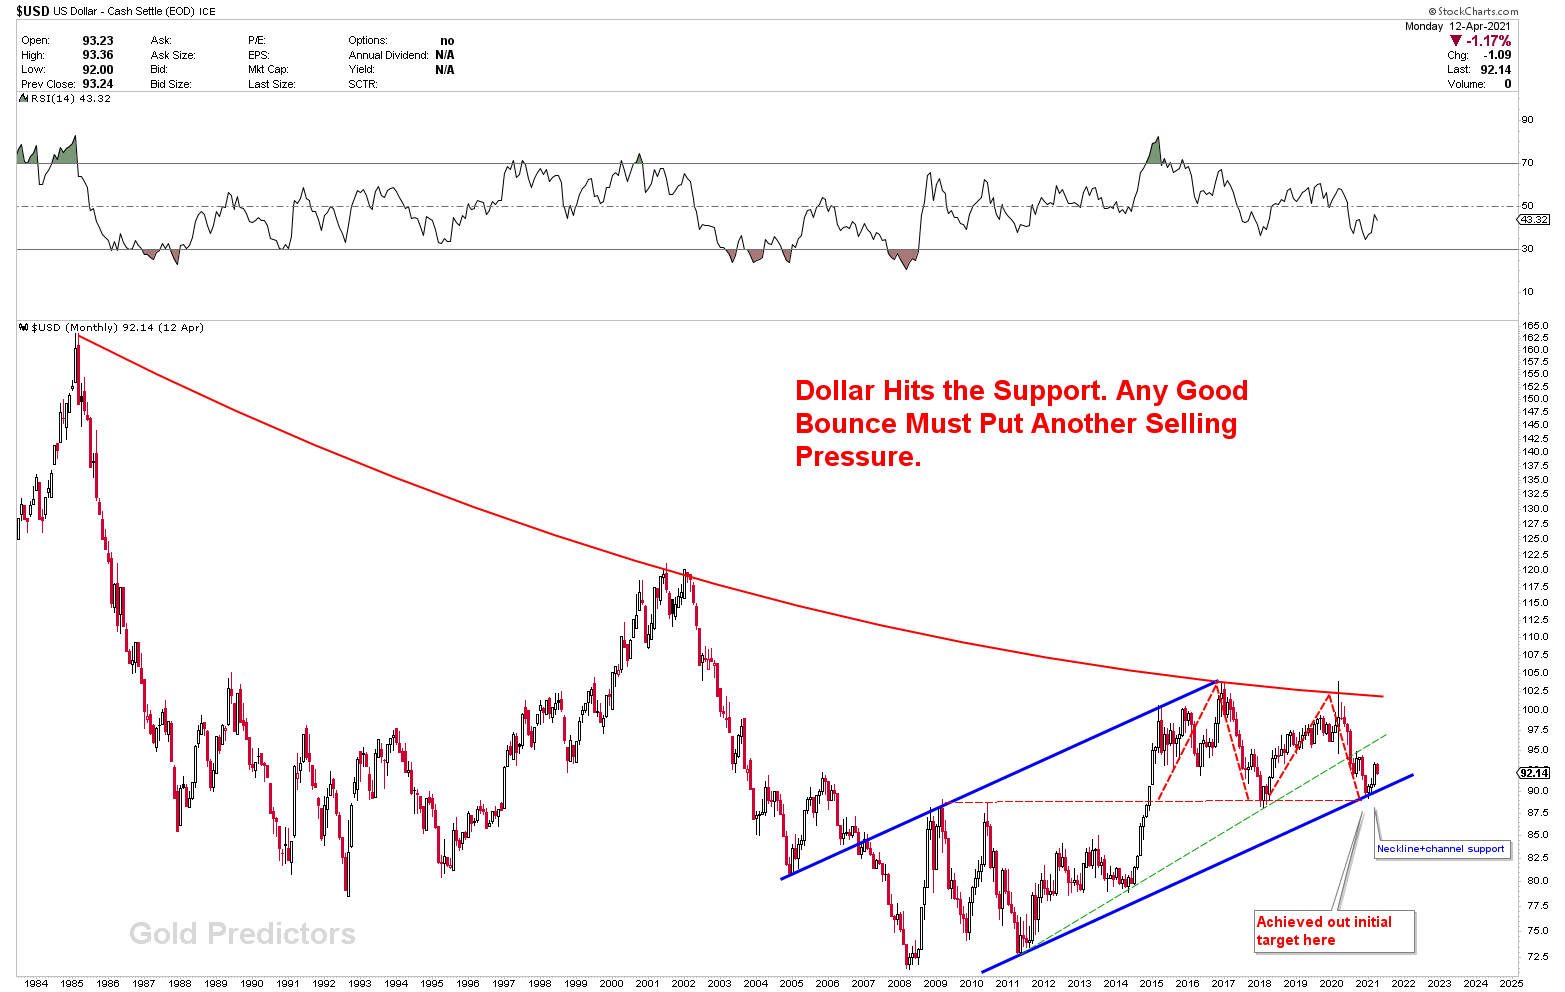
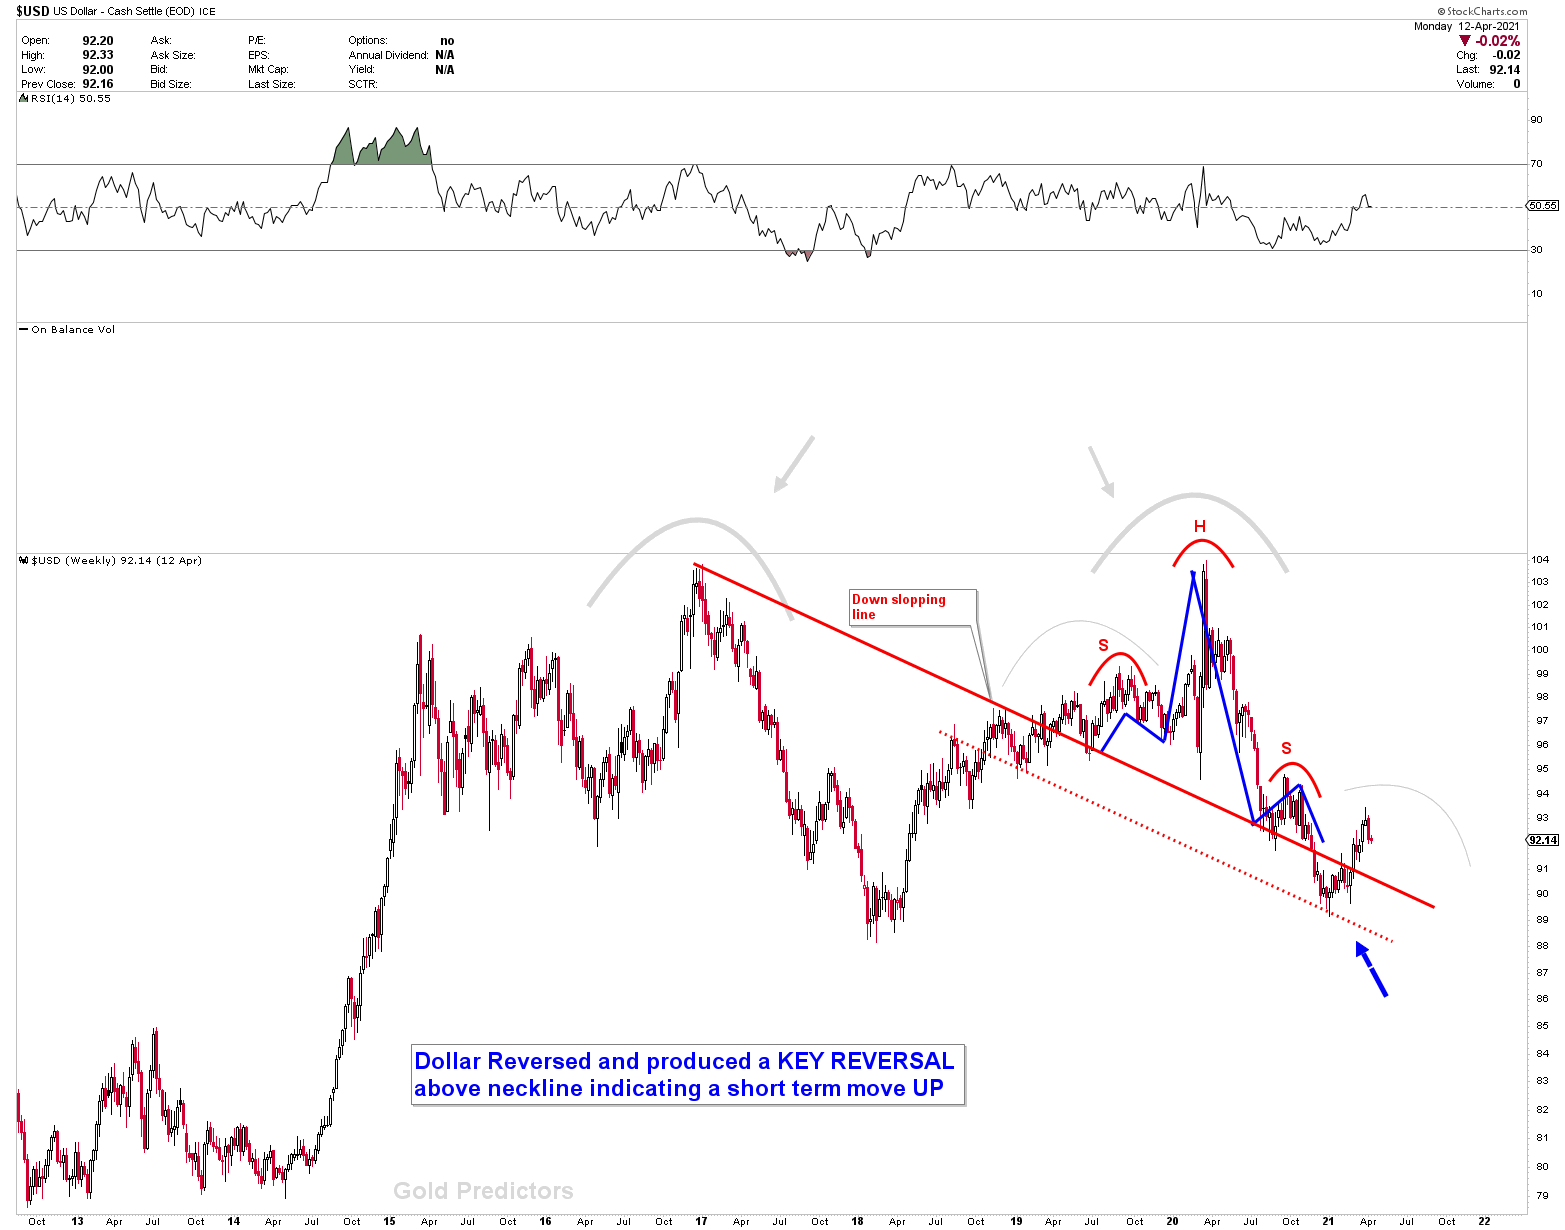
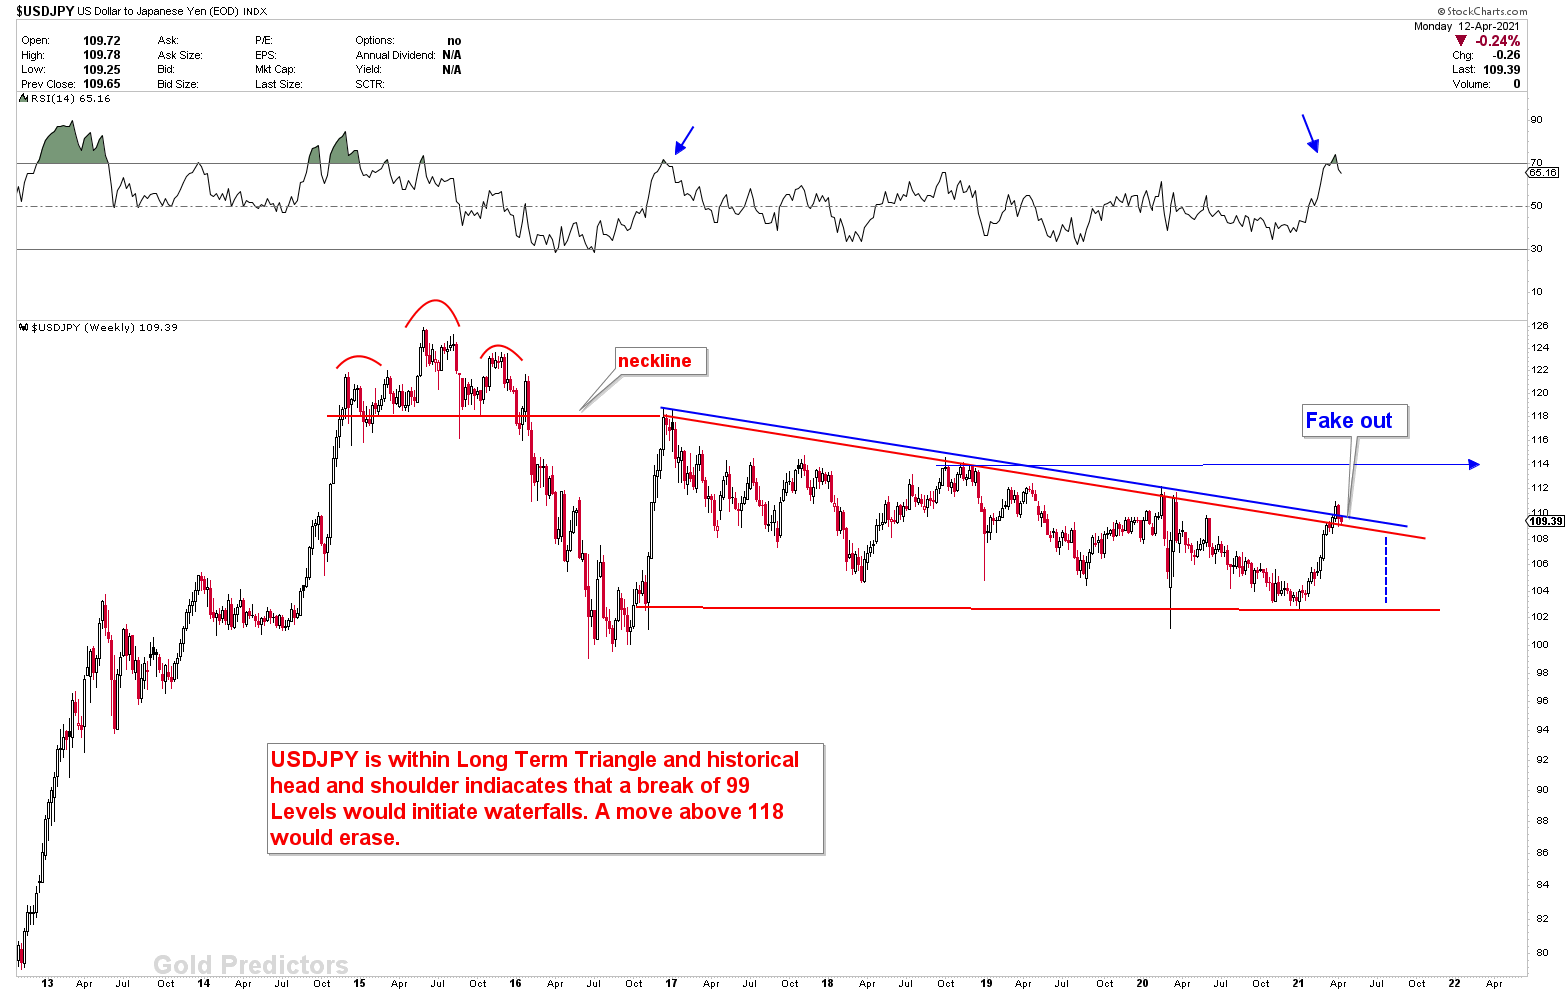
Last week, the US dollar weakened as yields fell, continuing to erode gains made in the second half of March. After the much stronger than expected March employment data, the dollar’s inability to gain may have prompted profit-taking. China’s trade surplus shrank to $13.8 billion in March, down from $37.9 billion in February and $65.4 billion in January. We remain bearish in dollar but the bounce which was started from our major support area is still not over and dollar’s flight to safety is continue. We expect the US dollar flight to safety will end in the near future. US Dollar rally from the inflection point is underway, as seen on the monthly chart, and it is expected to finish soon. Prices will drop rapidly if the US dollar breaks through the inflection point on the monthly chart. This monthly inflection occurs in the blue channel, at the neckline of M type patterns formed by a double top on the US dollar’s monthly charts. The chart depicts a strong bearish outlook, implying that the US dollar’s recent rally will soon come to an end. The double top is very obvious when zooming out the US dollar chart on a weekly scale, with the head and shoulder with the downward sloping neck line. Although some analysts may agree, the chart continues to perform admirably. If the dollar breaks the red line (neckline) at this point, another round of selling pressure will begin and confirm that the US dollar rally is end.
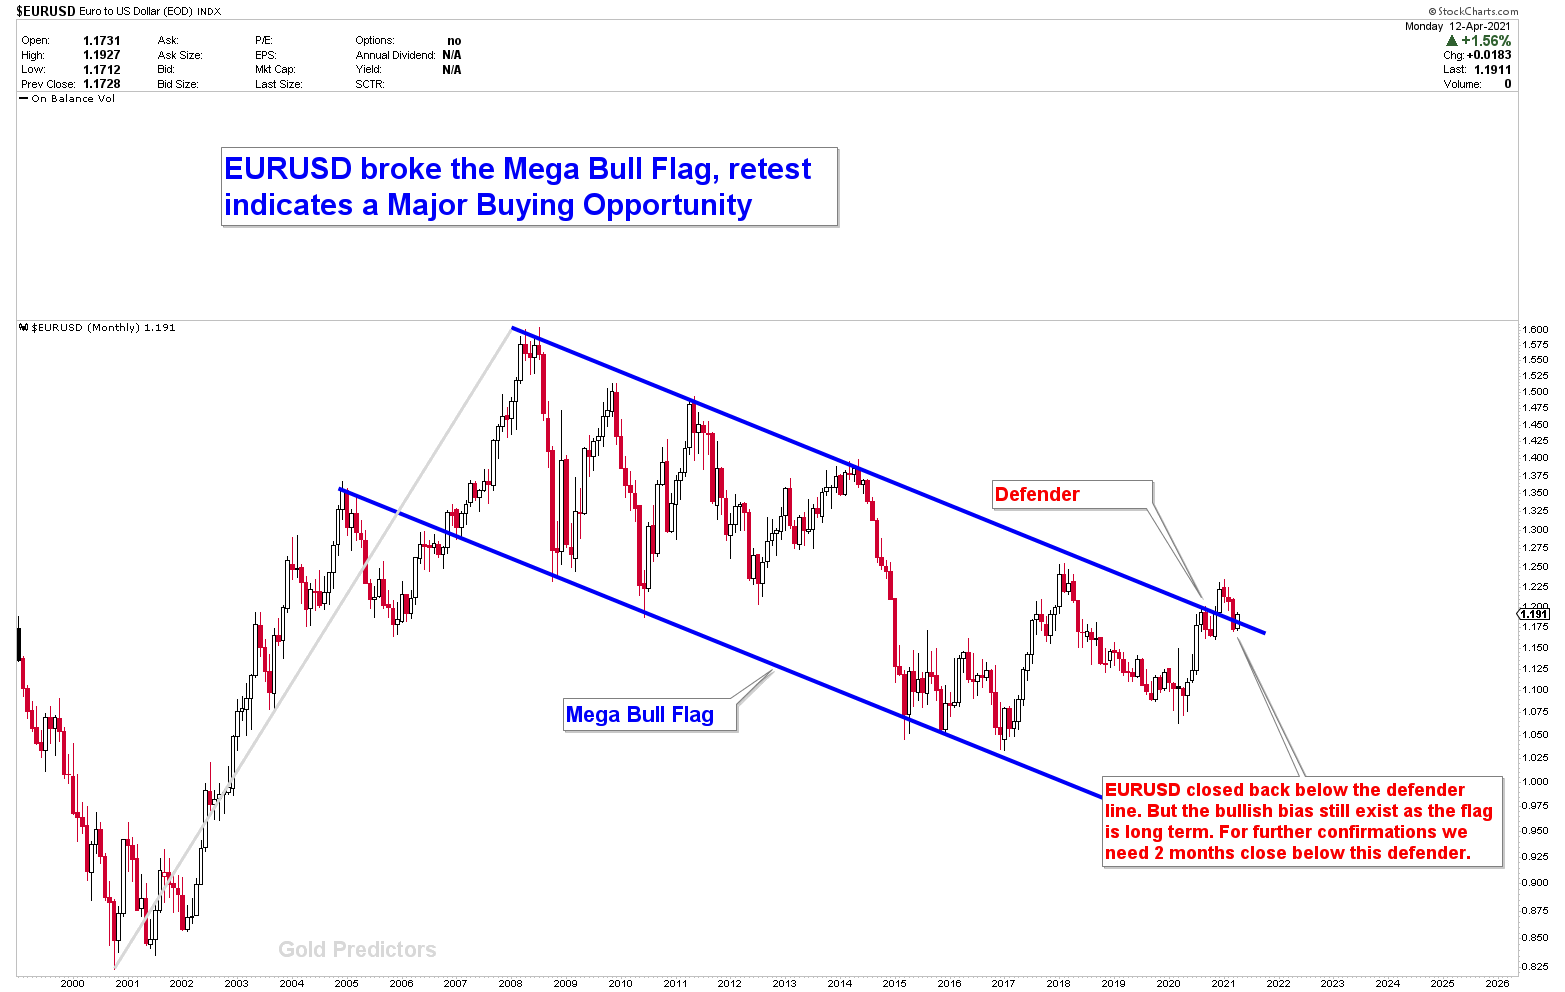
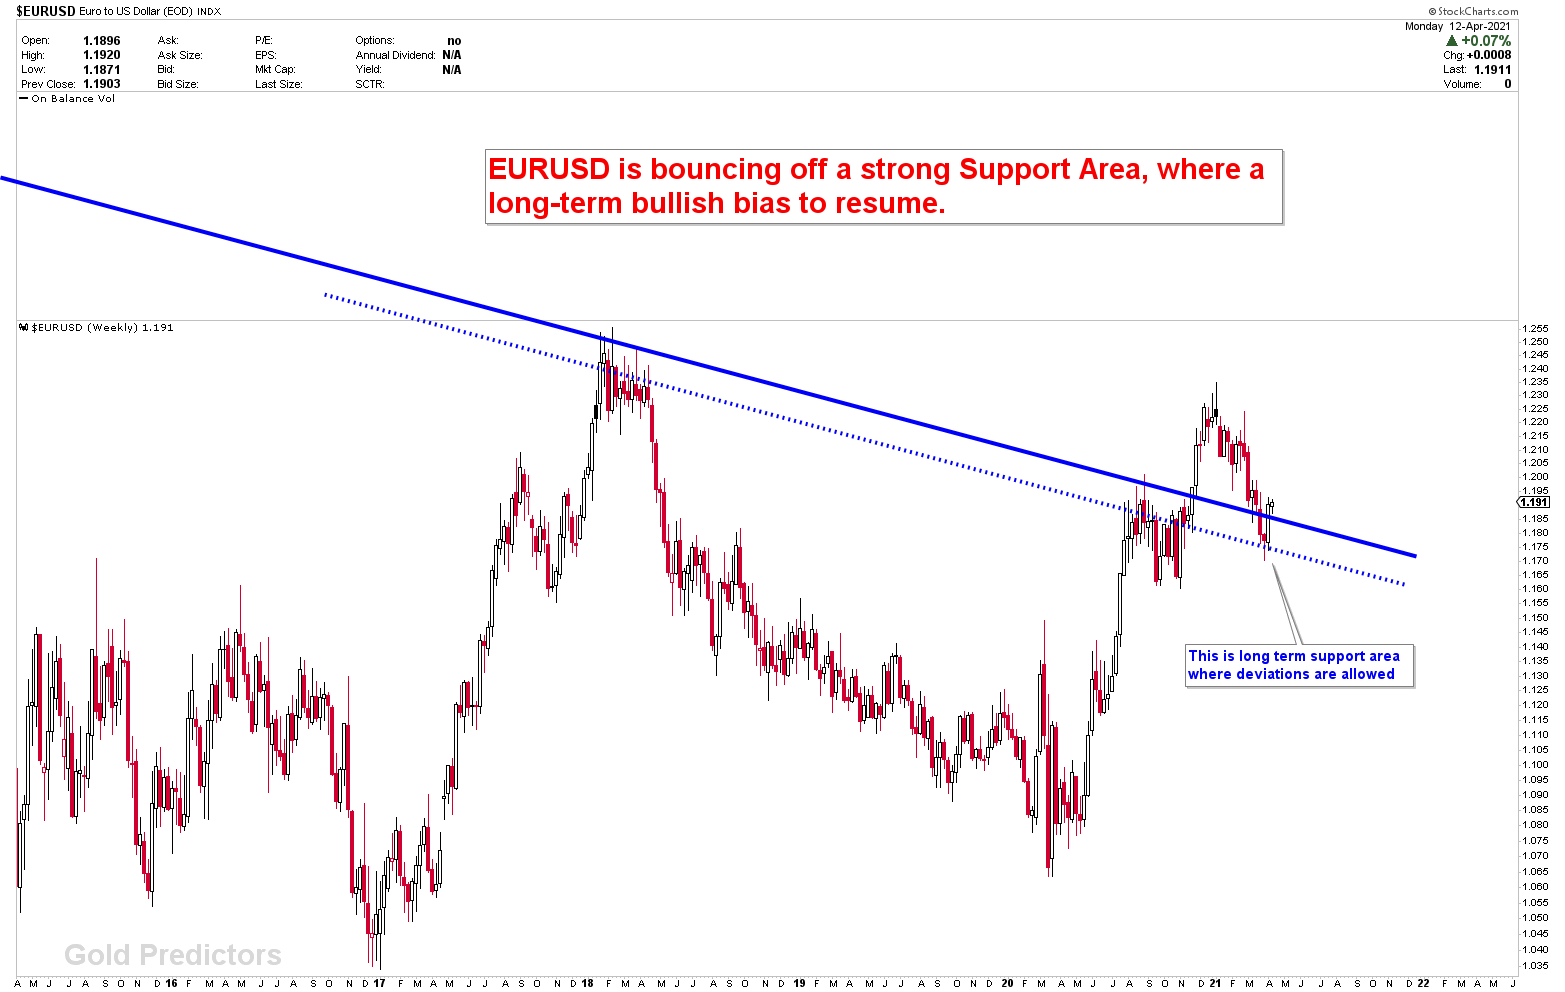
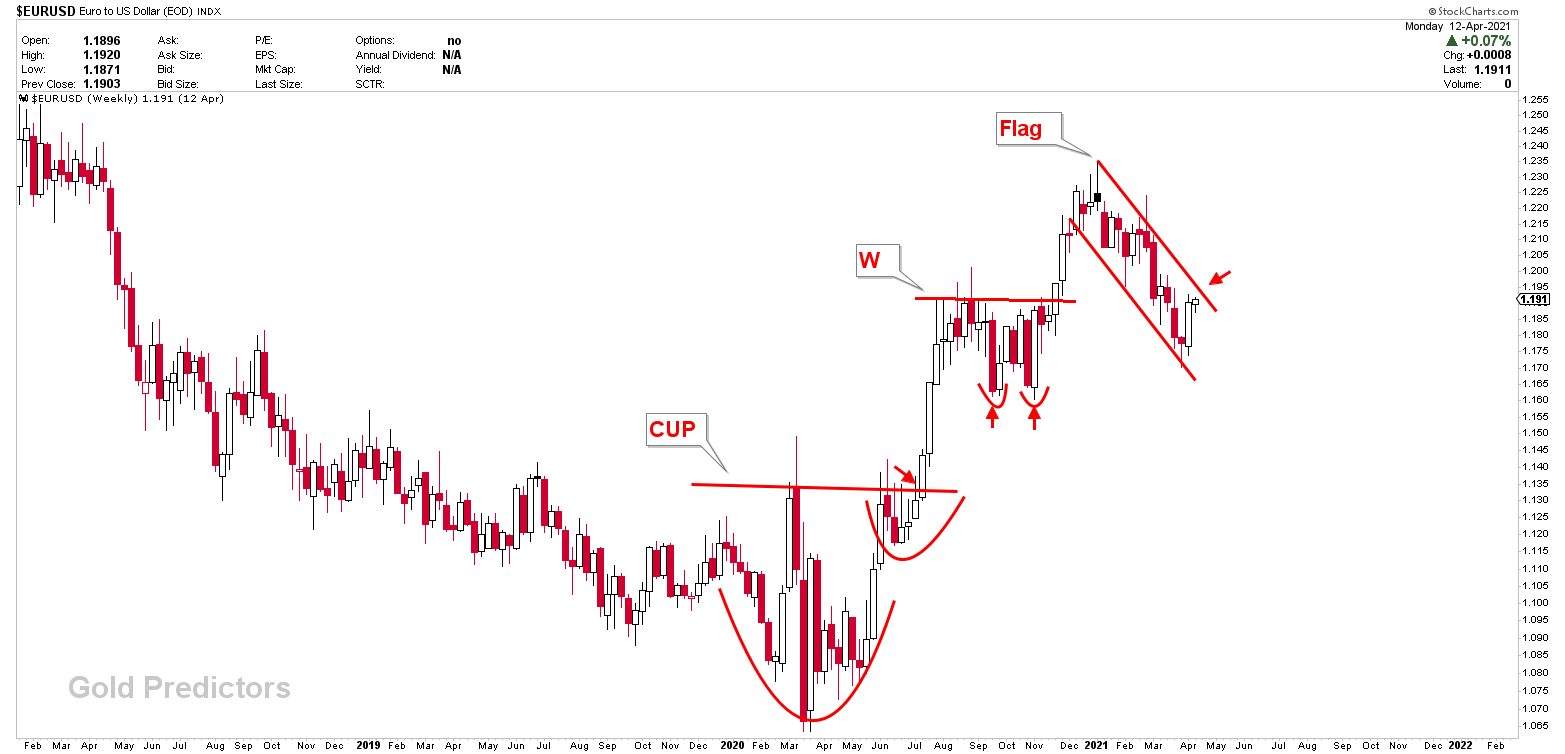
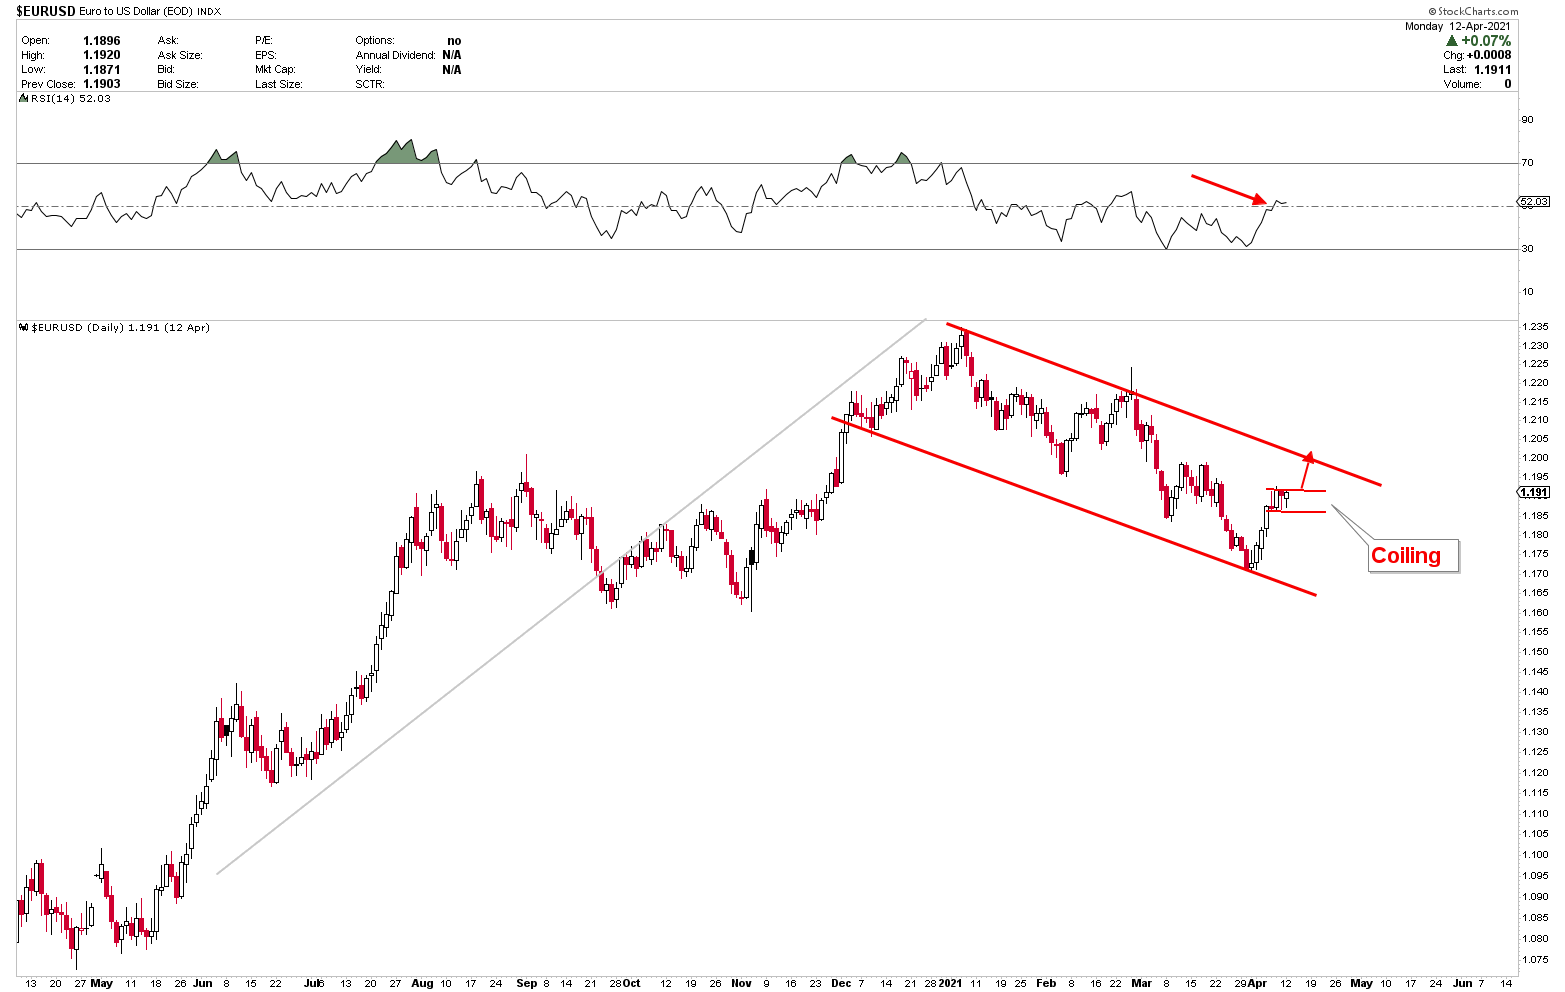
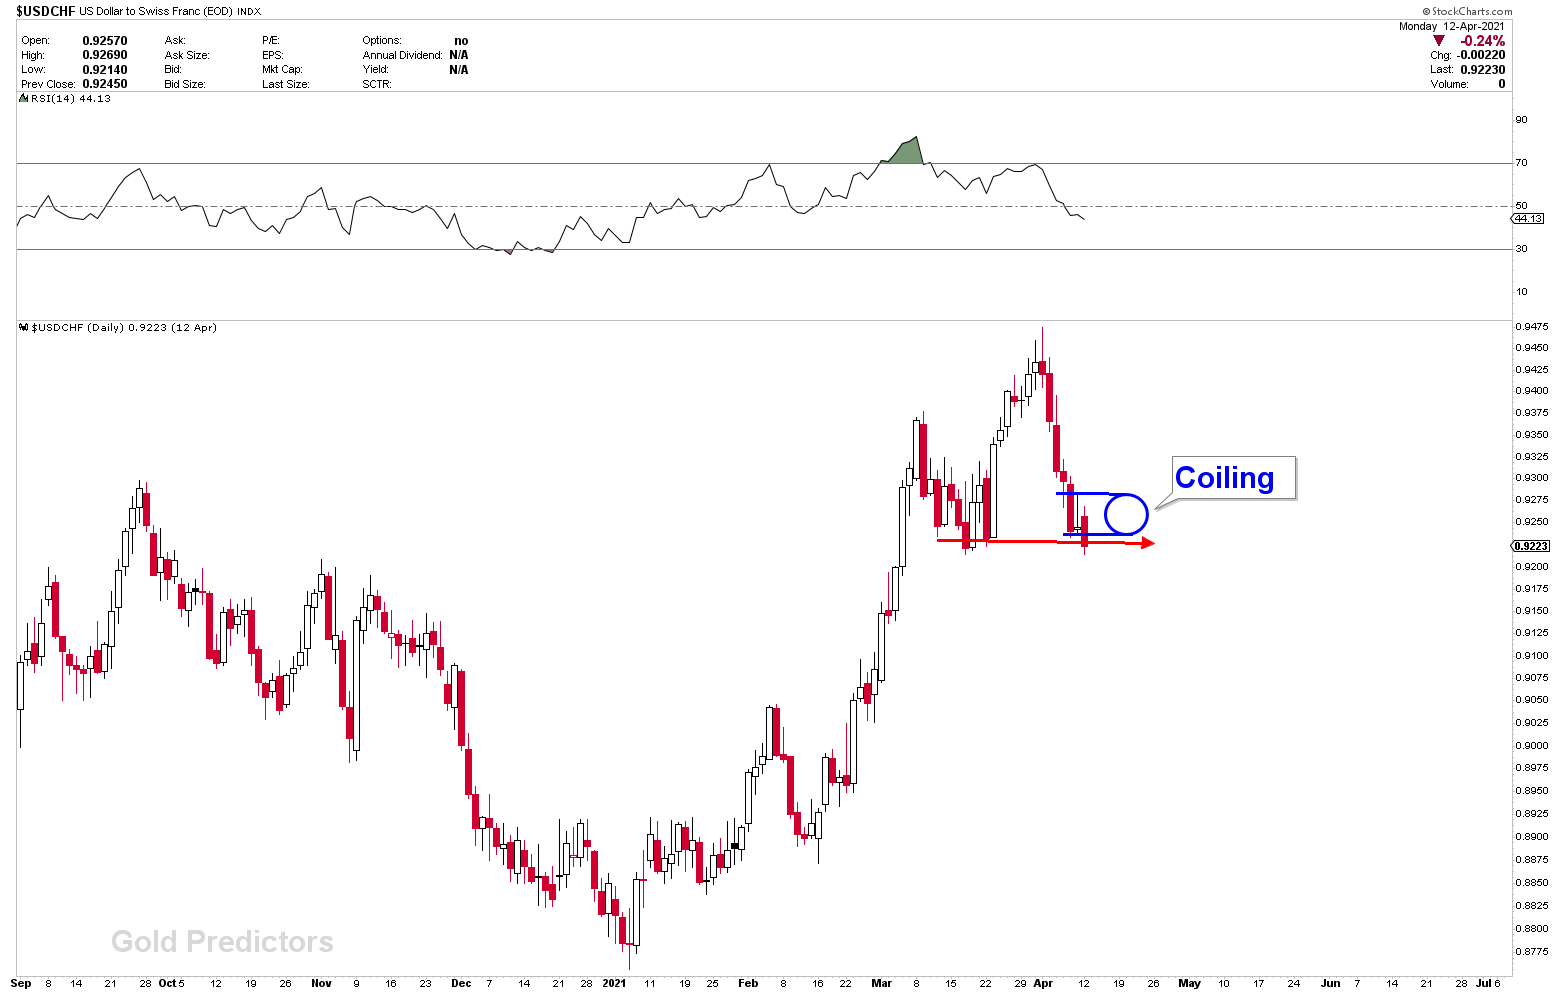
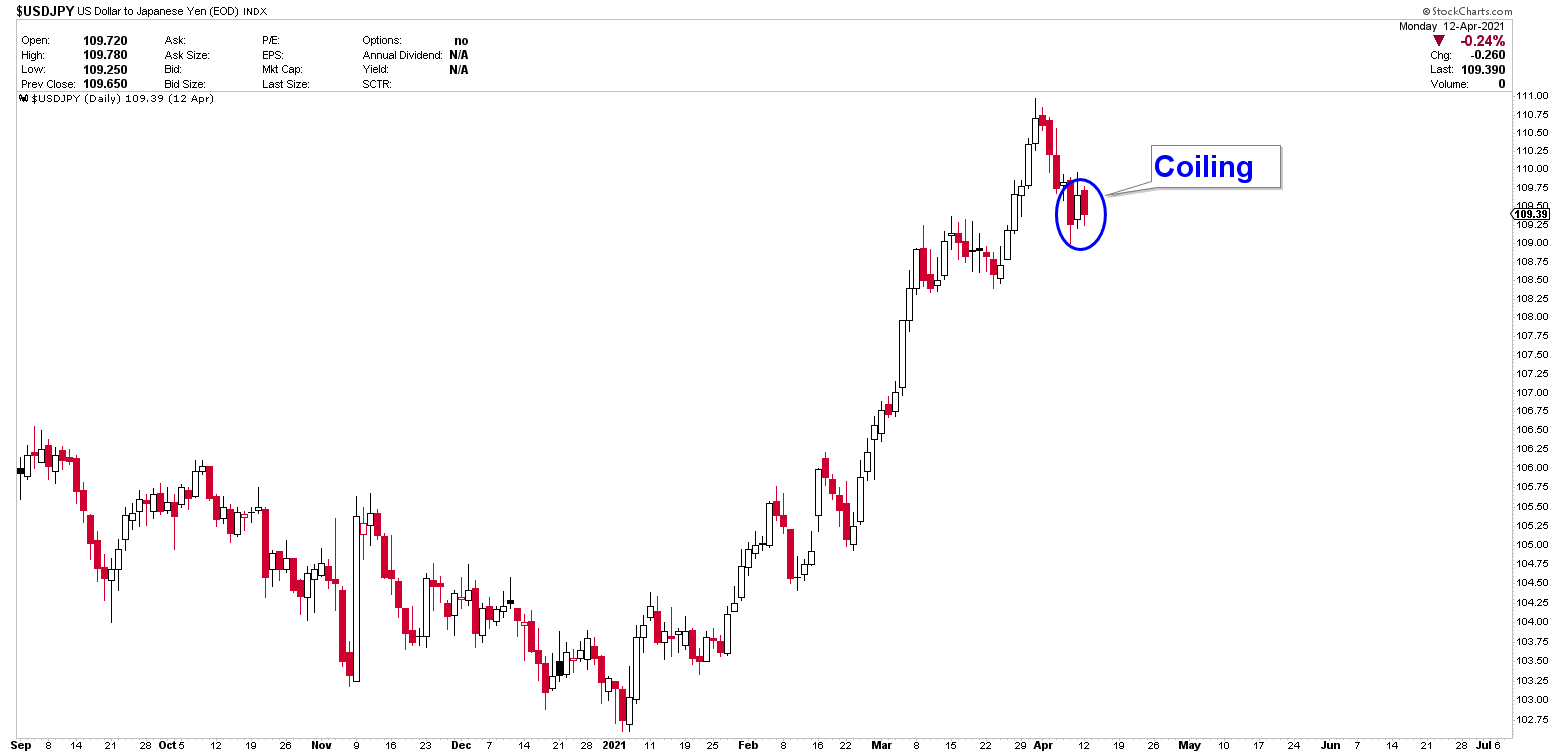
With that said, EURUSD pullback to the defender support line where a strong bounce from the support area was expected. As this is long term defender so a deviation of 200-300 pips is normal. The month of march and the quarter closed below the defender line and to confirm this, it requires 2 monthly close below this line to favor that price has move back inside the flag. However, on weekly chart the story is very clear. EURUSD bounce from the dotted blue line last week due to the US dollar weakness. The price successfully closed above the blue line after the instrument bounced off the dotted line, indicating that prices are about to rise. (we are still on caution with USD dollar pairs specially EURUSD). After erasing the Broad scale Flag, the weekly EURUSD charts show that price formed a cup and handle bottom, with the breakout leading to higher prices. The instruments advanced again after the price formed a W type bottom with a breakout at the neckline. Price is currently forming a type of flag. If this flag is breached, the EURUSD will continue to rise, signaling the end of the USD dollar rally. When viewing the EURUSD daily chart, it is clear that the price is forming a double coil to store energy. If the instrument breaks through 1.1925, the stored energy could be released to the upside, potentially leading to higher prices. (Despite these facts, we remain cautious in the USD Dollar). USDJPY and USDCHF are two other major USD dollar pairs that show a coiling on the daily chart, indicating that they are storing energy and that the release of that energy is dependent on the breakout. The types of patterns and price developments suggest that energy will be released to the downside, which is bearish for US dollar, but in light of these facts, we remain cautious of the US dollar rally and will wait for more confirmations.
Australian Dollar on the Inflection
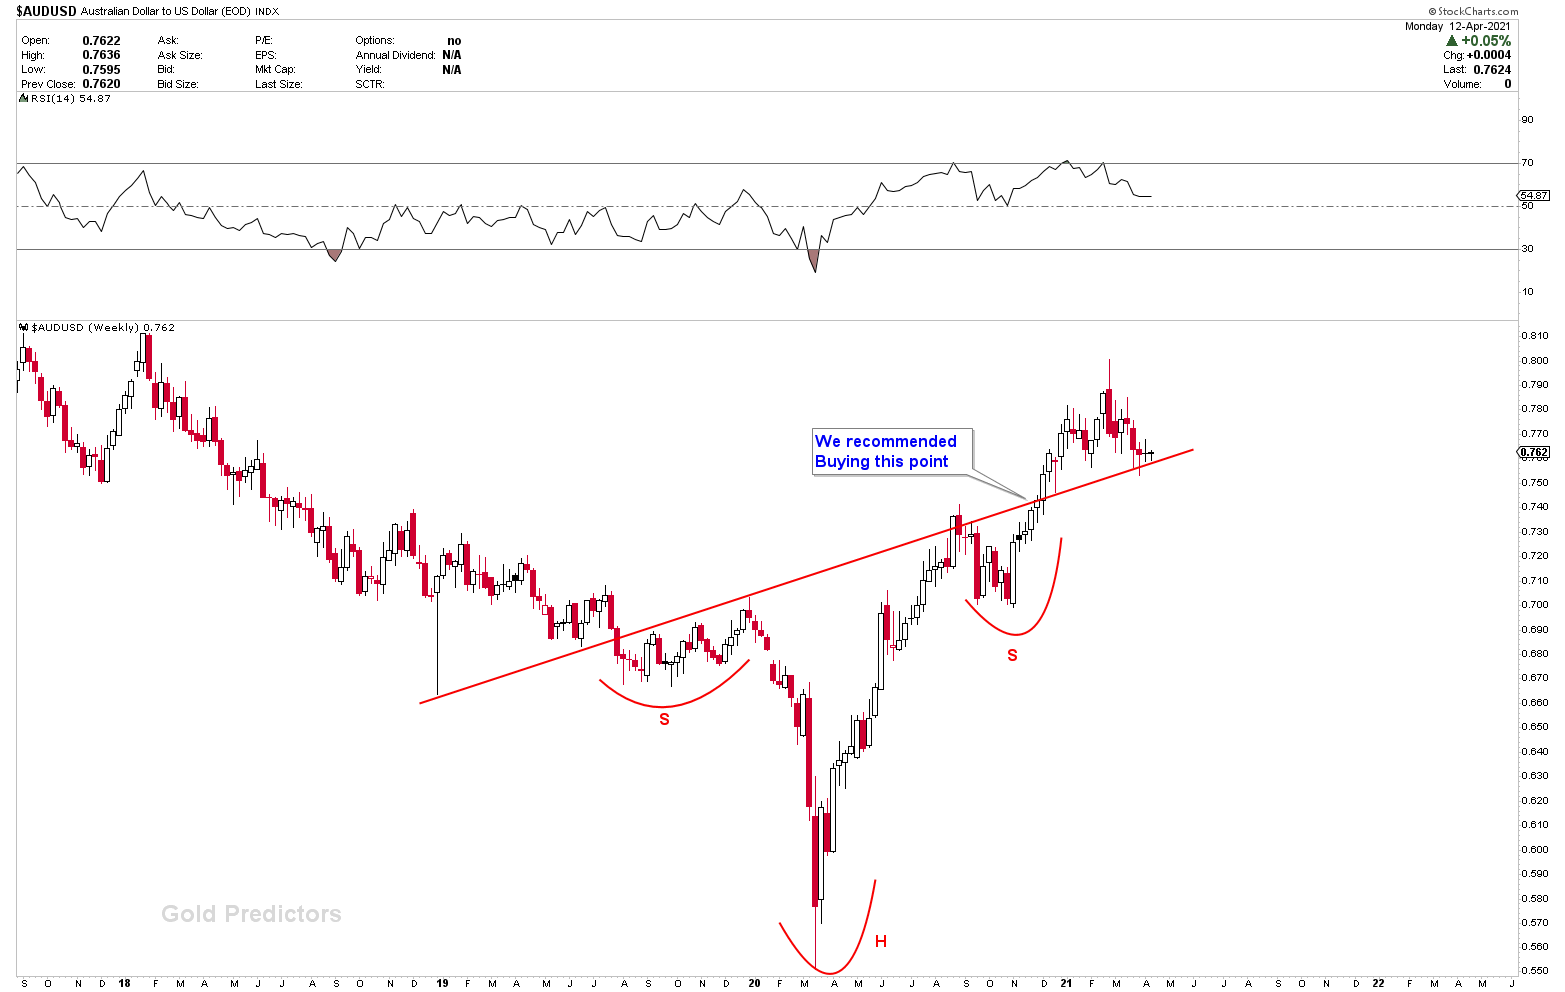
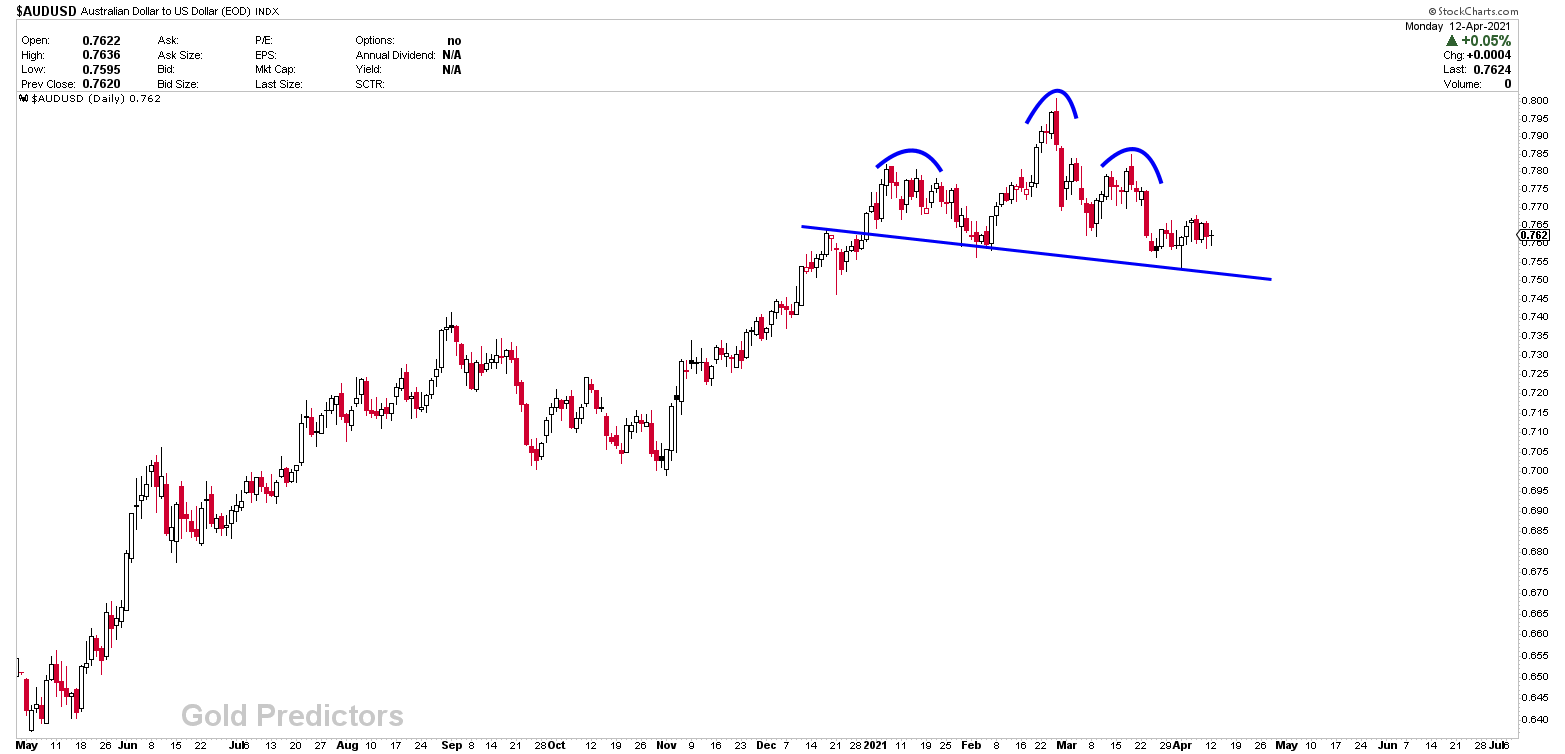
The Australian dollar reached a high of $0.8000 in late February. It dropped to around $0.7600 and has spent the last three weeks trading in a half-cent range around that level. From March to June last year, Australia lost around 350k full-time jobs. It has recouped all of them. The unemployment rate, on the other hand, rose to 5.8% in February from 5.1 percent at the end of 2019. At the neckline breakout earlier this year from the broad inverted head and shoulder formations on weekly AUDUSD charts, we recommended buying AUDUSD and AUDCHF. And both instruments rocket higher after our suggestions, with profits of around 500 pips. The reason for the weakening of the Australian dollar can be seen in the chart below. The weekly AUDUSD chart clearly shows that the instrument has pulled back to the neckline support where the breakout occurred. Because of the daily instrument chart, this is currently being treated as a very short-term inflection for the Australian dollar. A breakout from the blue neckline on the daily AUDUSD chart would start the move down and confirm head and shoulder. Because the neckline on the daily chart is the same as on the weekly chart, this area is treated as a significant number in the Australian dollar.
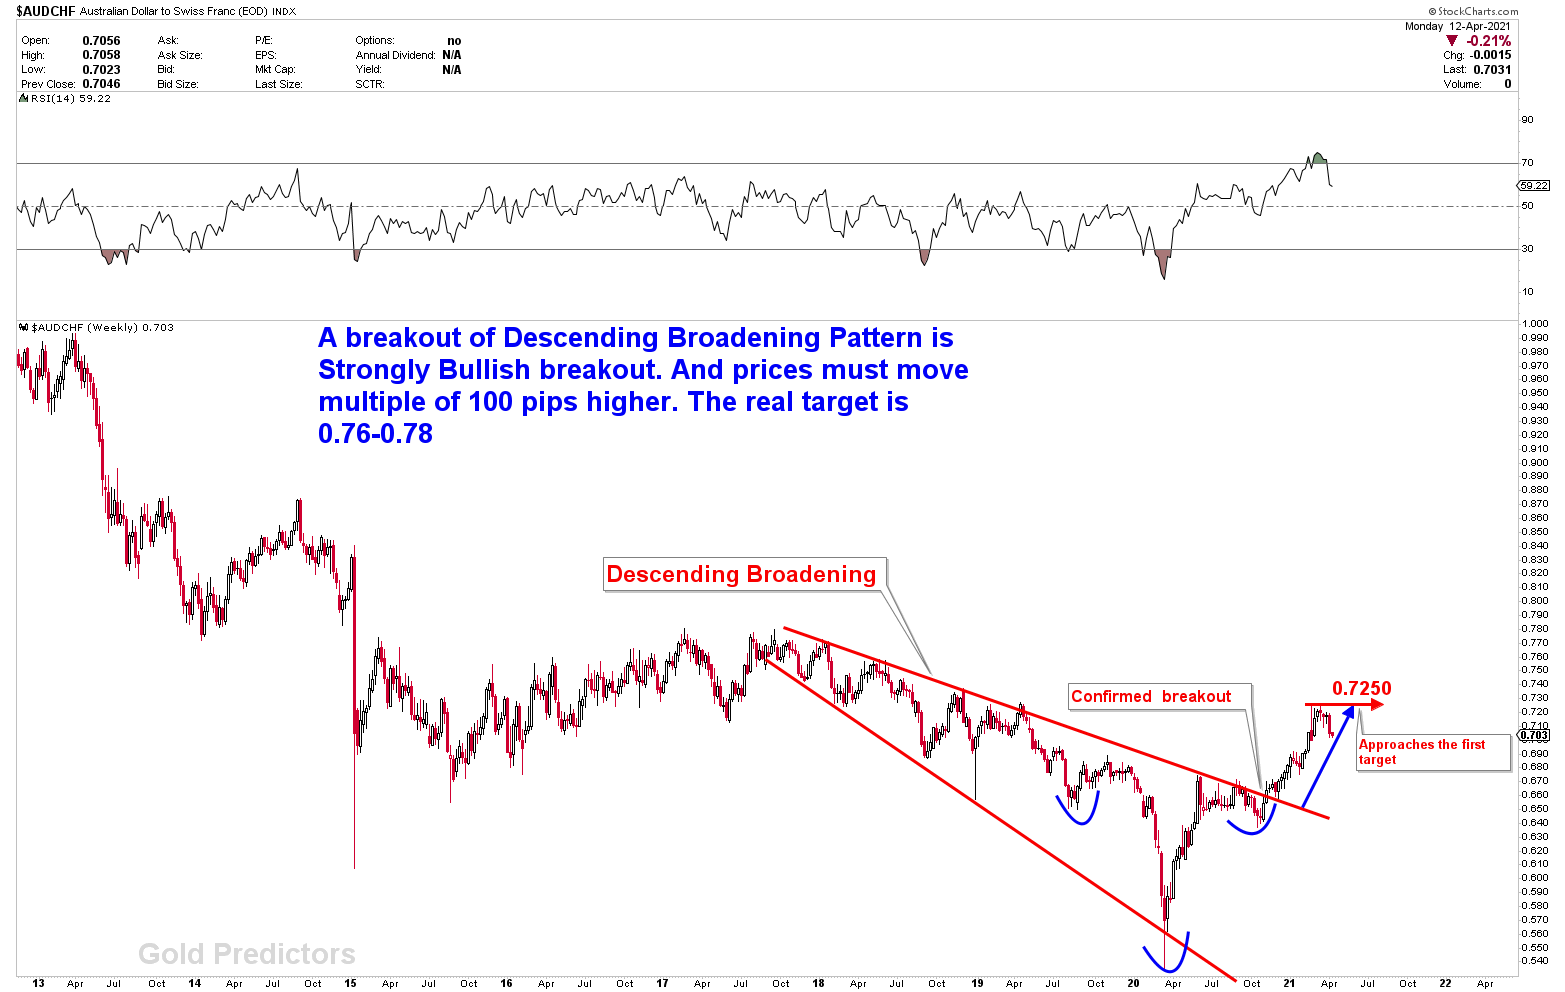
On a broad scale, the AUDCHF chart presented to you long time ago, was the formation of a descending wedge on a broader scale. The big breakout from this descending wedge was expected a large move of hundreds of pips. The initial target was set at 0.7250, and it was met just a few weeks ago. Price is barely pulling back after the initial target was met. On a long-term basis, this chart shows a very strong bullish bias, and the resistance of 0.7250 is also long-term resistance, so a strong pullback from this region will create a strong buying opportunity. The analysis is complemented by the development of a blue inverted head and shoulder on the same chart.
Interpreting the New Zealand Dollar Weakness
We have been discussing the New Zealand dollar as the weakest currency and pound as the strongest currency. With this combination we were looking for GBPNZD to blast based on the historical formation of the instrument and all. GBPNZD surged higher from last few weeks and hit our initial target of 1.98. Price will retrace back to bring more buyers. We remain bullish in this instrument as long as the price is above the baseline support. The formation of patterns are supported by a complex head and shoulder and then a W formations over the baseline, which indicate higher prices in the months ahead. Pound is retracing back from the strong resistance which suggest that this instrument might be under big pullback so be careful this week. The presentation of GBPNZD chart this week is to focus the long term outlook. However this week might be sideways until there is some meaningful setup. However, the New Zealand dollar remains weak, and the better instrument to watch is the NZDCAD, which is trending downward. The weekly, monthly, and daily charts from the previous report indicate that the pair is poised to fall. Any bounce in the instrument should be viewed as a selling opportunity. According to the analysis of the USDCAD, CADCHF, and EURCAD pairs, the Canadian dollar remains a strong currency. On April 21, the Bank of Canada will meet. Despite the fact that Ontario has reintroduced social restrictions and Canada’s excess fatalities may rival those in the United States on a per capita basis, the central bank will likely grow more confident in a strong economic recovery.
What To Expect From Japanese Yen and Dollar?
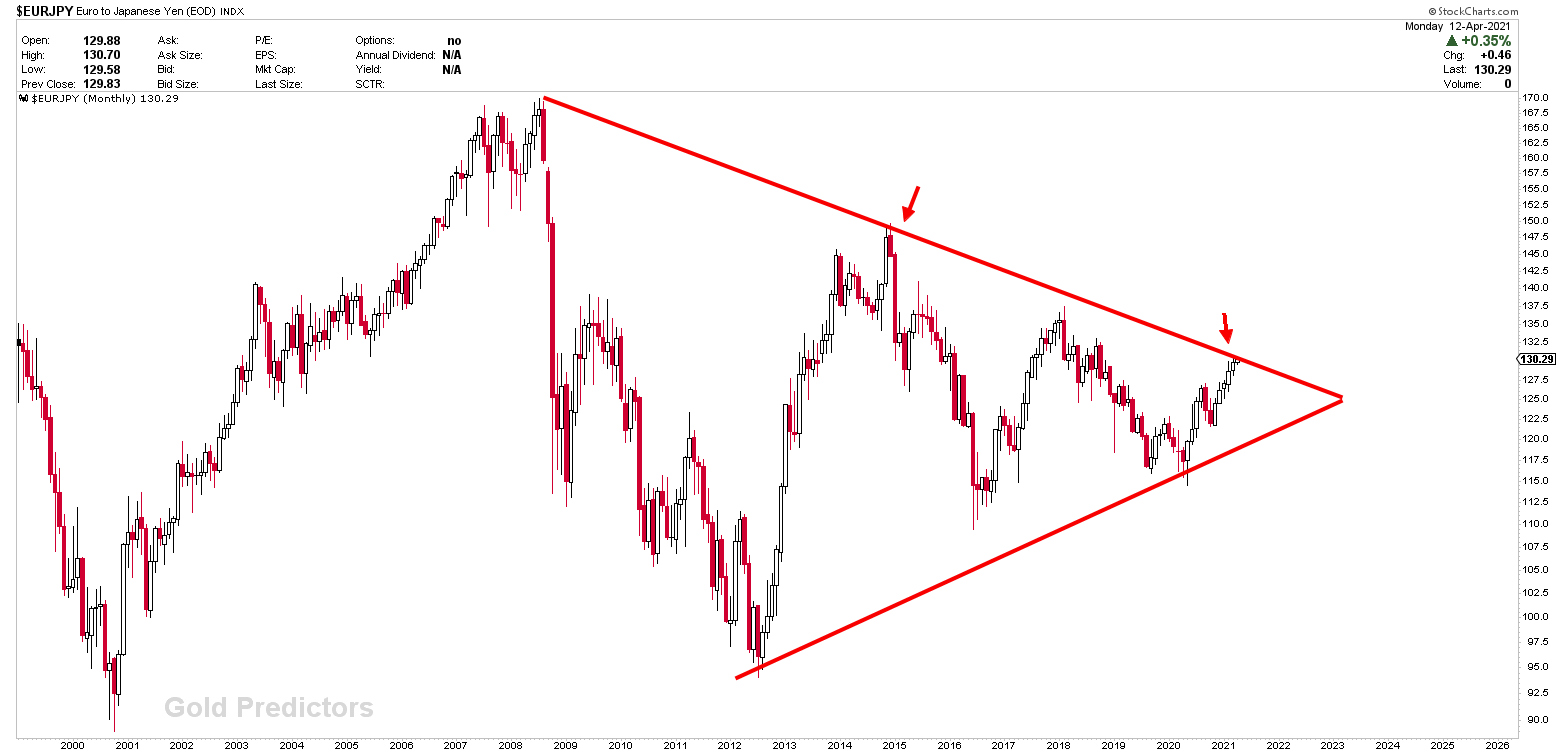
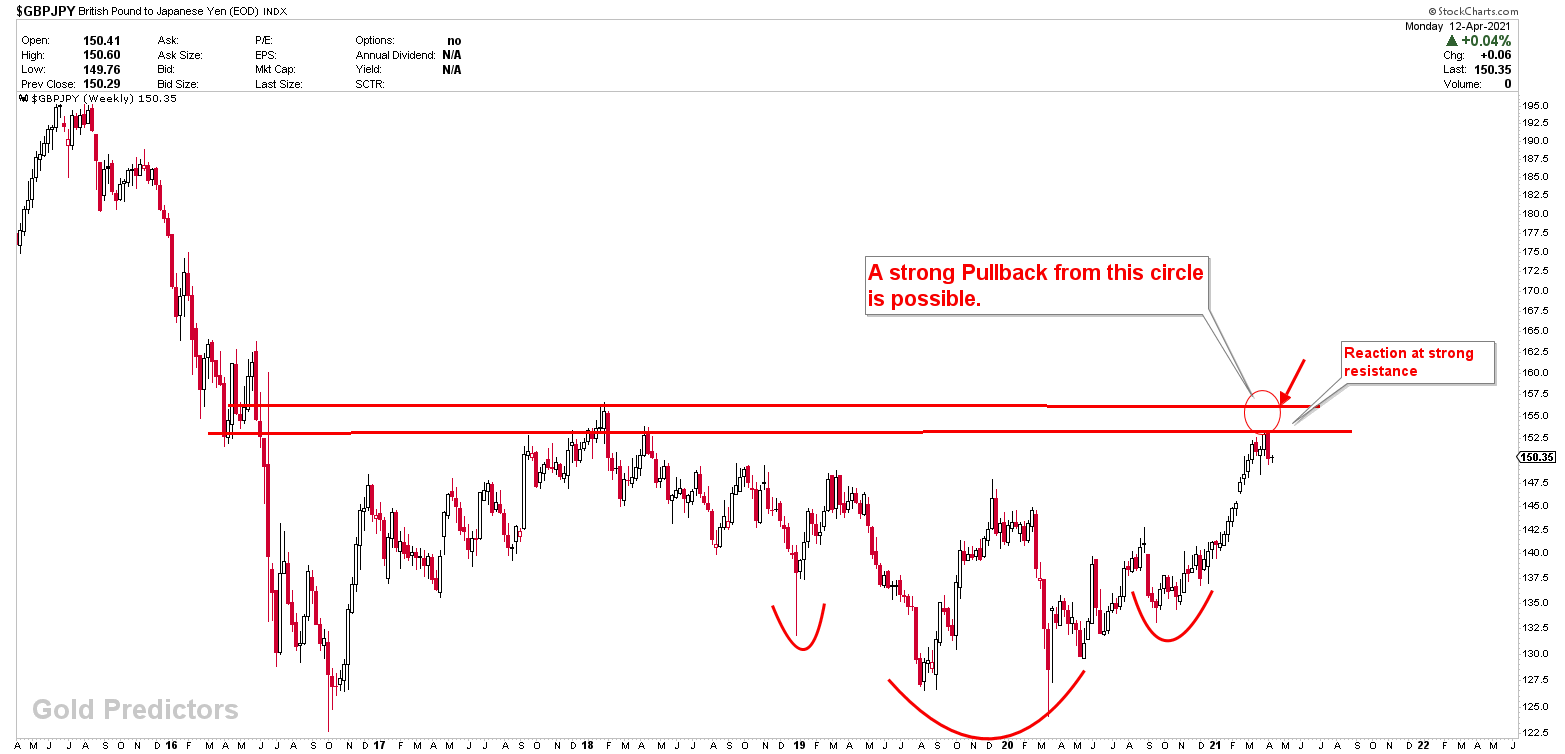
We’ve been talking about the long-term trend in Japanese yen pairs. The USDJPY, EURJPY, and GBPJPY, in particular, were all at major inflection points. Because the inflection points are long-term, there is a lot of variation in the numbers. As can be seen in the chart below, the USDJPY surpassed the area before reversing and closing under the blue channel line. Prices may correct lower, but the breakout from this area can not be ignored. EURJPY, on the other hand, is trading in a monthly triangle, which means anything can happen. When we look at the weekly chart of this instrument (which isn’t shown here), we can see that the price is looking to trade exactly at the area. With the Euro’s strength, a breakout is a distinct possibility. However, the possibility of a pullback is high. GBPJPY is also retracing its steps from the circle we drew three weeks ago. Price has not yet surpassed this line, and pullback is forming. In other words, a Japanese yen breakout from this area would end the long-term bear market.
Final Words
All of the major US dollar pairs mentioned above, such as EURUSD, USDCHF, and USDJPY, resulted in a double coiling effect on the chart. That means there is a reservoir of energy that, if released, could cause a significant price shift. According to price patterns, the chances of the stored energy being released to the downside are high, implying that the US dollar may end and EUR can strengthen, USDCHF can fall, USDJPY can drop. Despite the facts, we remain cautious about the US dollar until we have more concrete confirmations. As expected, the GBPNZD is pulling back from the 1.98 resistance level. In the meantime, the Japanese yen is retracing its steps back from the inflection points.
To receive the free trading alerts, signals and articles please subscribe as a Free member to the link below.
Note: The subject highlights the ideas and thoughts of the writer for educational support that can be used to enable the reader to become an independent thinker and decision maker.
