This section discusses the concept, as well as how we carry out gold trade utilizing the methods described in the Trading Methodology section. The price of gold has approached to a significant level of USD 1000/ounce. Spot gold hit USD 1045/ounce, which is close to the 1000 mark. The current action appears to be a bottom formation process, and if a bottom forms here and the price confirms the levels and breaks higher, the price could shoot quickly for a variety of reasons explained below.
Because 1000 was the long-term number, and if the bottom is forming at these levels, it’s a Bull case, and we’re leaning toward a Long trade.
Gold Cycle Calculation
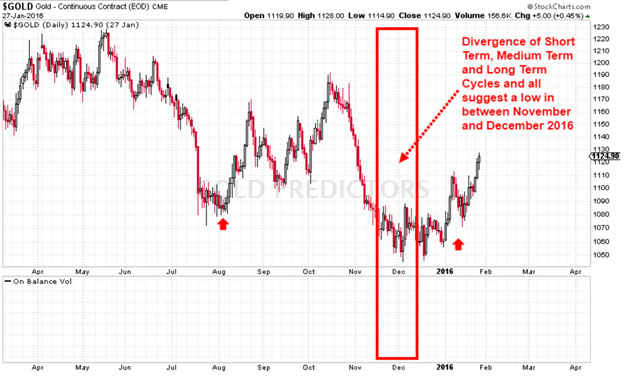
November and December 2016 are the months when a Medium Term Cycle will end and a new cycle will begin, potentially leading to higher prices in the next 4-6 months. More importantly, long-term cycles are approaching at eight-year intervals. If medium-term cycles act here and gold completes its bottom formation process, long-term cycles may begin here as well, and gold could shoot to 1500 zones. The area for long-term investors to accumulate gold is 1100-1000 or 800-900. Our chart mining engineers calculate the exact time for the bottom with some deviation as per historical gold data from 50 years record. The statistics are very unique and the time when all cycles meet together is known as Diverged Cycle. This cycle is proved to be the major historical bottom on charts and perfect for gold trade entries.
Technical Confirmations
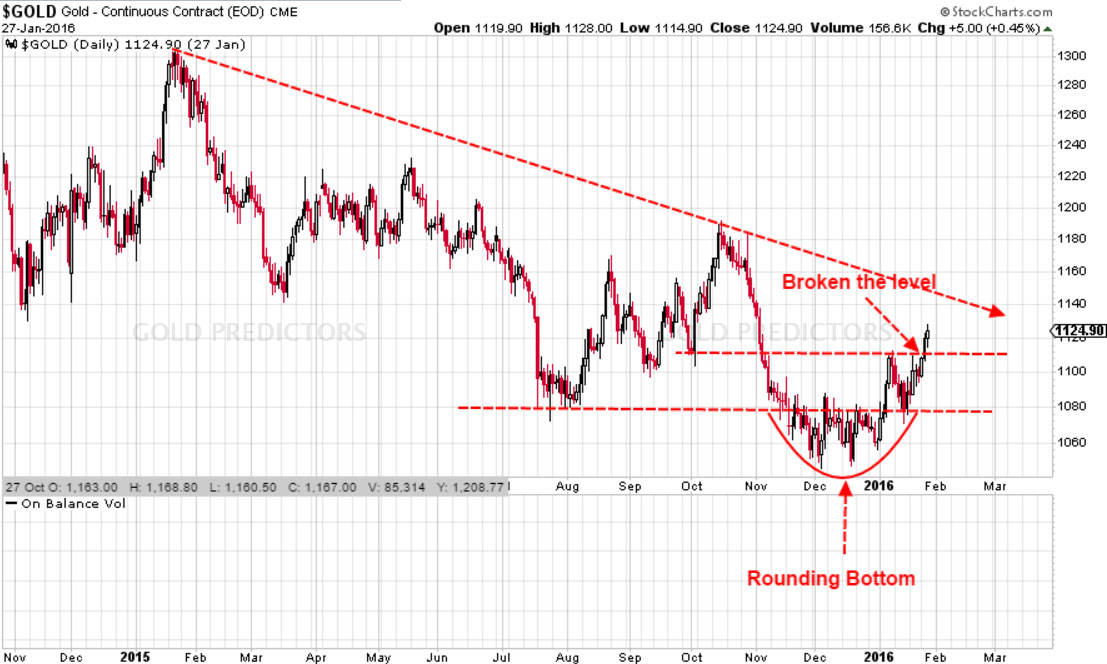
As can be seen in the chart, Gold has broken both of the levels that were required for Trend identification. For the time being, a very short-term trend is positive. And if the Cycles diverge here, we might see all of the barriers broken. Because gold is at the start of a new trend, we will see a retracement back to the 1110 level. We want to enter the market because the picture appears to be very bullish, so set the Gold Trade Pending Order Buy Limit @ 1113. Look at the other charts for more confirmation.
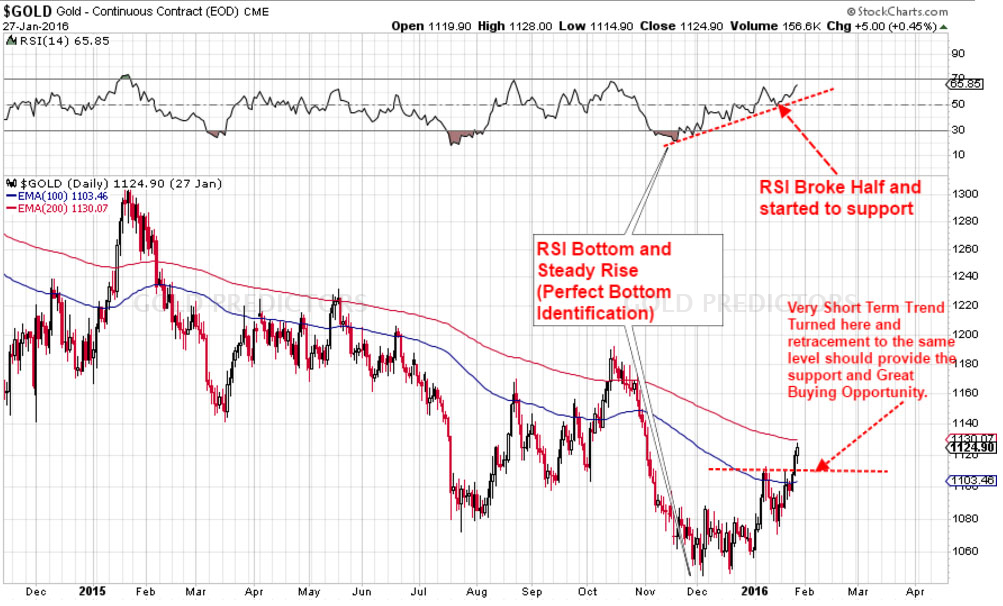
This chart clearly shows that the very short-term trend is positive, and that Gold is about to retrace to 1110. Gold is interestingly close to the 200-day moving average, implying that a retracement is very likely . RSI may be around 50 or above 60 when Gold retraces towards 1110.
Naked Charts Analysis
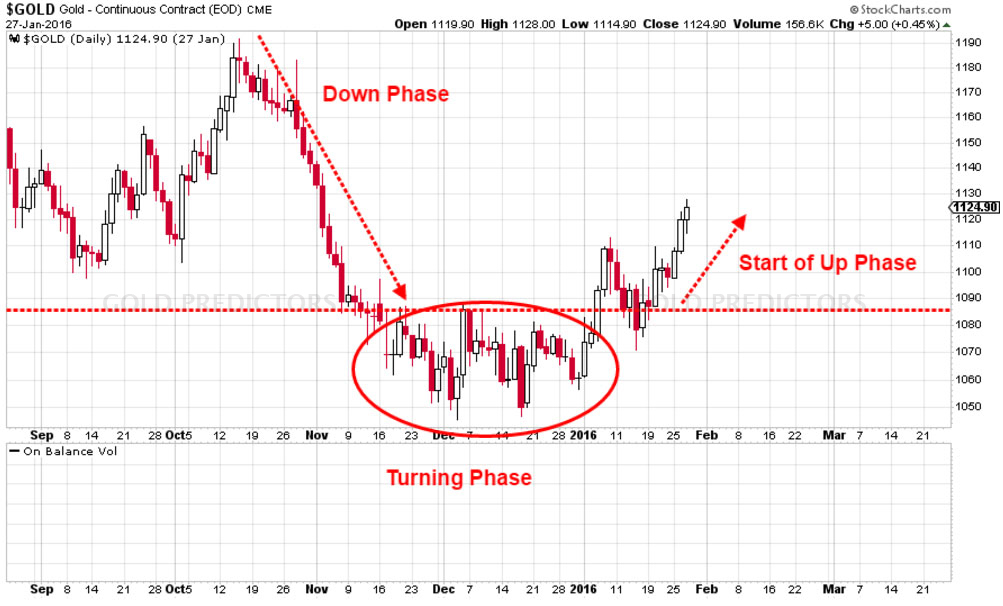
Gold has confirmed the Turning phase, and the break of 1110 marks the start of the UP phase, according to Naked charts. As a result, more purchasing should take place here. While Gold is at the start of a new phase, the outlook is positive.
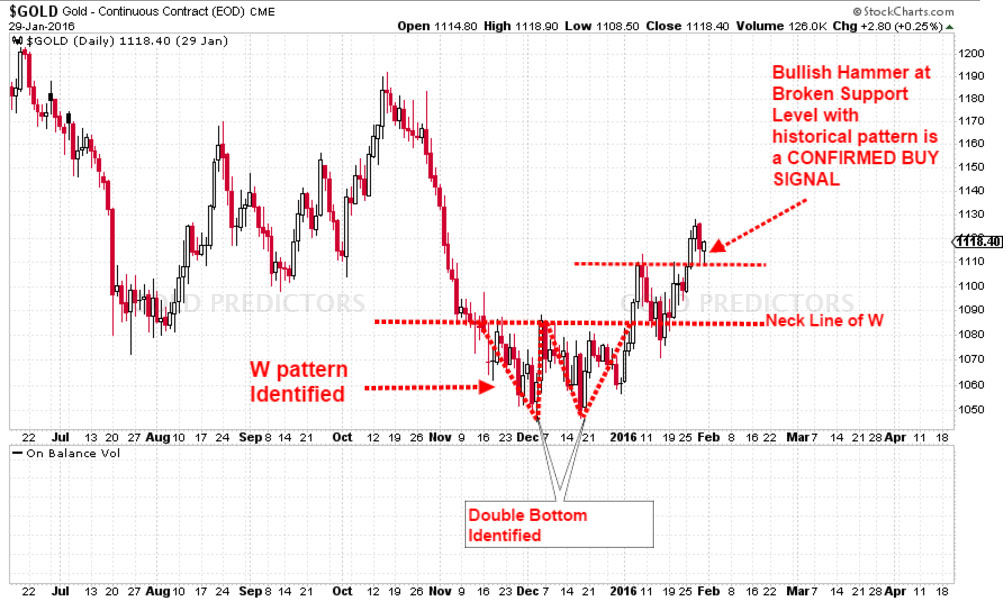
This chart explains how we use price action analysis to determine signal strength for all of our signals. The first step in this example confirmed that the Gold was in the UP phase. Gold produced the historically Strong pattern in the second phase. The W pattern indicates a significant upward movement. A double bottom has also been observed in the past.
Before the third step of price action verification, we placed the pending order on January 27 and filled it on January 29. However, after the order was filled, Gold produced a hammer candlestick on the support. This indicates that Gold Bulls have been confirmed.
Technical Analysis produced an early signal in our investment portfolio, but price action produced a delayed signal, as shown in the preceding paragraph. We got an excellent entry for our trade because we considered all of these analyses in our portfolio.
After the price action was confirmed, the next day trade received a Stop Loss of $1108, which is $2 below the previous day’s lows.
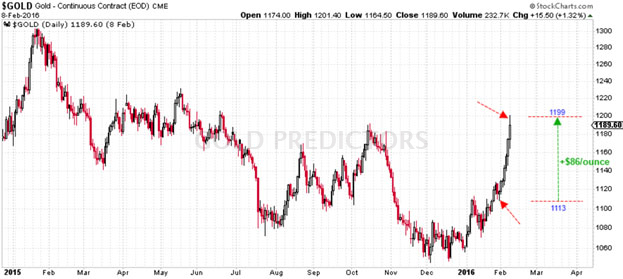
So signal was Like This
Bought Spot Gold @ 1113
Stop Loss: 1108
Target: 1200
Before the third step of price action verification, we placed the pending order on January 27 and filled it on January 29. However, after the order was filled, Gold produced a hammer candlestick on the support. This indicates that Gold Bulls have been confirmed.
Some Correlated Market Analysis
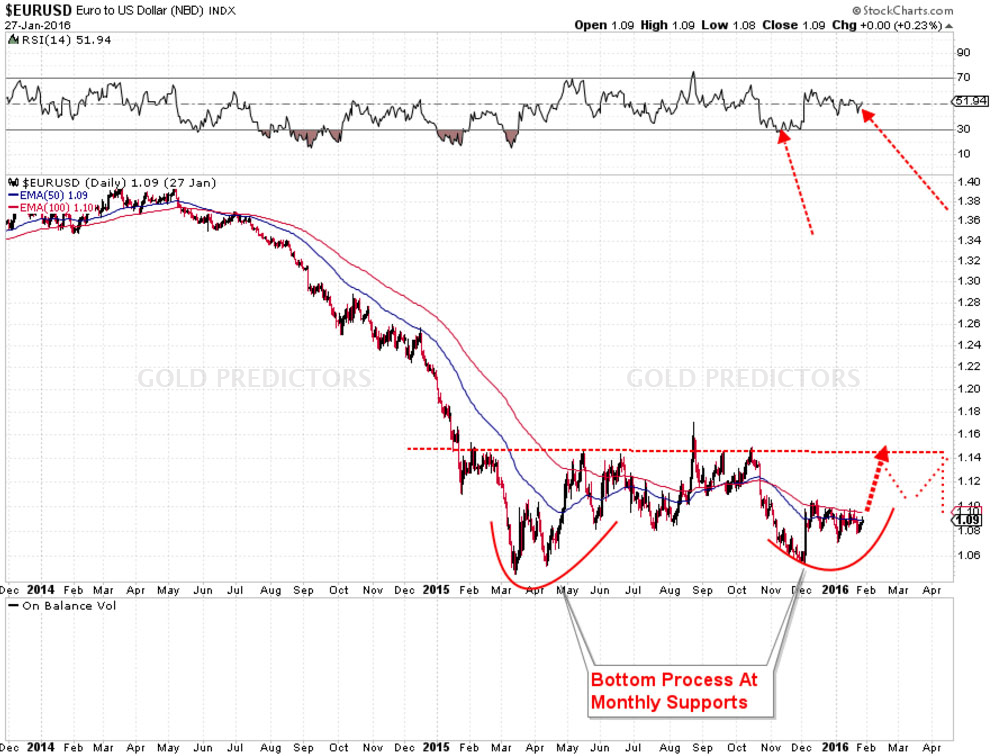
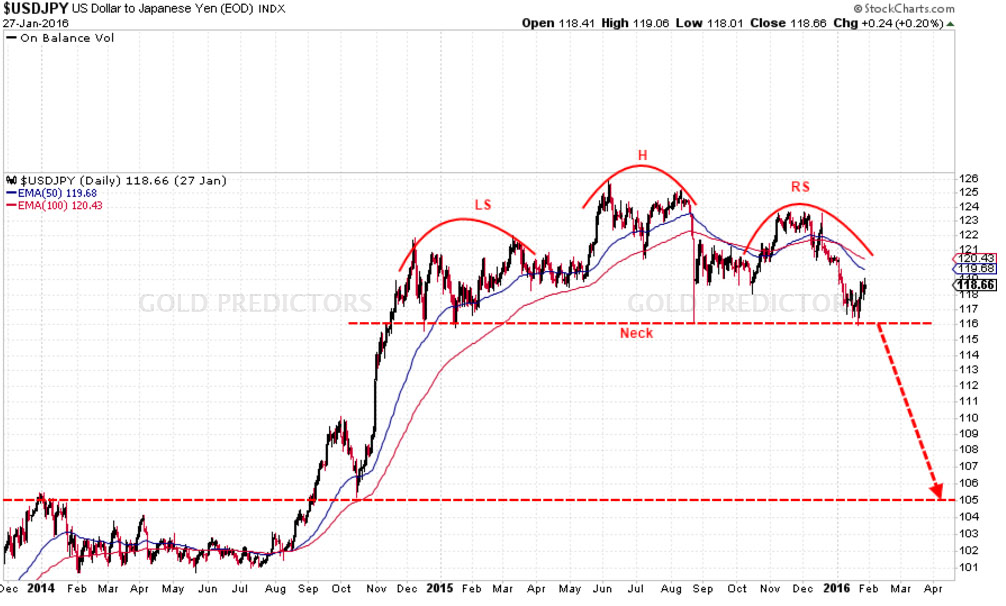
In the forex markets, the USDJPY is forming a super traditional Head and Shoulder pattern, while the EURUSD is forming a Double Bottom. These theories suggest that the dollar may fall in the coming days, giving Gold and Silver support. The dollar index wants to fall from its current levels. It is impossible to include every chart and piece of information on this page, but by analysing stock and bond markets, it is highly likely that Gold and silver will reach a bottom, and the USD will begin to fall.
This trade was successfully closed with huge profits.