


Price Action Strategy
Price action analysis is the use of natural or “raw” price movement of a market to analyze and trade it. That indicates you are making all of your trading decisions based purely on the price bars on a “naked” or indicator-free price chart.
This kind of analysis is a very detailed review, and there is a lot of studies to go through. The main point is to generate some profits in an investment portfolio, so while having all the price action studies in focus, we only consider some original studies in price action books that we believe to confirm the next move in the market.
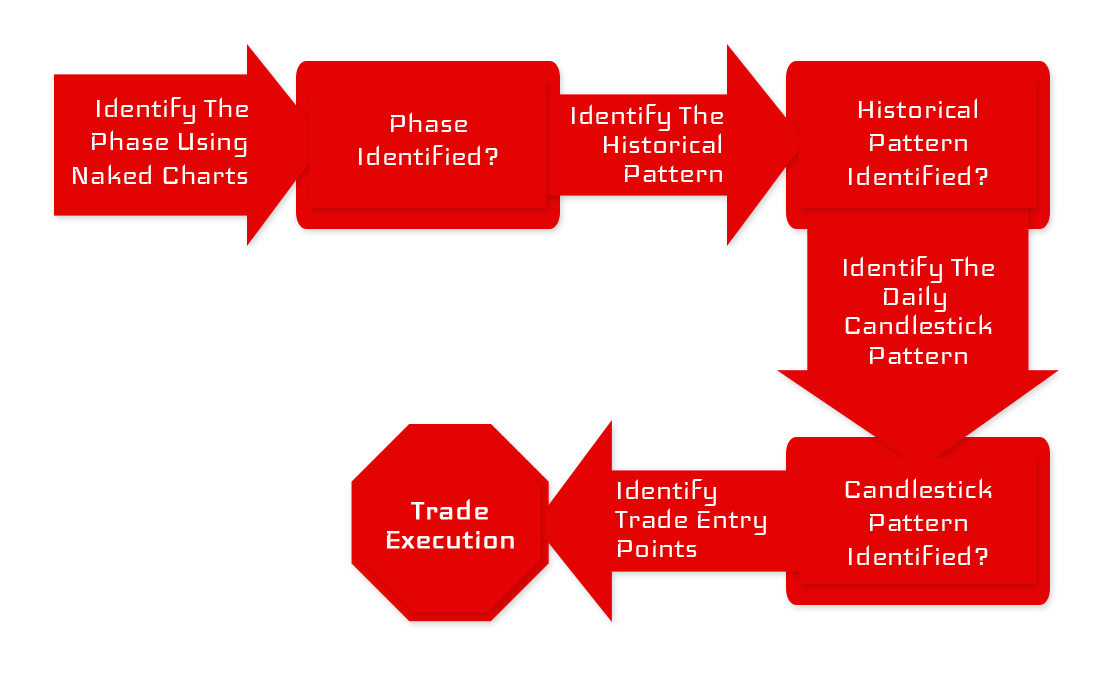
Gold Predictors believe that natural price movement of price is the best way to predict the future direction of any investment vehicle. As mentioned in other section, price action studies are broad. We keep all that knowledge, but trading should be simple. So we extract four steps to apply to generate the signal is, further filtered with technical and cyclical analysis.
Step1: Identify Phase using Naked Charts
Step2: Identify the historical price pattern Using Naked Charts
Step3: Identify the daily candlestick pattern
Step1: Identify Phase using Naked Charts
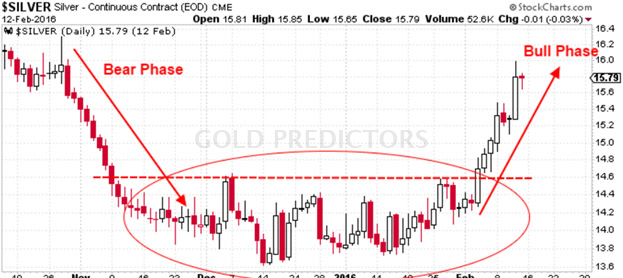
The most important part of price action strategy is to determine the phase and avoid trading against phase. Well, the identification step using price action analysis is different as compared to the identification of phase using technical analysis. Phase is identified using naked charts (indicator-free chart). The phase may be of three kinds; Bear Phase, Bull phase, and Turning Phase.
In the bear phase, markets are apparently moving down. While in the bull phase, markets are clearly going forward. In the turning phase, markets are shifting from bull phase to bear phase or from bear phase to bull phase, and price may be sideways. When the market is in a bear phase, the trade should always be Sell.
If Phase is Bull, the trade should always be Buy. During Turning Phase, the trade should be in the direction of a future phase. During the turning phase, the price is stuck in between some important barriers and produces some sideways actions until the fence broke.
In the following picture Bull phase, Bear Phase, and Turning phase are discussed explicitly to make the price action strategy easier for you.
Step2: Identify the historical price pattern Using Naked Charts
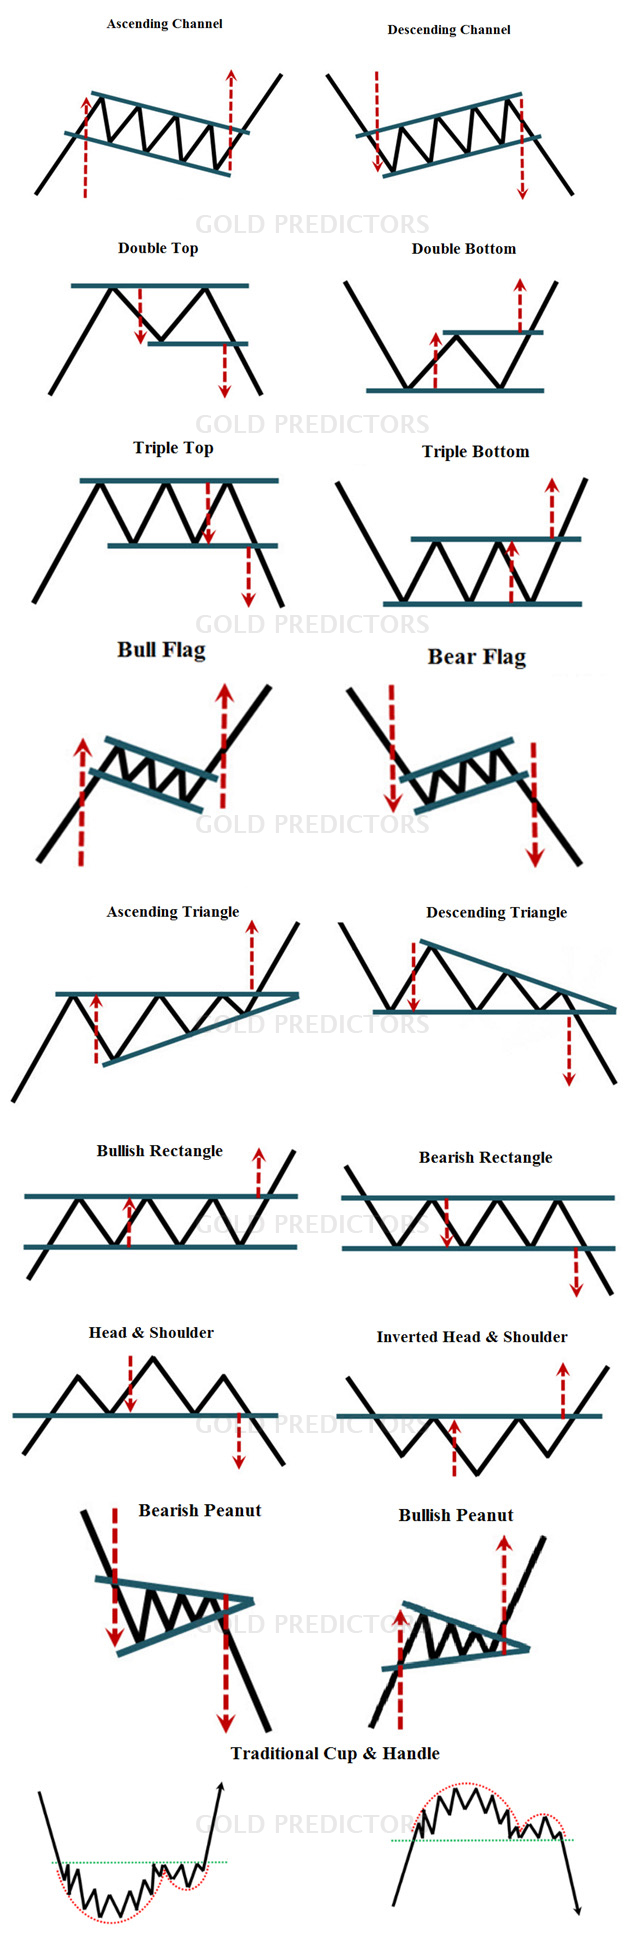
After spotting the current phase of the market, the next step in price action strategy is to determine the price pattern that the market has generated in the past. In the world of technical analysis, there are a lot of traders who talk about price action patterns, but few discuss how accurate they are in the live market.
There are some useful patterns that are very reliable to analyze and predict the next direction in your price action strategy. We don’t trade these patterns directly; they are only helpful to understand the current structure of the market and quickly assess our trading opportunities. We discuss here a few of the models that we believe are very reliable in markets for analysis and prediction.
Step3: Identify the daily candlestick pattern
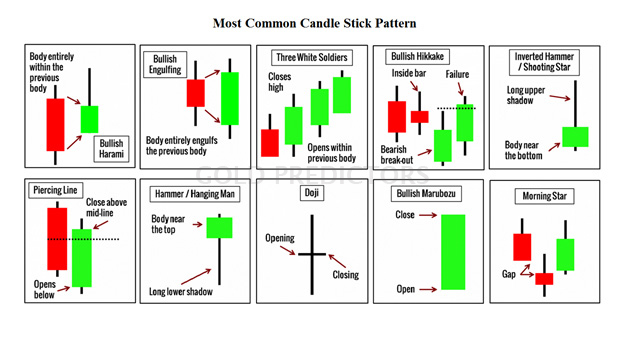
The next step is to enter the market for a trade after determining whether the pattern is bullish or bearish. And whether it is within the market phase. We use a daily candlestick pattern to enter the market, which confirms the historical price pattern. There are over 100 candlestick patterns in books, but you don’t need to go through them all. Trading, in our opinion, should be much easier. To enter the market, we only use a few candlestick patterns that are the most familiar and reliable.
The illustration depicts some of the candlestick patterns that we employ when entering trades. Each candlestick pattern has a different trading rule, as well as a different setup depending on the market phase.
Step4: Take Trade decision
Following the identification of the candlestick pattern, the final decision is whether the trade is a BUY or SELL, as well as the level of execution for a Buy. Each of the candlestick patterns has an answer to all of these questions. Each candlestick pattern has its own set of rules, as well as the ability to provide specific trade entries.
We used the same example for all sections to make it easy for viewers to understand. To see an example of trades, please click here.
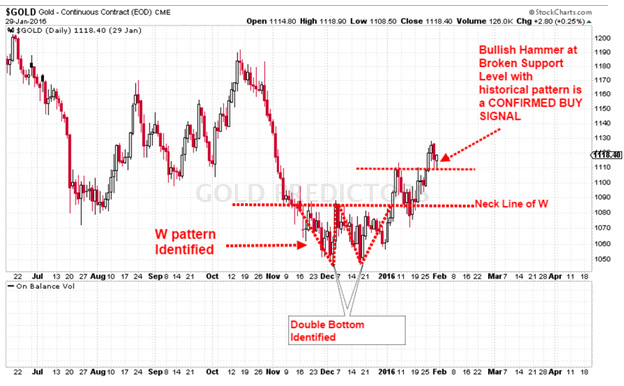
The hammer candlestick was created at the confirmed bull phase. As the historical price pattern of the Double bottom was confirmed. As a result, that is usually a strong Buy signal. However, the signal only validates if the price moves above the previous daily candle (hammer). In that case, it should generate a Pending Order (Buy Stop) above $1 of the previous daily candle. Markets usually make fake moves in both directions during such elastic environments to remove the stops. As a result, GoldPredictors.com does not trade at higher levels. Following the identification of the trade, we use technical analysis to predict the next day’s pullback and enter on a shorter timeframe, running the trade until it is healthy.
Gold Predictors delivers premium trading signals to our premium members. These signals cover short-term and medium-term trades and are distributed via email and WhatsApp. To become a premium member, please subscribe using the link below.