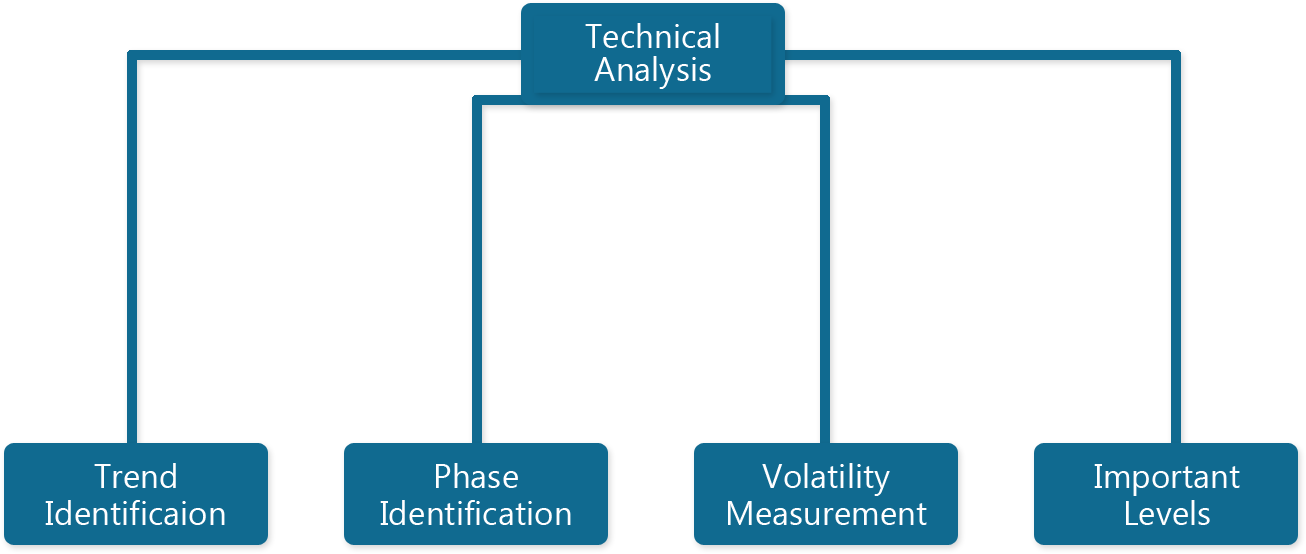
Technical analysis is the process of predicting the next move in a financial instrument based on price history and volume statistics. Different forecasting models based on price transformations are used in this method. Prices are forecasted using a variety of technical indicators, including supply and demand in the market. For technical analysis, there are hundreds of tools and millions of methods to choose from. While technical analysis is useful in predicting the future direction of commodity markets, it does not work on its own. There are numerous other factors to consider when evaluating commodity markets.
Trend Identification
Identifying the market trend is the first step in technical analysis. The market may be trending up, down, or sideways. Uptrend markets are those that are trending upwards. Downtrend markets are those that are trending to the downside. Markets that fluctuate in between certain ranges are known as sideways markets. Short-term trend, medium-term trend, and long-term trend are the three types of market trends. Based on historical data statistics, each market is assigned its own trend period. The short-term trend in gold is 17 to 29 days, the medium-term trend is 20-30 weeks, and the long-term trend is 84-120 months. The period of trend may be different which is calculated using gold cyclical analysis.

Phase Identification
The identification of the market phase is the next step in technical analysis. Market phase identification is a difficult task that is critical for assessing price movements. Market phases are different in bull and bear markets.
Bull Market
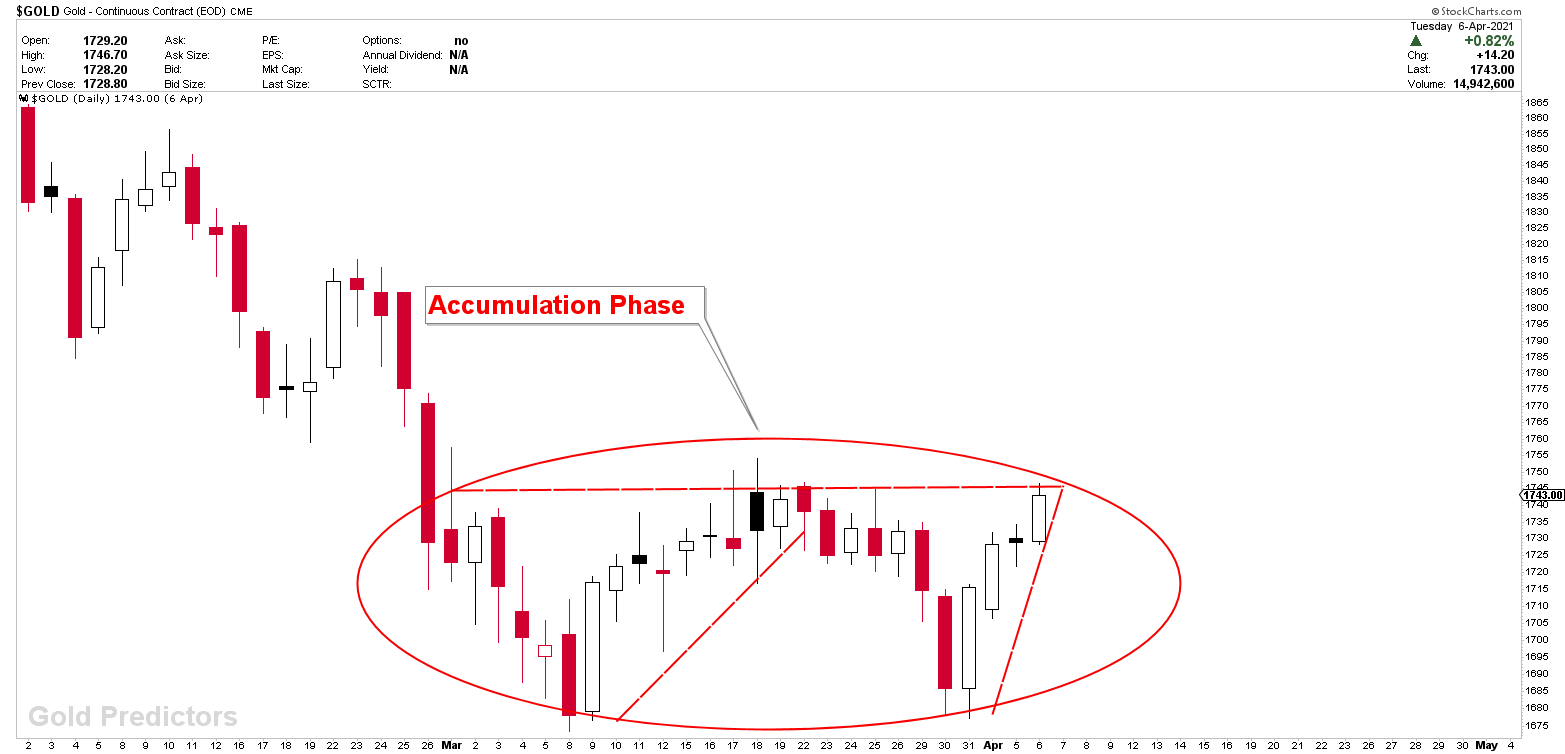
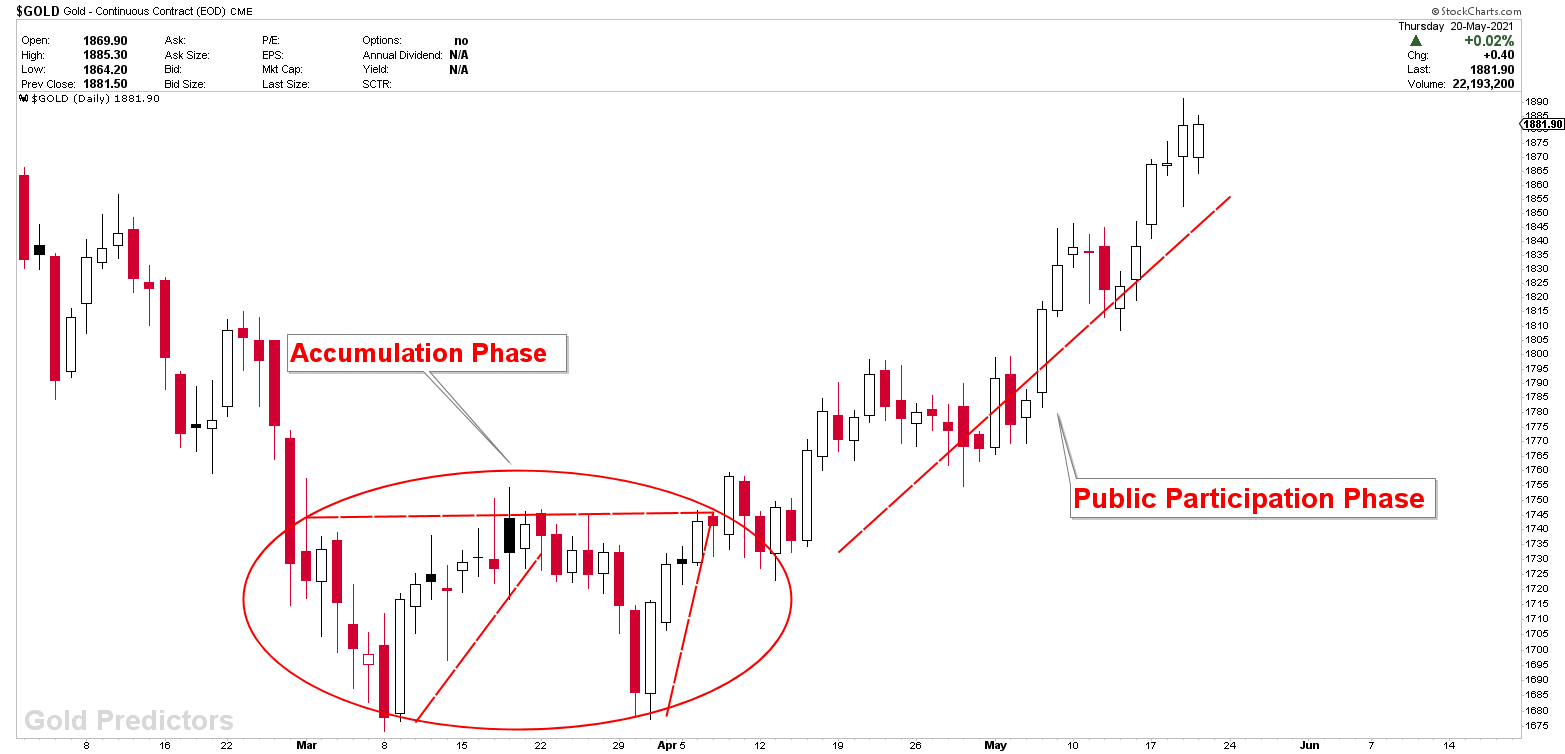
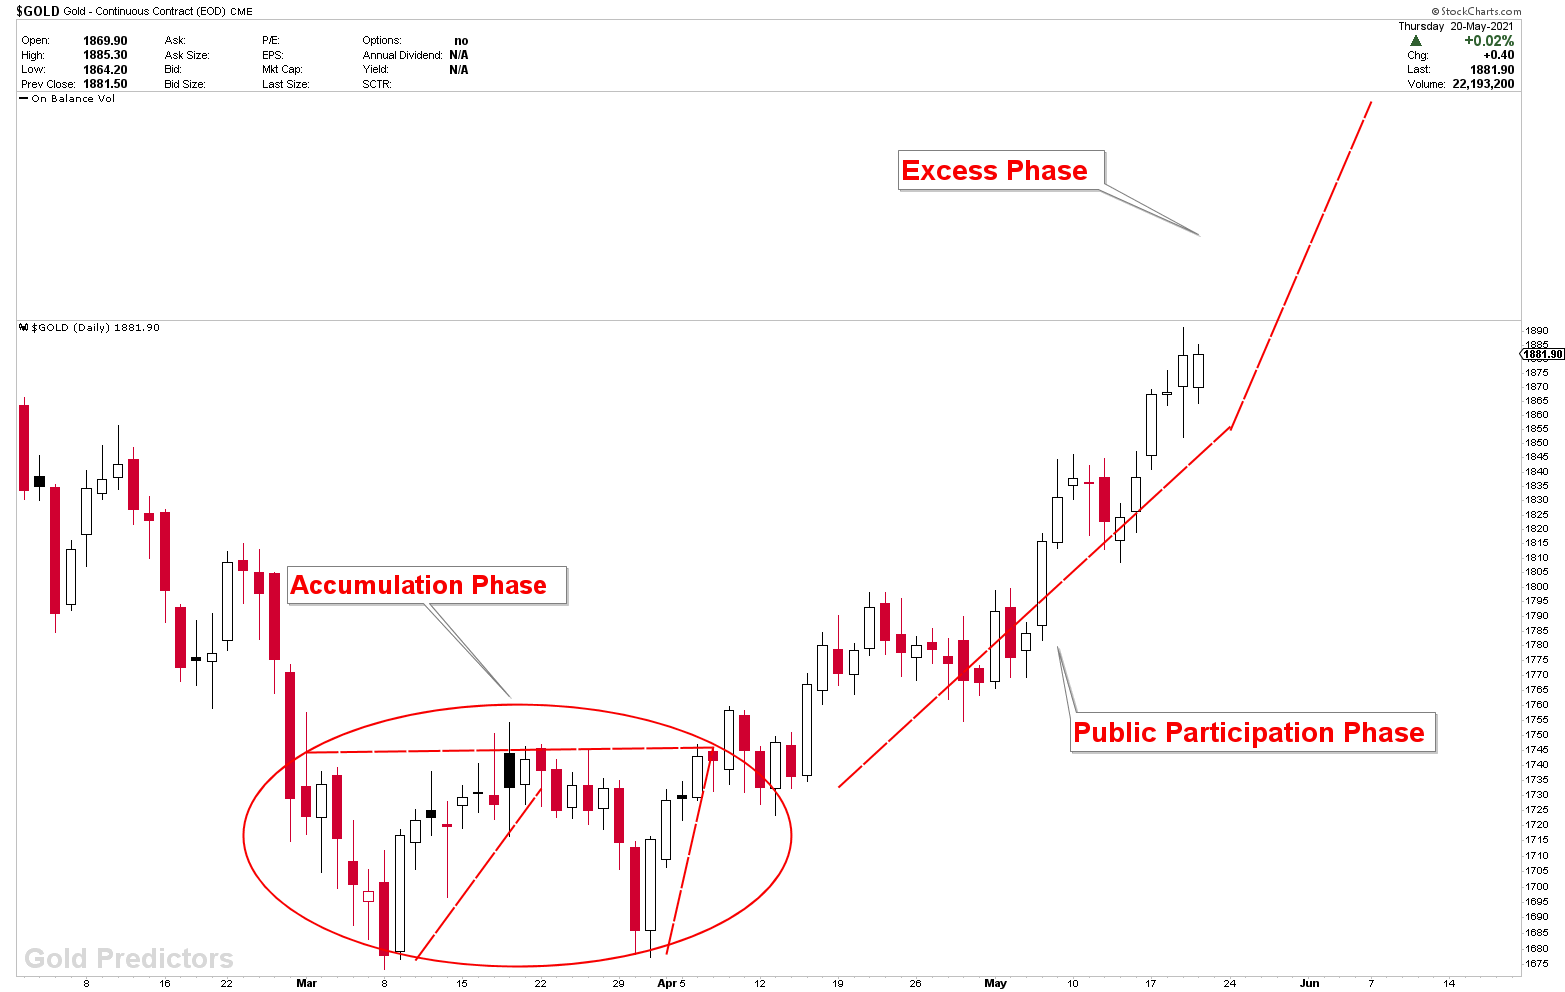
The Accumulation Phase
The accumulation phase is the start of the bull phase. Investors begin to add new trade entries to their portfolio during this phase. price is at its most appealing levels at this point, and the level marks the end of the downtrend. Those who invest during this stage take on the least risk. Because this is the end of the downtrend, a lot of fake moves can be dangerous. This phase is the most difficult to spot in a Bull Market. During this phase, the price will fluctuate between certain ranges as it transitions from a bearish to an upward trend. During this phase, the selling pressure begins to fade.

Public Participation Phase
Prices began to accelerate higher after investors entered the market during the accumulation phase, confirming the bottom. Following confirmation of the bottom, the price entered the phase of public participation. During the public participation phase, prices begin to rise as new investors and traders enter the market. Bearish sentiments begin to fade during this phase as business conditions improve, with earnings growth and strong economic data. When prices begin to rise, more investors enter the market, causing inflation to increase to new heights.

The Excess Phase
The market has already been established in the phase of public participation. Prices move with a lot of force during the excess phase, and the market becomes very hot for new investors and traders. This period is well-known among traders as a time when they can make a lot of money. This is the final stage of the bull market, when smart money begins to scale back its positions and sell them to those who are now entering the market. The phase is extremely dangerous because it coincides with the start of a new downtrend.

Bear Market
The Distribution Phase
The distribution phase is the first phase of a bear market. Buyers sell their positions to book profits at this time. The distribution phase is the opposite of the accumulation phase. In this phase, investors who purchased positions during the accumulation phase now sell them. Overall, market sentiment remains cheerful, with expectations of higher market levels. This phase is the beginning of a downtrend, but it is difficult to spot because it contains sideways movements.
Public Participation Phase
The phase of public participation is similar to that of the Bull Market. During this phase, more investors and traders begin to sell their positions, causing prices to plummet. Trend followers enter the market once technical top is confirmed. Business conditions deteriorate and sentiments become increasingly cynical during the phase of public participation. During this stage, sales increase while purchases decrease.
The Panic Phase
The panic phase of a bear market is usually accompanied by a massive selloff. The massive selloff usually signals the beginning of a new investor’s wealth accumulation. Because panicked markets are difficult to spot, this stage is difficult to recognize. The action moves at a breakneck speed. The phase offers much lower prices, making it an appealing place for investors to start long positions.
Important Levels
The identification of critical levels in markets is one of the most crucial components of technical analysis. Those critical levels act as pivots for price projections in the future. These levels are called Supports and Resistance. A support level is a level where the price tends to find support. That means, the price is more likely to bounce off rather than break through it.
However, once the price has breached this level, it continue falling until it reaches another level of support. The polar opposite of a support level is a resistance level. When the price rises, this is where it usually meets resistance. This indicates that the price is more likely to bounce off rather than break through this level.
Measured Moves, Swing Ratio Projection (Static or Dynamic), Calculated Pivots, Volatility Based are famous techniques to identify the levels. Trend lines and Moving averages are also useful. However VWAP, and Market Profile are useful sometimes. Price action and volume behavior are also used sometimes to identify support and resistance.
Psychological Support and Resistance levels are also important for traders. Because when price reaches a value ending at 50 or 00, humans often perceive these levels as having a high risk of disrupting the current trend. It’s possible that the price will hit the line and reverse, that it will hover around the level as the Bulls and Bears battle for dominance, or that it will punch straight through. When approaching 00 levels in general, and 50 levels if it has previously acted as Support or Resistance, a trader should always proceed with caution.
Volatility Measurement
Any asset’s current volatility is the asset’s instability based on historical prices for the most recent price observation.
An asset’s volatility is measured for the following reasons.
- The big moves in any asset’s prices caries the emotions of particular trader or investor.
- The price volatility is used to calculated the size of any trade in any trading portfolio.
- The volatility of any asset measures the risk.
- The measure of volatility is used to predict the future direction of price of any asset
- The volatility of any assets, effect the technical analysis and cycles timing. Extremely volatility may cause cycles to invert.
Before entering the financial markets, you must first determine the level of volatility. Volatility fluctuations can push cycle timings and price points to their limits, posing a significant risk to investments. Extreme volatility can cause cycles to invert, but it’s not always easy to tell whether they’re in action or inversion mode, especially over short time periods.


