Gold Outperforms Tech: Structural Breakout Aligns with Capital Rotation
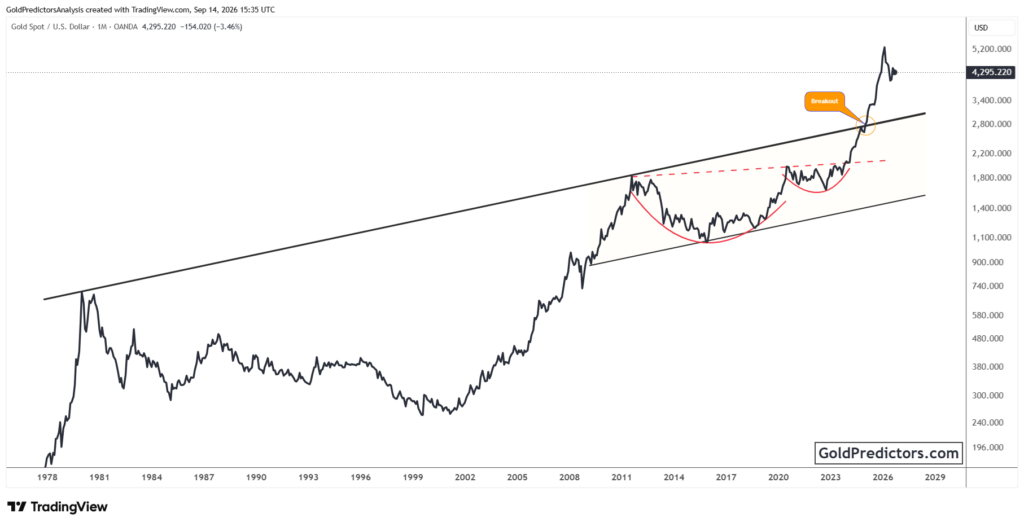
Gold (XAUUSD) has entered a new phase of its long-term bull market, gaining strength from both technical momentum and a shifting macroeconomic landscape. The metal has surged above major resistance zones, validating bullish structures that have been in place for decades. At the same time, the ratio of tech stocks to gold is breaking down from a long-term triangle, signaling a possible reversal in sector leadership. This alignment of macro and technical signals marks a pivotal shift in favor of gold.
Gold Builds Double Cup Formation, Breaks into Steeper Channel toward $4,200
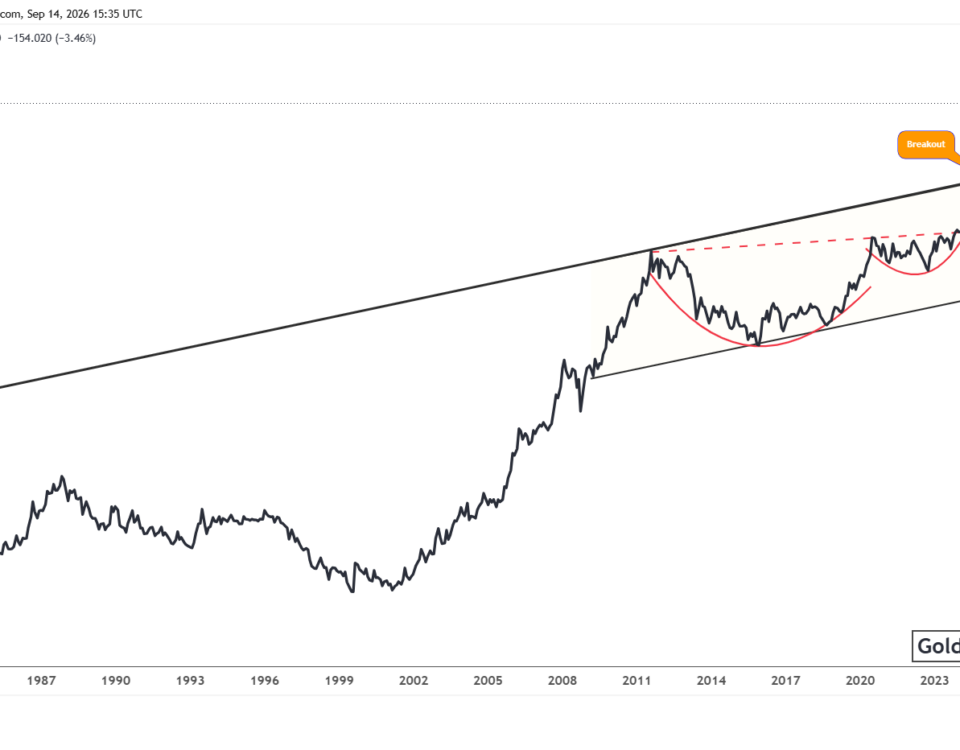
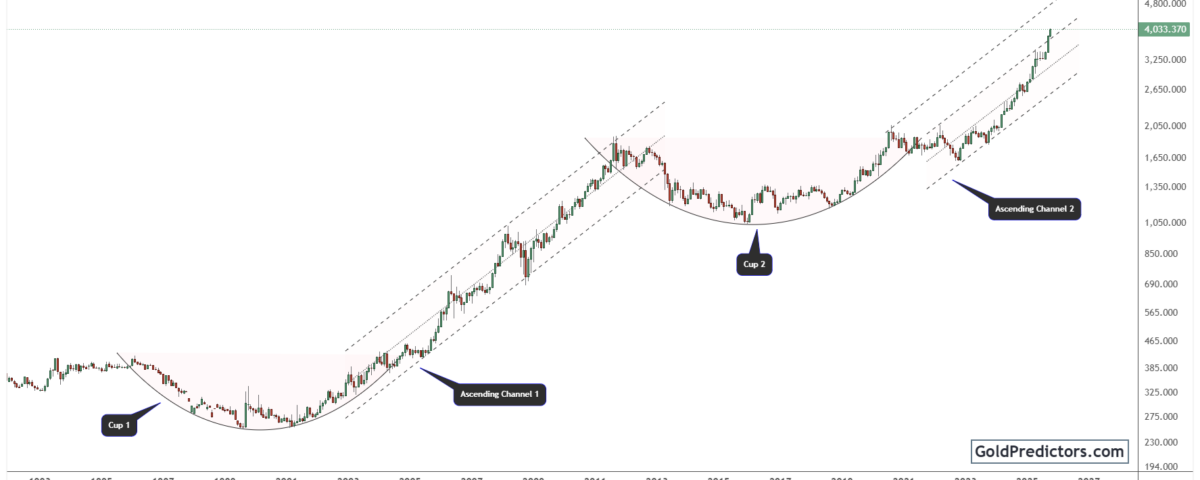
The gold chart below shows well-defined cup and channel formations, illustrating a powerful long-term pattern that has unfolded over several decades. A key early formation, called “cup 1,” developed between 1996 and 2004 as a broad, rounded base. This consolidation phase set the stage for a sustained breakout into ascending channel 1, driving gold to record highs.

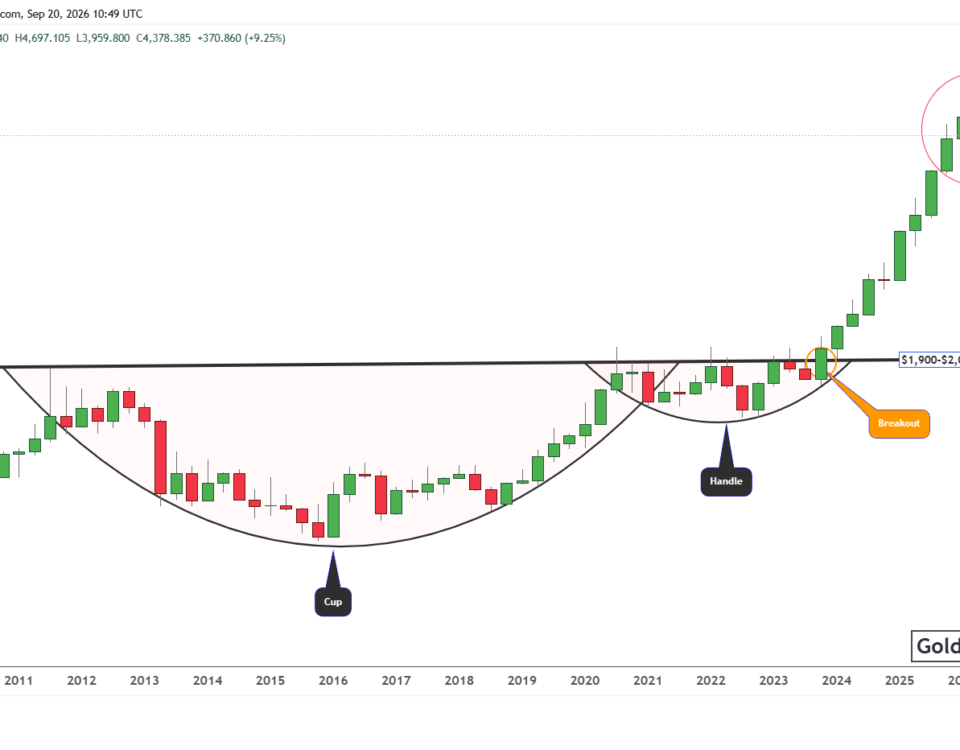
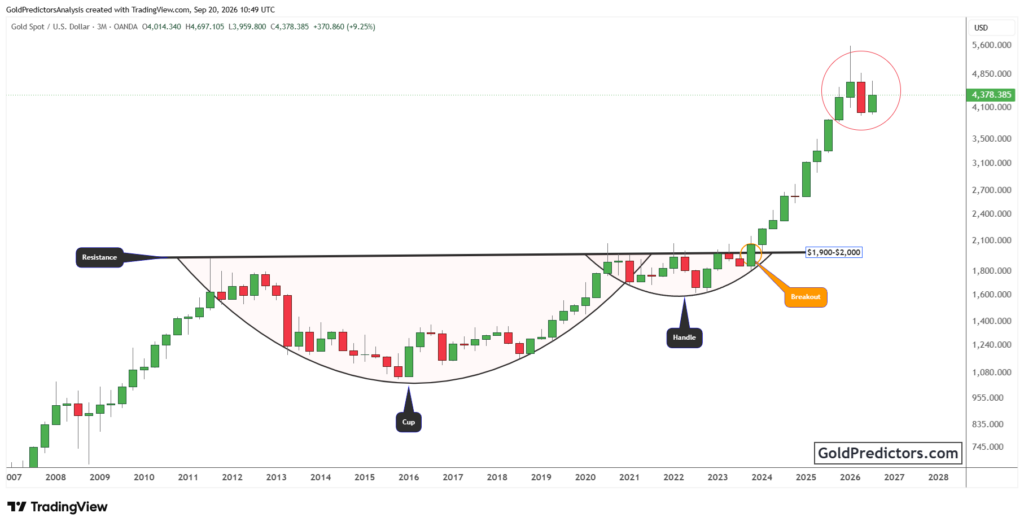
After reaching its peak in 2011, gold entered an extended consolidation phase that lasted nearly a decade. This period formed cup 2, a deeper and more extended base that extended from 2012 to 2020. Once gold broke out of the second cup formation, it entered a consolidation phase before gradually climbing above the $2,000 level and moving into ascending channel 2. This new channel represents a steeper, more aggressive trend compared to the previous cycle.
Furthermore, the ongoing channel formation suggests the uptrend remains intact, with scope for additional upside. Importantly, each breakout was preceded by long phases of compression and base building, which adds strength and validity to the move. The repeating cup-and-channel structure points to a broader structural revaluation of gold. At the same time, global macro shifts such as loose monetary policy, weakening fiat currencies, and geopolitical tensions are fueling safe-haven demand. These forces continue to strengthen the bullish technical outlook for gold.
Gold Outperforms Tech as Decade-Long Ratio Breaks Downward
The gold chart below shows a divergent trend in the tech stocks-to-gold ratio, with tech stocks weakening relative to gold. After forming a large triangle over the past decade, the ratio has broken down sharply from the lower support trendline. The pattern suggests that gold is beginning to outperform technology stocks. This marks a reversal from the tech sector’s dominance that began in the early 2010s.
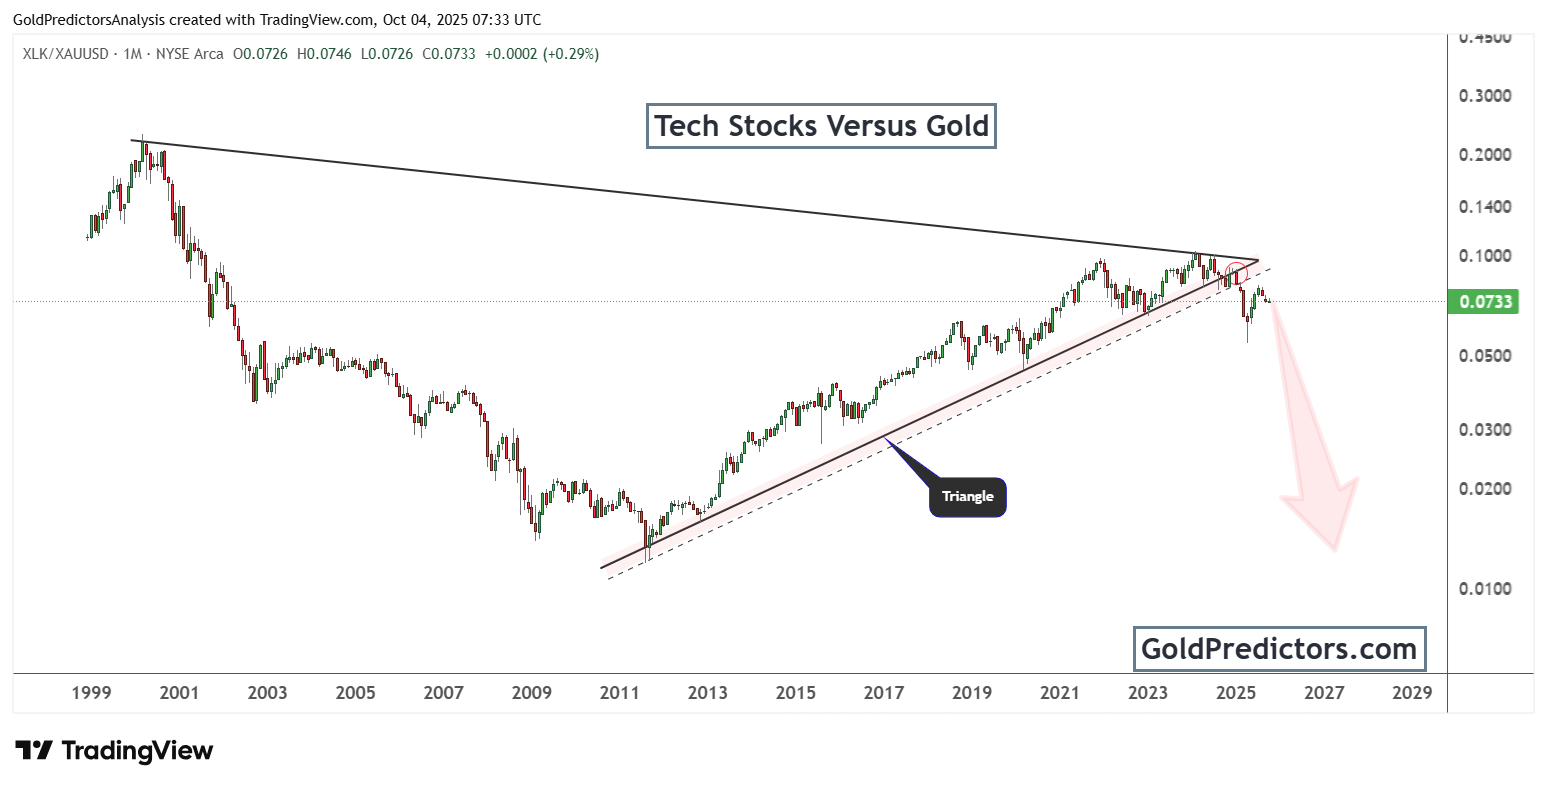
Notably, from 2011 to 2022, tech stocks delivered stronger performance than gold, supported by low rates, high liquidity, and a strong growth narrative. However, the failure of the triangle breakout and the resulting decline now indicate a broader change in market preferences. As economic and political risks increase, gold continues to attract capital as a preferred hard asset.
Consequently, the steep downward arrow on the chart highlights the weakening outlook for tech-to-gold performance. If the ratio continues to fall, it may indicate a turning point favoring real assets rather than speculative growth sectors. This shift also supports the idea of capital flowing into precious metals as a store of value.
Conclusion: Technical Breakouts and Capital Rotation Strengthen Gold’s Bullish Outlook
Gold has firmly entered a new and aggressive phase of its long-term bull market. Decades of technical formations have now resolved in favor of a steep upward trend. The double cup-and-channel structure, supported by clean breakouts and higher lows, confirms strong structural support for further upside.
Meanwhile, the breakdown in the tech stocks-to-gold ratio adds further weight to this shift. For over a decade, tech stocks led the market, but that trend is now reversing. The breakdown of the ratio’s triangle pattern points to capital shifting away from growth equities and into hard assets such as gold. This change reflects growing concern over inflation, monetary instability, and geopolitical stress.
Overall, the alignment of long-term technical strength and powerful macro forces marks a critical inflection point for gold. With capital rotating out of overvalued sectors and into tangible assets, gold stands out as both a defensive hedge and a structurally favored investment. These developments make gold not only a defensive asset but also a key driver of long-term portfolio gains.
Gold Predictors Premium Membership
Get exclusive short-term and swing trade ideas with precise entry levels, stop-loss, and target prices, including justification and analysis — all delivered directly via WhatsApp.
Our premium service includes deep technical analysis on gold and silver markets. We cover cycle analysis, price forecasting, and key timing levels.
Members also receive a weekly market letter with detailed analysis, commentary from our Chief Analyst, including actionable insights, trade timing, and direction forecasts for gold and silver.
Stay ahead of the market — join our premium community today.