Silver Price Forecast: Can the Cup-and-Handle Breakout Hold?
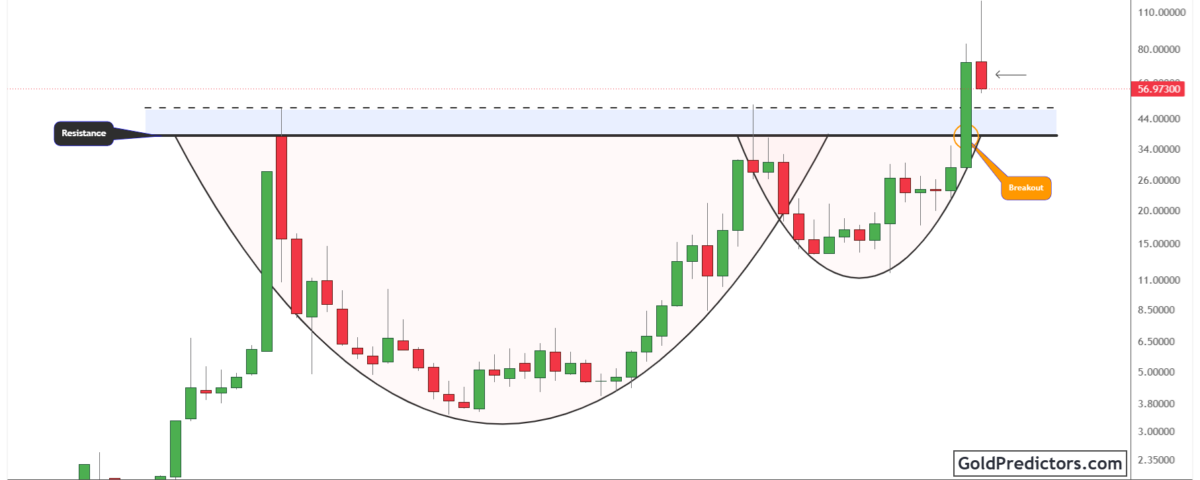
Silver (XAG/USD) remains near $57 after a sharp correction from its annual high. The price still holds above the former resistance zone of its multi-decade cup-and-handle pattern. This keeps the long-term breakout intact with support near $55 in focus. Meanwhile, the US Dollar Index-to-silver ratio has turned higher from long-term support. The next phase depends on silver’s ability to stabilize and whether the dollar maintains its relative strength.
Silver Market Outlook: Hot CPI and PPI Keep Fed Rate Hikes in Focus
Silver faces pressure from rising inflation and the risk of slower economic growth. Rising fuel costs can lift inflation while reducing spending elsewhere, creating a difficult backdrop for industrial demand. The CPI report released on Wednesday, October 14, showed that the consumer prices rose 0.6% in September and 3.7% from a year earlier. The annual inflation increased from 3.4% in August. Core CPI, which excludes food and energy, rose 0.3% monthly and 2.6% annually. Gasoline prices increased 9.1% and accounted for more than half of the monthly headline rise. These figures strengthen the case for keeping monetary policy restrictive. For silver, that creates a risk that higher interest rates will limit investment demand.
The PPI report released on Thursday added to those concerns. Producer prices rose 1.3% in September and 6.3% from a year earlier. The monthly increase was the largest since March 2022. Prices excluding food, energy and trade services rose 0.5%, showing that the cost pressures extended beyond fuel. However, stronger inflation did not push bond yields consistently higher. Demand for government bonds later drove yields lower and helped support silver near $57. This creates competing forces. Lower yields can support silver because it pays no income. However, persistent inflation raises the risk of further Fed tightening, while weaker growth could reduce industrial demand.
Silver Technical Analysis: Long-Term Breakout Holds Above $48–$50
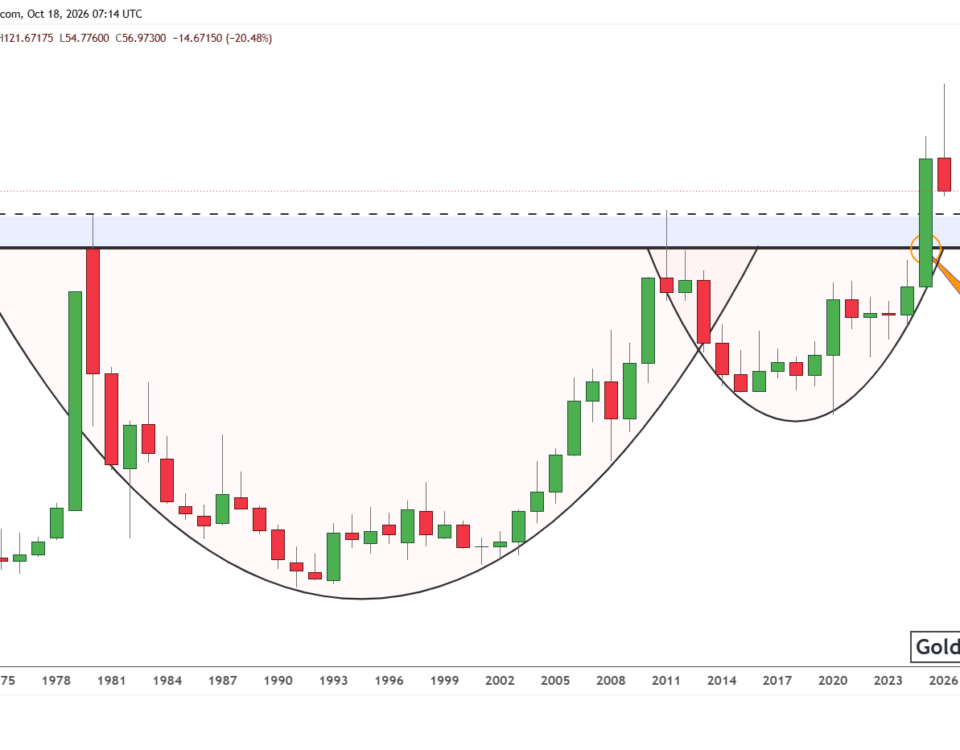
The silver chart below shows a large cup-and-handle pattern. The main resistance sits near $38–$40 with another resistance area around $48–$50. Silver remains above both areas despite the sharp decline. This keeps the long-term breakout intact. Both areas could provide support if prices fall further.
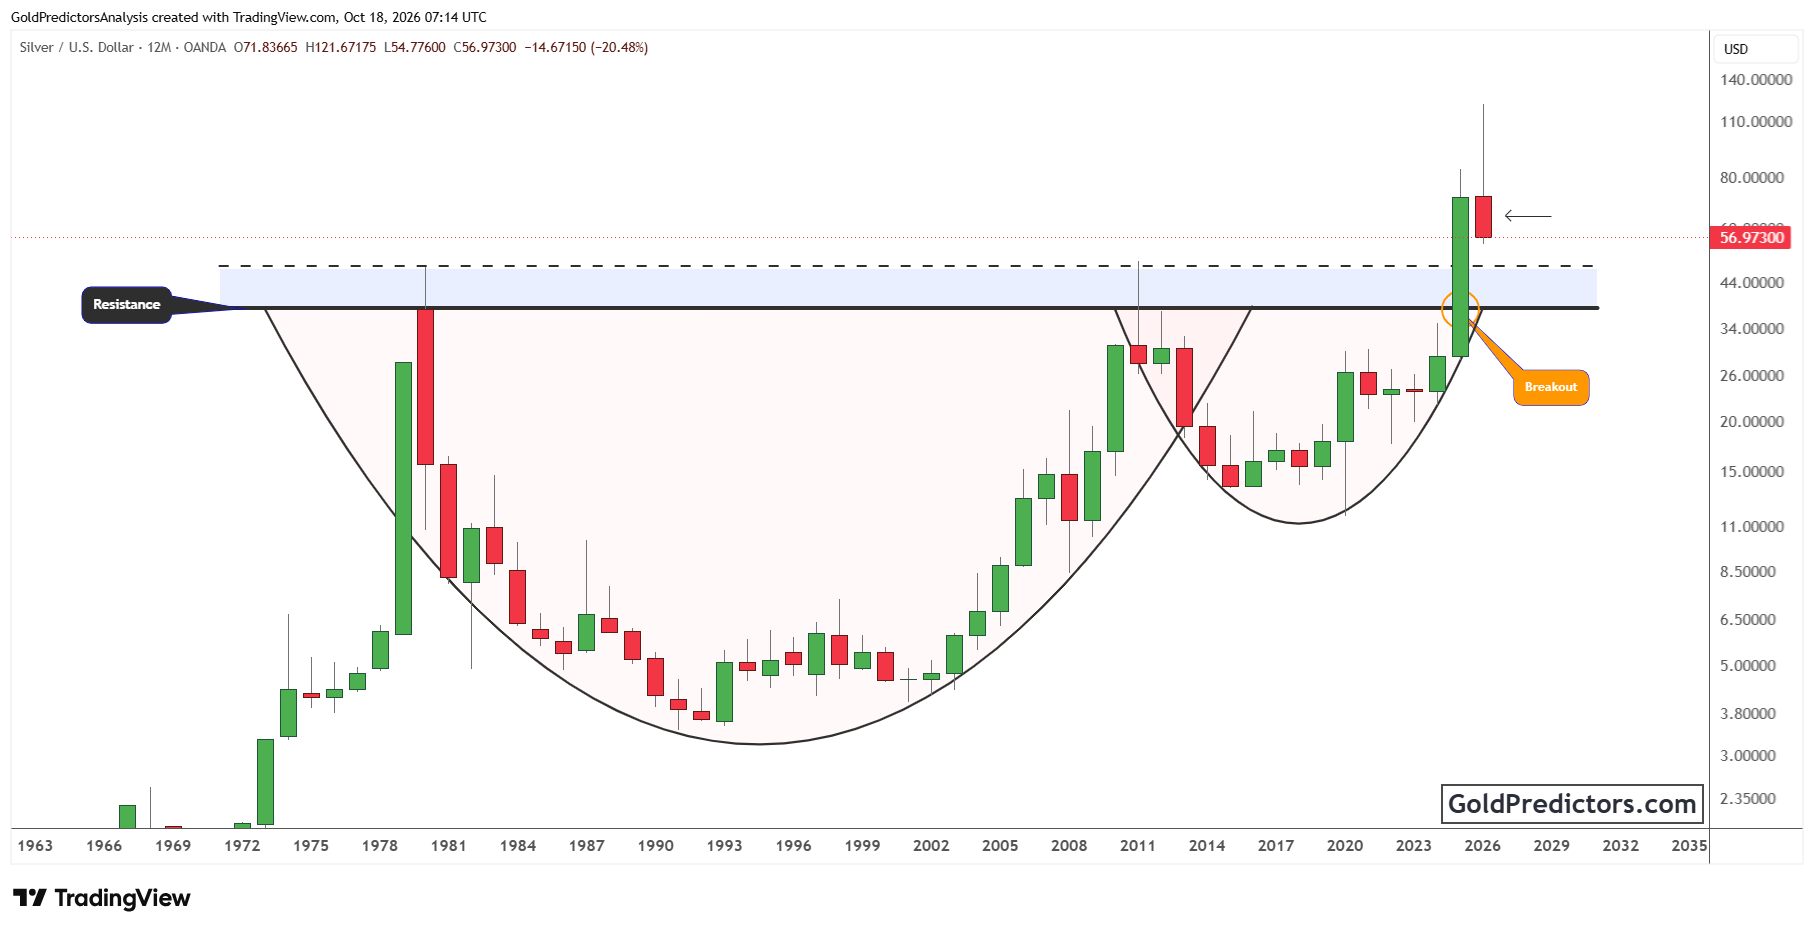
The chart shows silver at $56.97 after reaching an annual high of $121.67 and a low of $54.77. This makes support near $55 important. Holding above the annual low would give silver a chance to build a base above its old resistance. The annual candle is still forming and its long upper wick shows the sharp fall from the peak.
A sustained move above $60 would be an early sign that silver is stabilizing. The annual opening price near $72 would remain another level to watch. A fall below $54.77 would increase the risk of a decline toward $48–$50. This would test support at the upper end of the old breakout area. A deeper decline could shift attention to $38–$40.
Dollar-to-Silver Ratio Turns Higher From Long-Term Support
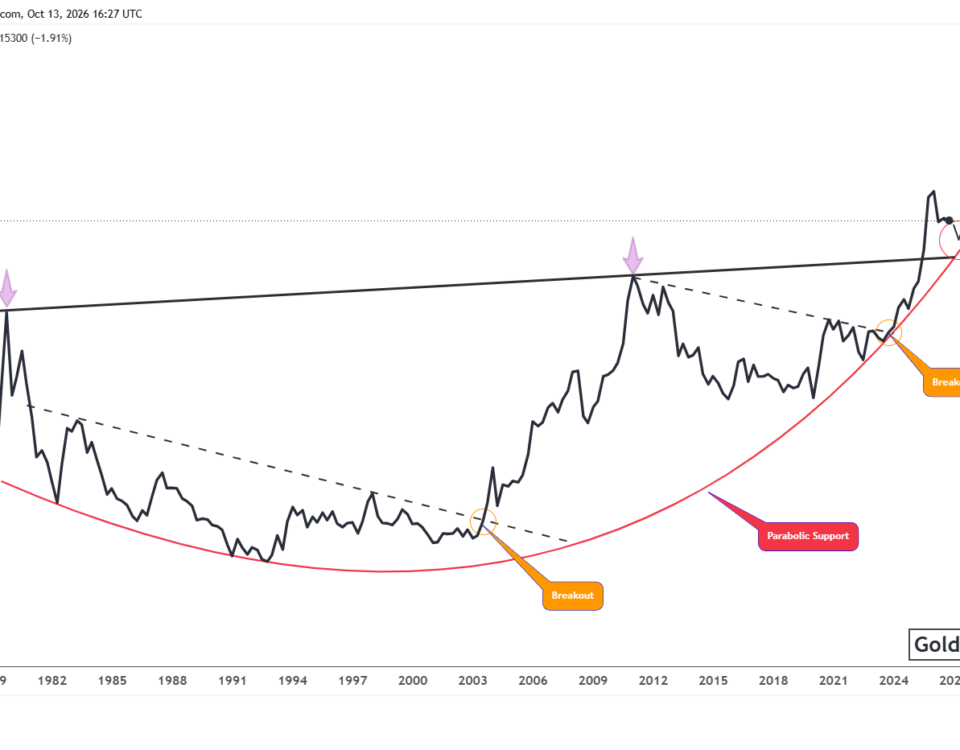
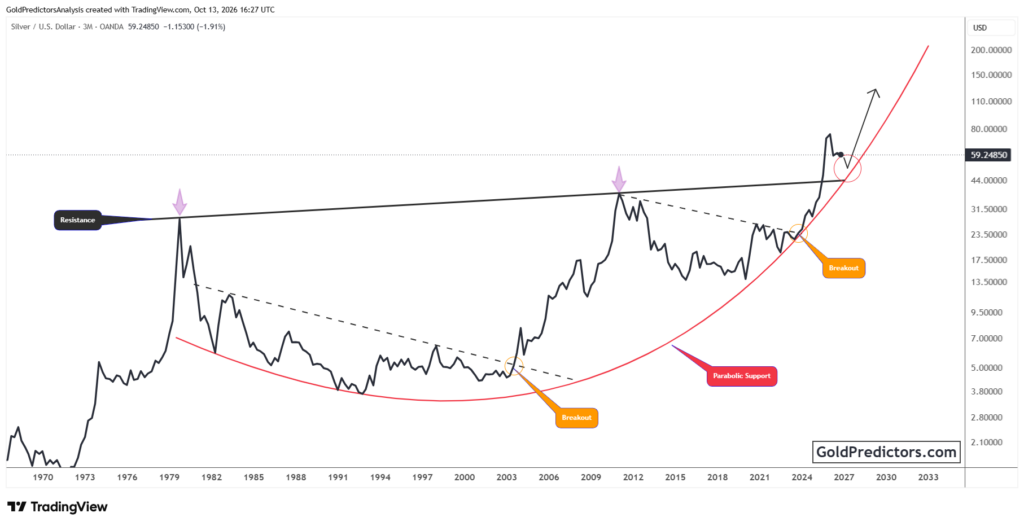
The monthly DXY/XAGUSD ratio has risen to approximately 1.786 after turning higher from its long-term descending support line. The marked historical reversals show that this boundary has coincided with major turning points in the relationship between the dollar index and silver. The latest rise suggests that silver’s relative strength has weakened.
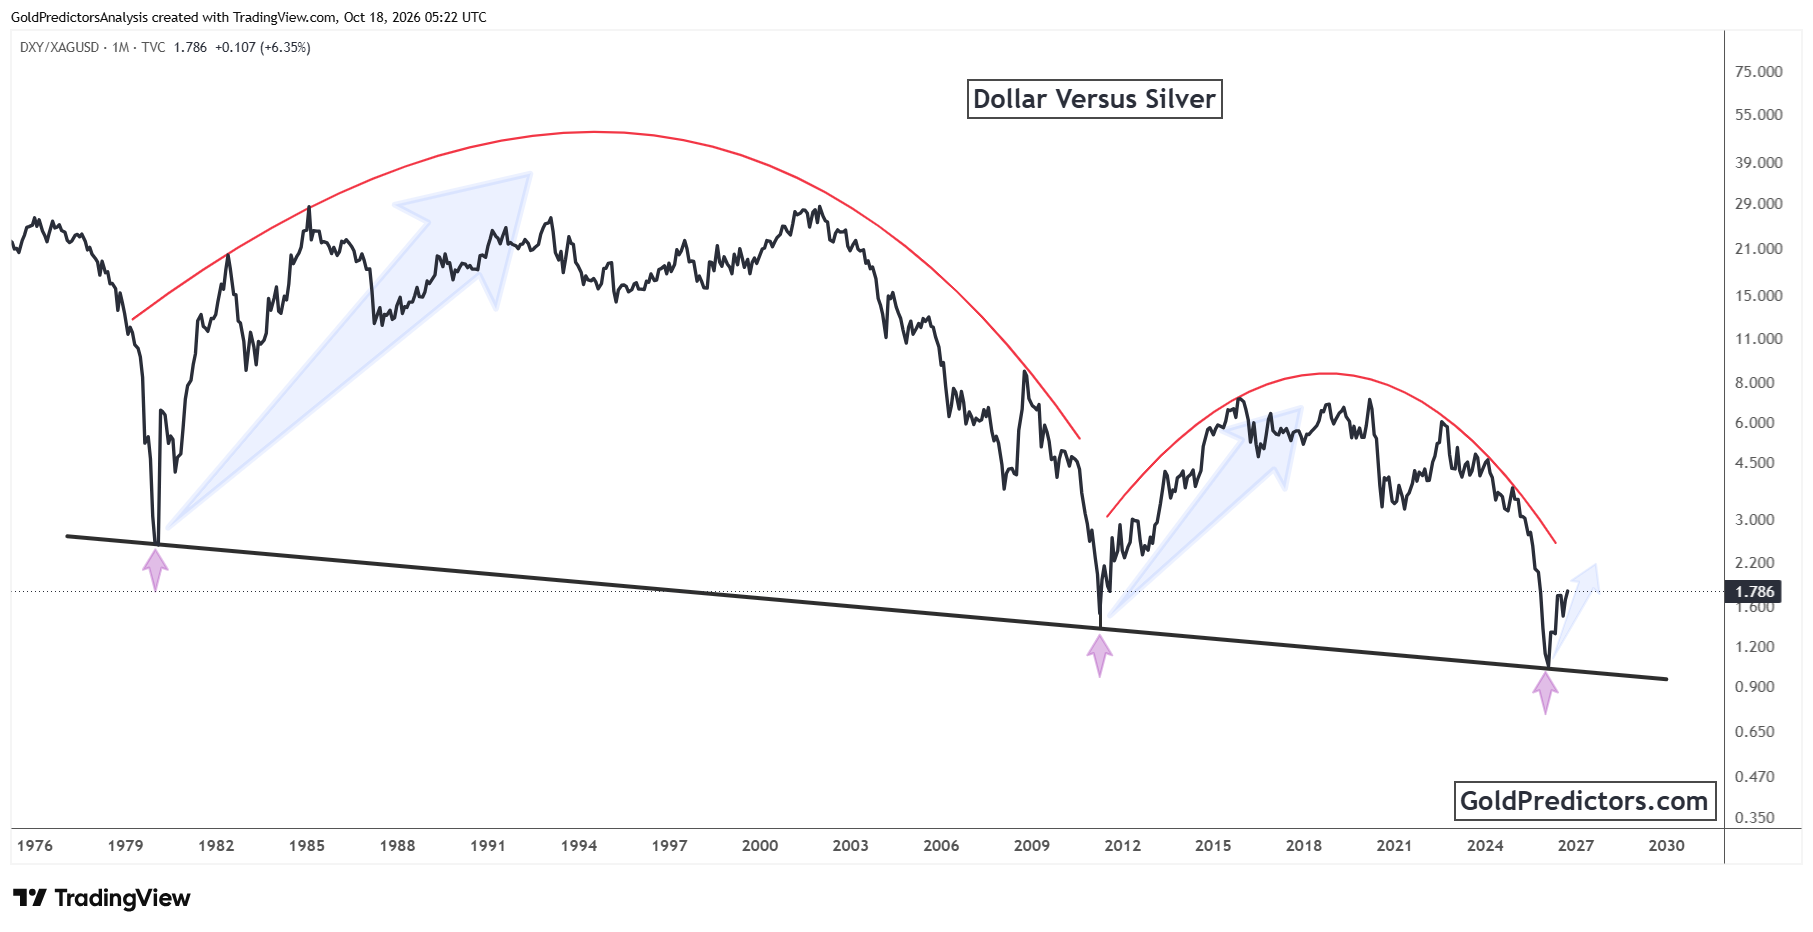
This ratio divides the US Dollar Index by silver’s dollar price. It can rise when the dollar strengthens, when silver falls, or when silver declines faster than the dollar index. A rising ratio therefore does not require an outright increase in the dollar. It shows that silver is losing strength compared with the dollar index.
The upward arrow highlights a possible continuation of the recent reversal. A further rise in the ratio would suggest continued weakness in silver compared with the dollar index. A renewed decline would indicate that silver is improving against the dollar index. The historical pattern provides useful context but does not show when the next price move will happen or how large it will be.
Silver Price Outlook: A Loss of $55 Support Would Raise Correction Risks
Silver’s price forecast remains balanced between an intact long-term breakout and difficult inflation conditions. If the price holds above the annual low near $54.77, this would support consolidation above the historical resistance band. However, stronger CPI and PPI readings keep further Fed tightening in focus, while the rising dollar-to-silver ratio adds another source of pressure. Firmer silver prices alongside a declining ratio would strengthen the case for stabilization. Sustained weakness below the annual low would increase the risk of a deeper test of the breakout region.
Gold Predictors Premium Membership
Get exclusive short-term and swing trade ideas with precise entry levels, stop-loss, and target prices, including justification and analysis — all delivered directly via WhatsApp.
Our premium service includes deep technical analysis on gold and silver markets. We cover cycle analysis, price forecasting, and key timing levels.
Members also receive a weekly market letter with detailed analysis, commentary from our Chief Analyst, including actionable insights, trade timing, and direction forecasts for gold and silver.
Stay ahead of the market — join our premium community today.