

Gold Price Forecast: XAU/USD Recovers above $3,900 Ahead of US CPI
Gold (XAU/USD) climbed back above $3,900 after a weak October. The recovery faces its first test near $4,150 as markets await the US Consumer Price Index (CPI). The report could move Treasury yields and the dollar, while tensions near the Strait of Hormuz could lift demand for gold. Meanwhile, the gold to silver ratio faces its own test near 80, where a break higher would show gold gaining further ground against silver.
Gold Market Outlook: US Inflation Could Shift Fed Rate Expectations
Gulf stocks fell early on Sunday after reports of explosions in southern Iran, including on Qeshm Island in the Strait of Hormuz. The Saudi benchmark fell 1%. A greater threat to oil shipments through the strait could lift demand for gold as a safe haven. If oil prices also rise, higher inflation expectations could push Treasury yields up and limit gains in gold.
The US Bureau of Labor Statistics will release the October Consumer Price Index (CPI) on Tuesday, 10 November. If inflation exceeds forecasts, expectations for another Federal Reserve rate increase could lift Treasury yields and the US dollar. Higher yields can weigh on gold because it pays no interest. A softer reading could give gold room to recover if yields and the dollar fall.
Gold Technical Analysis: A Move above $4,150 Could Extend the Recovery
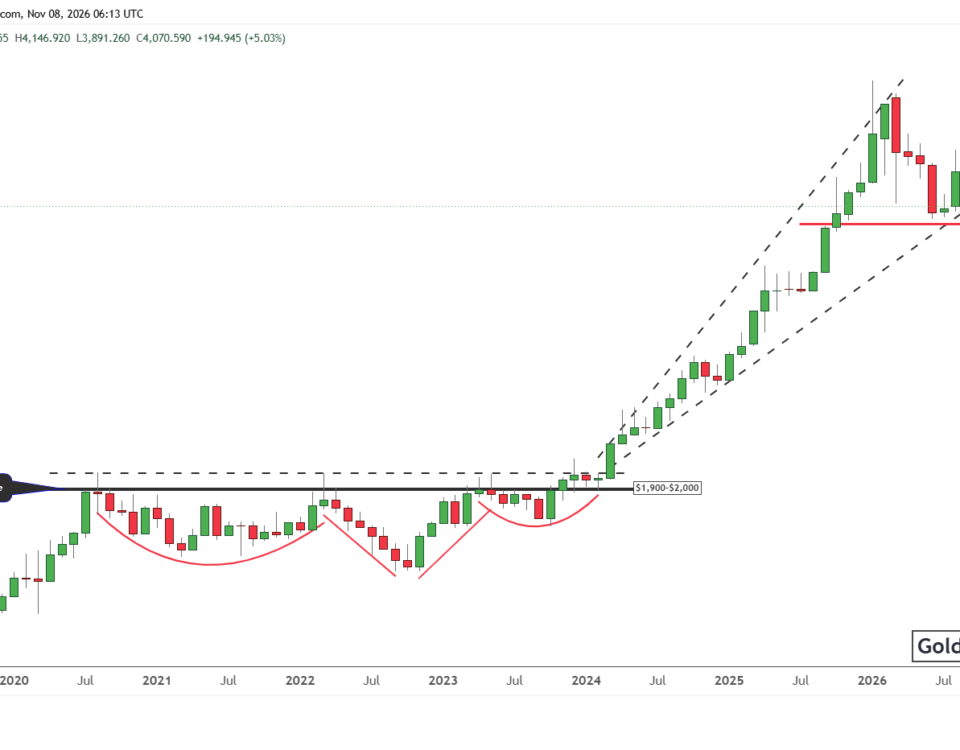
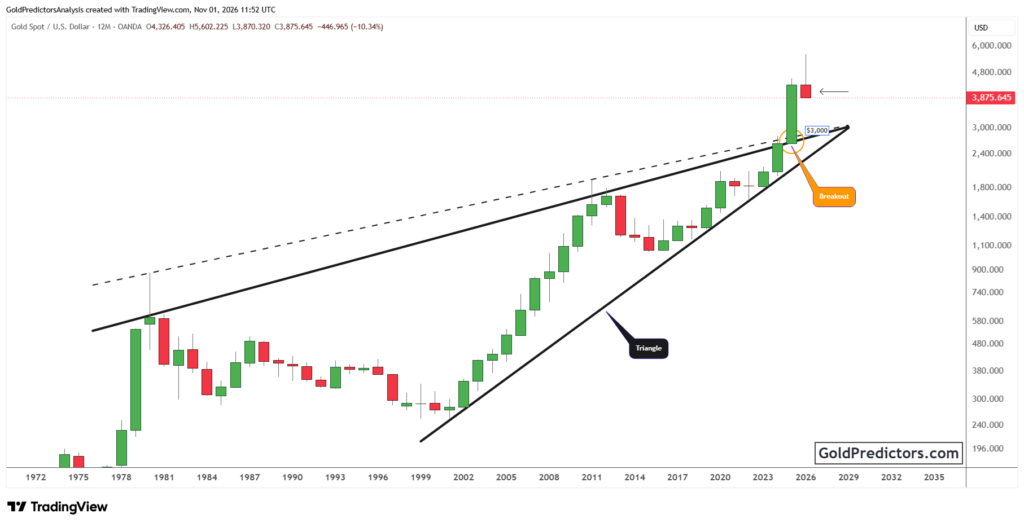
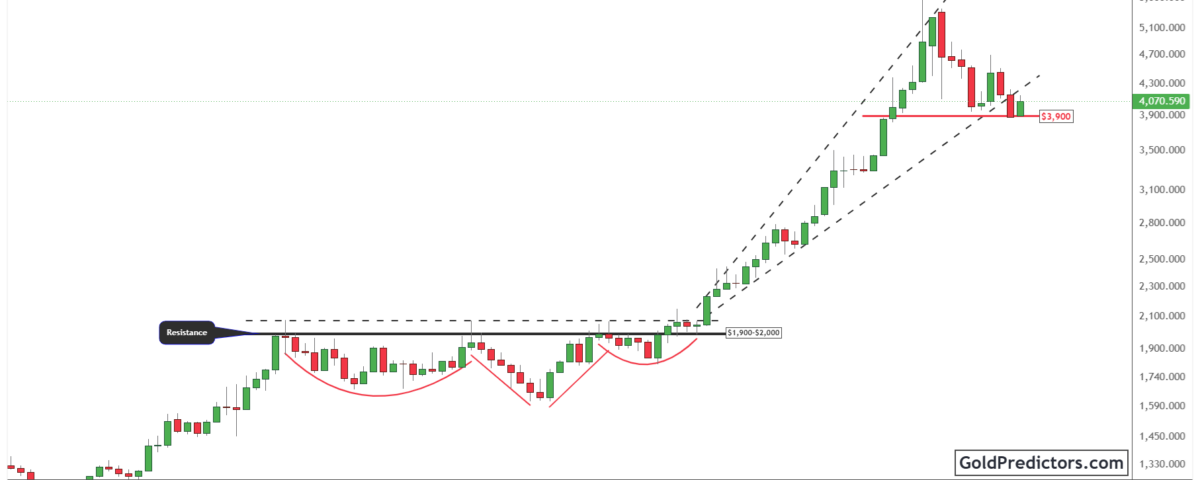
Gold broke above a multiyear resistance area between $1,900 and $2,000 before advancing inside a widening wedge. Gold reached a peak above $5,500. The correction took the price below the lower boundary of that wedge. Gold remains well above the original breakout area, while the broken wedge boundary could now act as resistance.
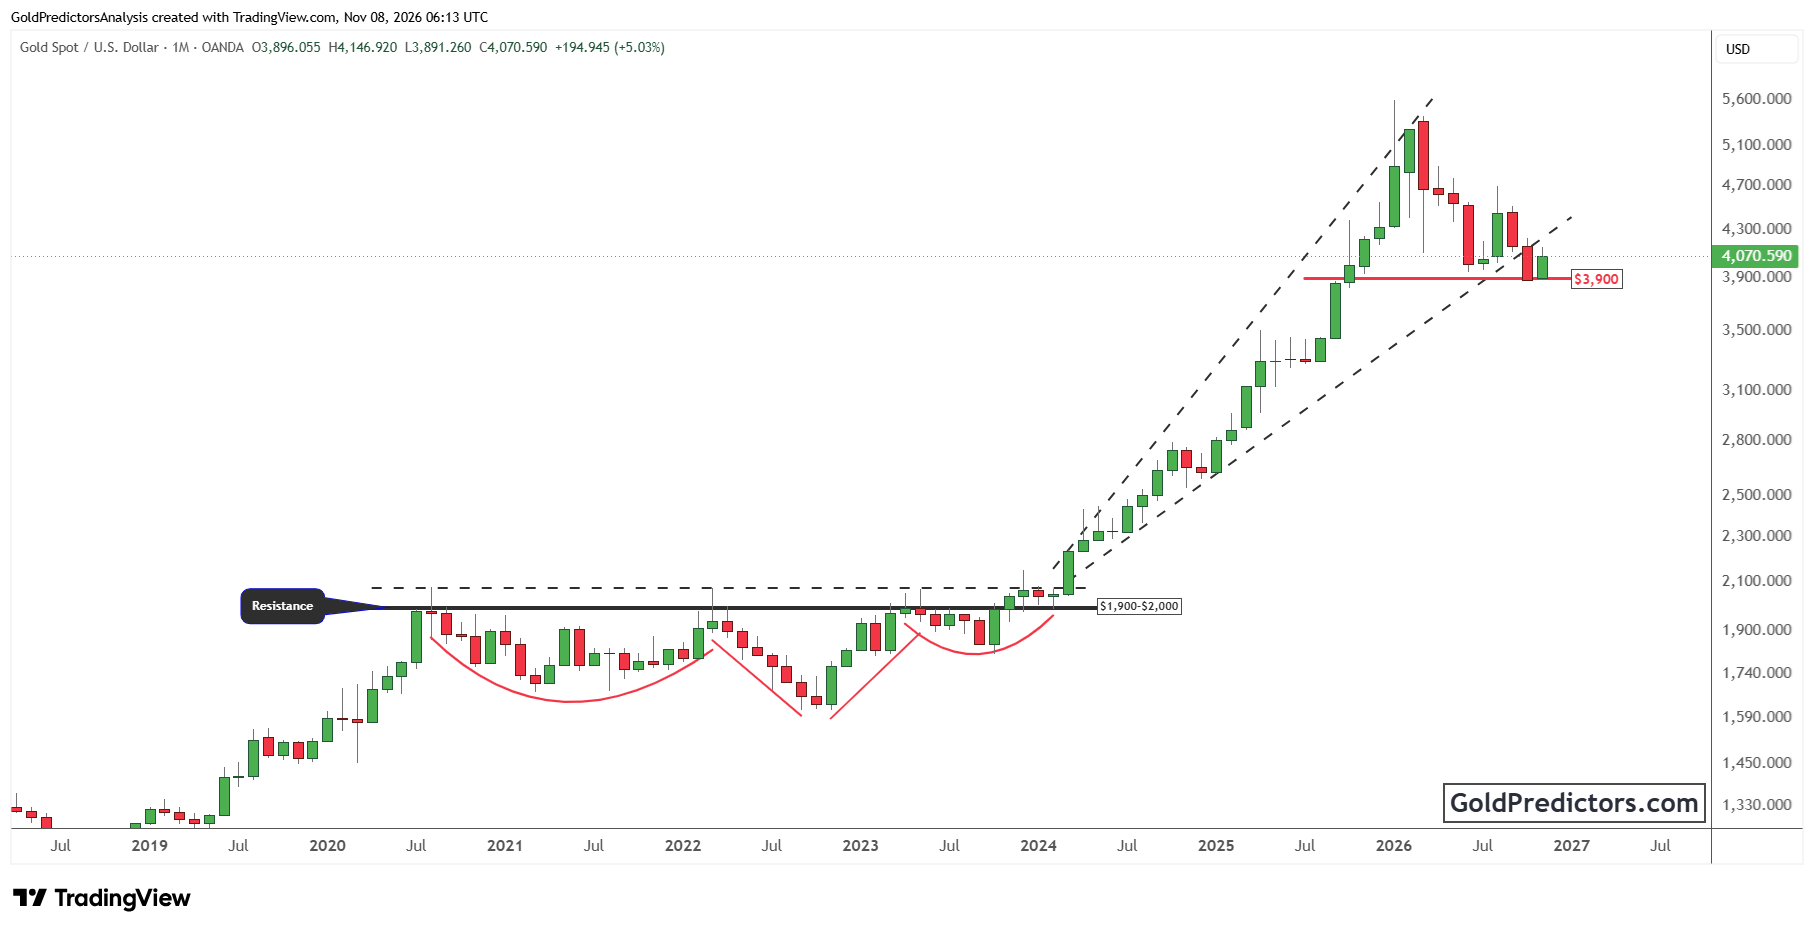
Gold is up about 5% from the October close. The November high of $4,146.92 marks the first resistance near $4,150. If gold clears that level, the next test would be the rising wedge boundary between $4,200 and $4,250. A sustained move above that range would be a stronger sign that the correction is easing.
On the downside, $3,900 is the first support area. Gold regained it after closing October near $3,876. The November low of $3,891.26 marks the lower edge of that support area. If the price ends November below $3,900, it would weaken the case that the recovery has established support there.
Gold to Silver Ratio: A Monthly Close above 80 Would Restore the Channel
The monthly gold to silver ratio spent years within a rising channel. It fell from above 100 in 2025 and broke below the channel floor late in the year. The decline also pushed the ratio below horizontal support that had held several times since 2023. Gold outperforms silver when the ratio rises, while silver leads when it falls.
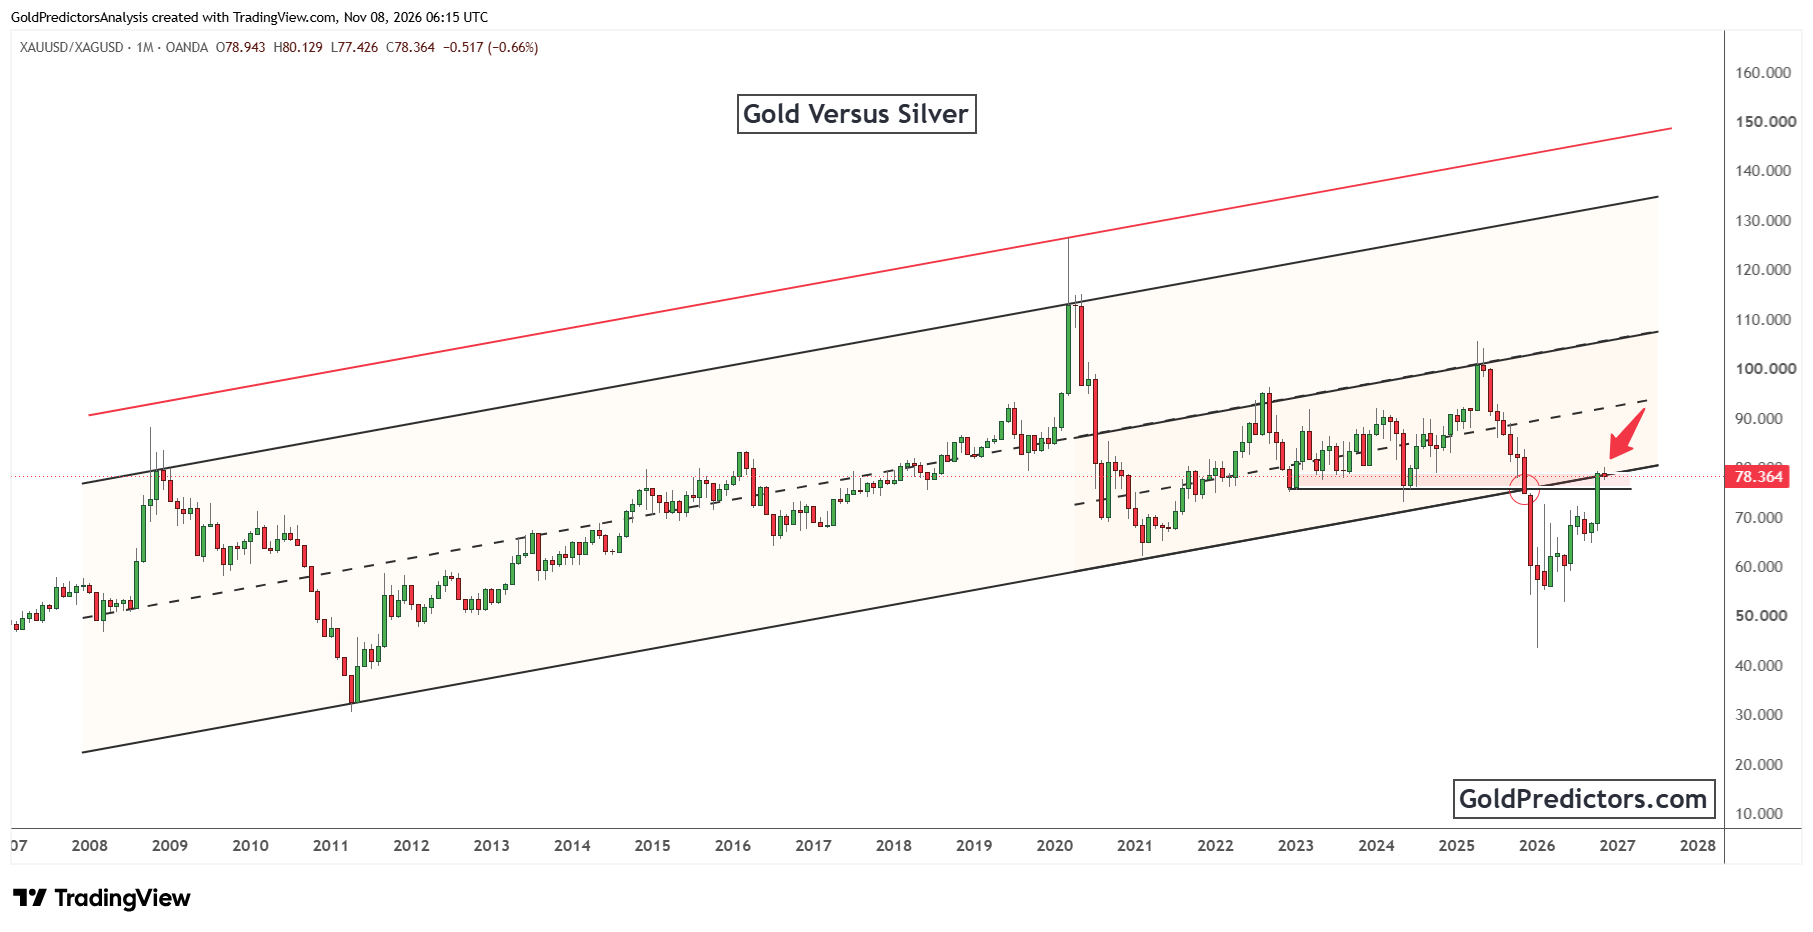
The ratio dropped below 74 in December 2025 and fell further in early 2026 before recovering. The recovery picked up in October as the ratio climbed from about 69 to nearly 79. It reached 80 in November before easing to around 78.3. The ratio is now testing the former channel floor as resistance.
The area between 78 and 80 now acts as resistance. A monthly close above 80 would bring the ratio back inside the channel and put the dashed trendline near 92 in focus. If the ratio turns lower, the nearest support sits around 76. A monthly close below that level would point to renewed strength in silver relative to gold.
Gold Price Outlook: What Could Extend or Stall the November Recovery?
Gold could extend its recovery if softer US inflation brings Treasury yields and the dollar lower. A move above $4,150 would put the $4,200 to $4,250 area in focus. If yields rise, gold could test $3,900 again. A monthly close below that level would weaken the recovery. If the gold to silver ratio ends the month above 80, it would show gold gaining further ground against silver.
Gold Predictors Premium Membership
Get exclusive short-term and swing trade ideas with precise entry levels, stop-loss, and target prices, including justification and analysis — all delivered directly via WhatsApp.
Our premium service includes deep technical analysis on gold and silver markets. We cover cycle analysis, price forecasting, and key timing levels.
Members also receive a weekly market letter with detailed analysis, commentary from our Chief Analyst, including actionable insights, trade timing, and direction forecasts for gold and silver.
Stay ahead of the market — join our premium community today.