

Silver Price Forecast: Silver Holds Above $50 Ahead of US Jobs
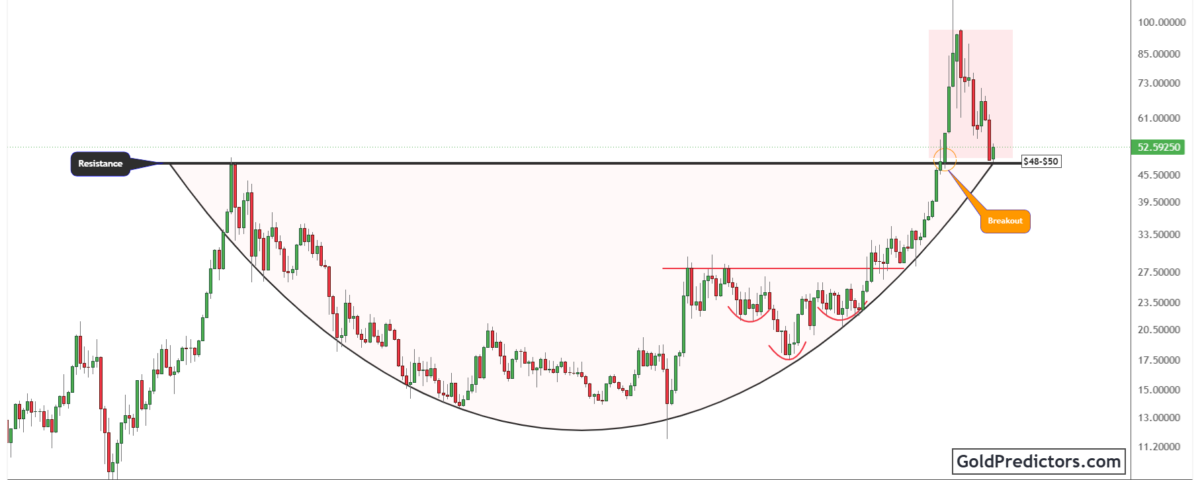
Silver (XAG/USD) trades near $53 as a weaker US dollar and lower Treasury yields support its recovery. Markets now await Friday’s US jobs report. The price remains above the $48–$50 support area, keeping the long-term breakout in place. Meanwhile, the Nasdaq to silver ratio shows a slight monthly pullback after recovering from support. A further decline in the ratio would suggest improving relative strength for silver.
Silver Market Outlook: US Payrolls Could Shape the Next Move
Silver traded near $53 on November 5 as the US dollar and Treasury yields declined after the US midterm elections. These conditions helped silver extend its recovery. A weaker dollar makes silver more affordable in other currencies. Lower yields reduce the income advantage of government bonds over silver.
Lower oil prices could also ease inflation pressure and reduce the case for higher interest rates. That offers support for silver, but the employment report remains a separate test. The October US jobs report is scheduled for Friday, November 6. Slower hiring or softer wage growth could support further declines in yields and the dollar. Strong employment or faster wage growth could reverse those moves and slow the silver recovery.
Silver Technical Analysis: $48–$50 Support Remains Key to the Recovery
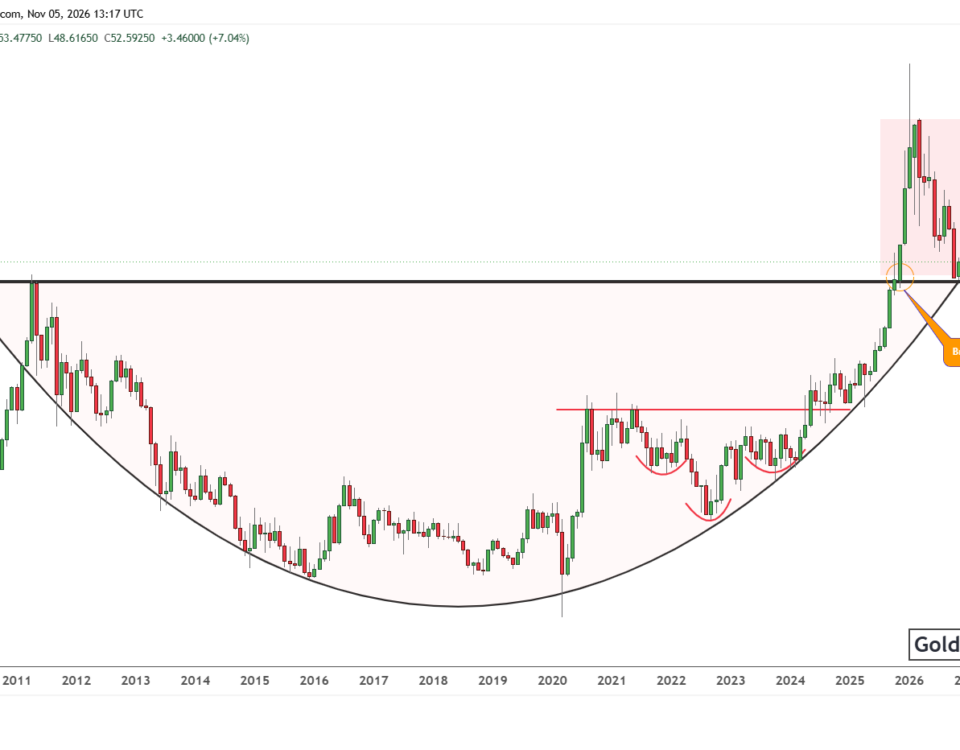
The monthly silver chart shows a large rounded base that formed between 2011 and 2025. Silver later broke above the $48–$50 resistance area and moved much higher. The subsequent decline has brought the price back to that same area. This makes $48–$50 the main support zone for assessing whether the breakout remains valid.
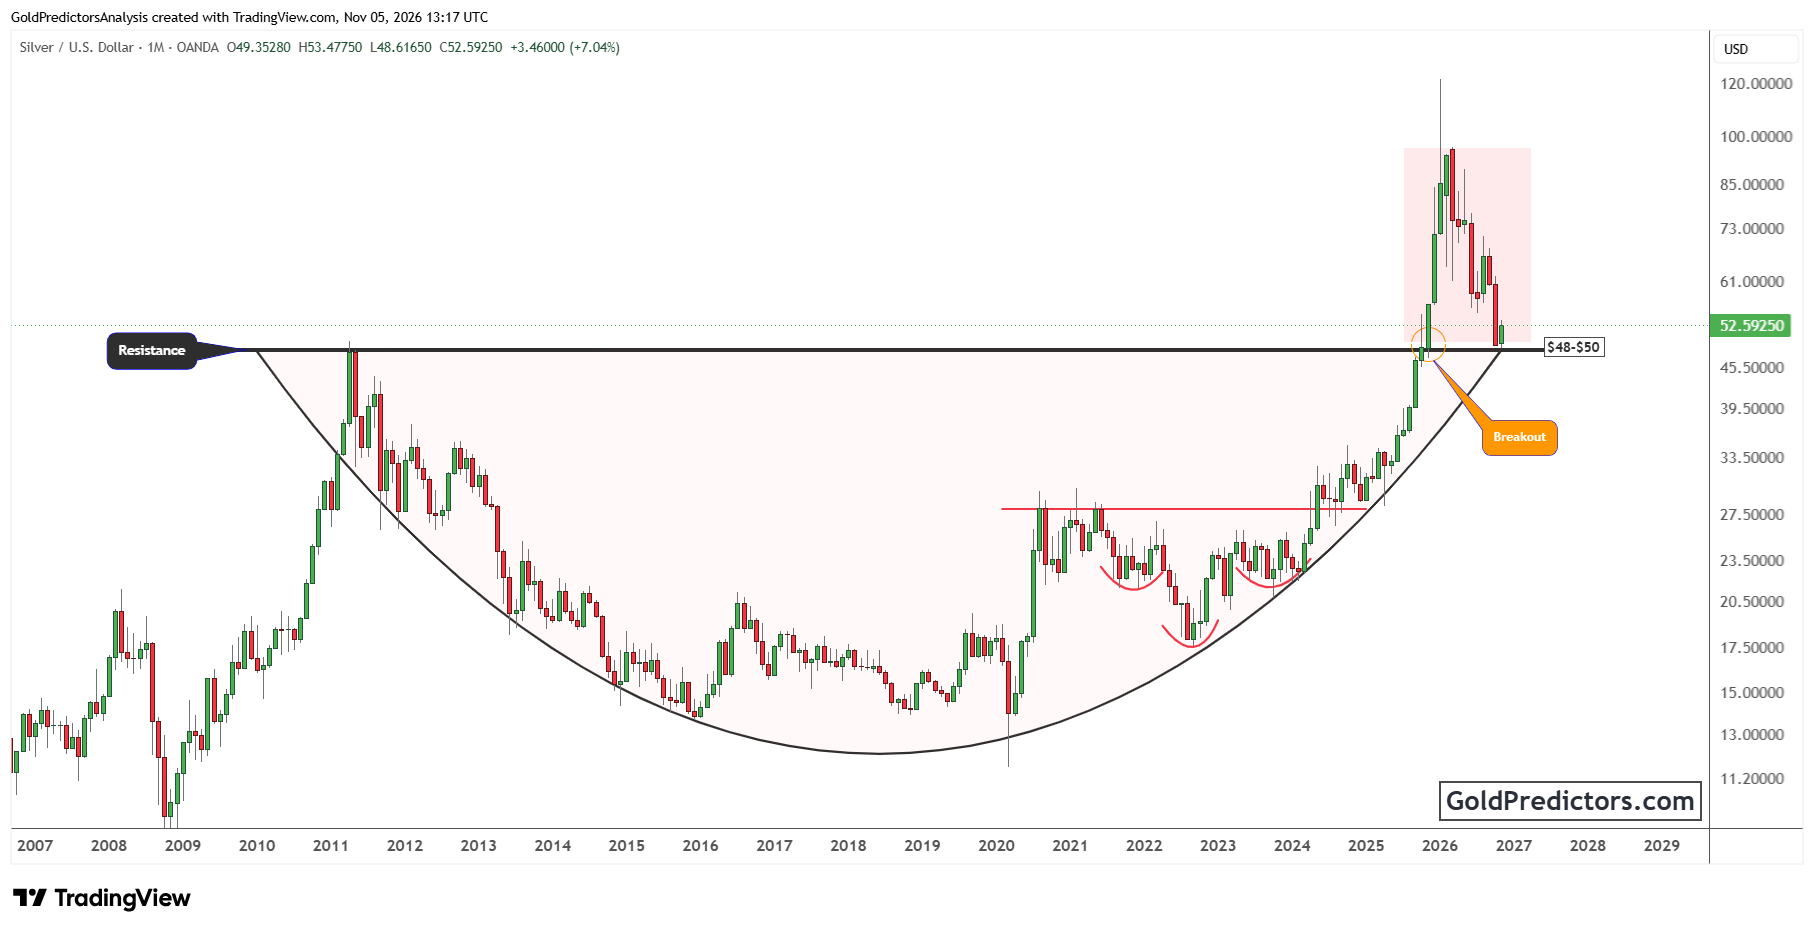
The chart shows silver near $52.85 after a November low around $48.62. That recovery suggests demand has returned near former resistance. However, the November candle is still forming. A monthly close above $50 would provide stronger evidence that this area is acting as support.
A further rise could bring the $60–$61 area into focus. Silver traded around that region before the latest decline, so it may now act as resistance. A sustained move above it could allow a recovery toward $70–$73. A monthly close below $48 would weaken the breakout and increase the risk of further losses.
Nasdaq to Silver Ratio Rebounded From Long-Term Support
The monthly Nasdaq to silver ratio remains above its long-term rising support line. Previous declines toward this line led to strong recoveries in the ratio. A rising ratio favors the Nasdaq, while a falling ratio shows stronger silver performance.
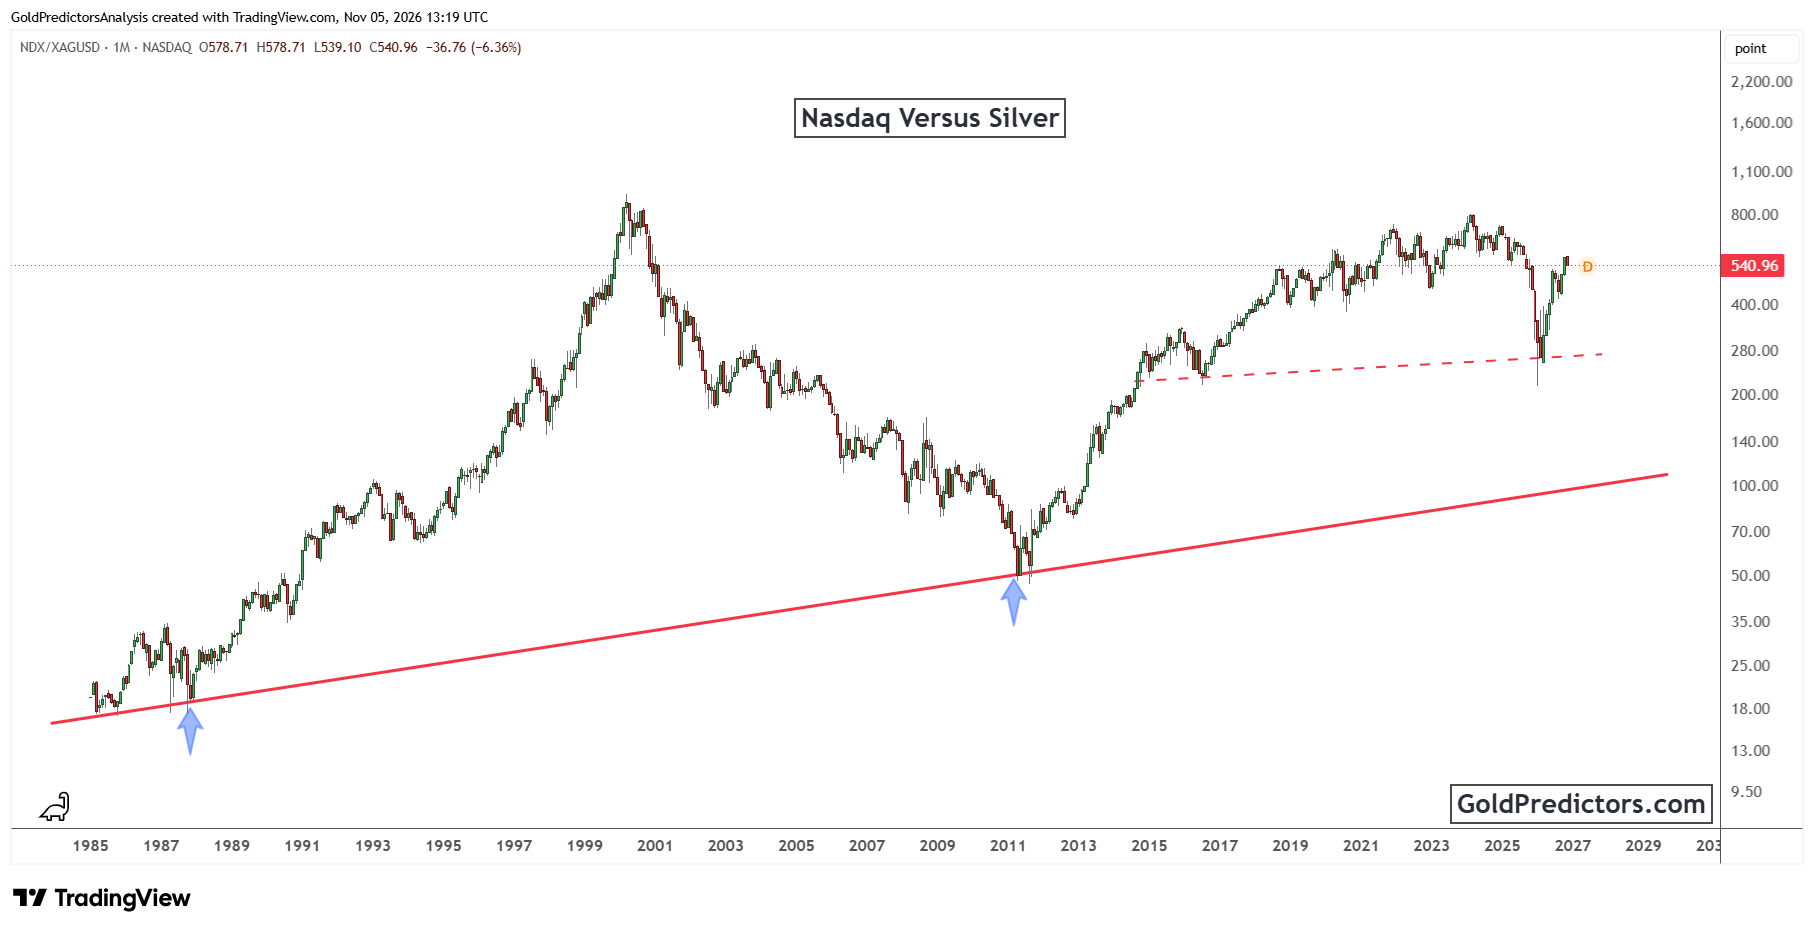
The ratio recovered from the dashed support line near 260–280 and now stands around 540. That recovery showed the Nasdaq gaining strength against silver. The latest monthly candle has moved lower, suggesting silver is regaining some relative strength.
The 580–600 area is the next resistance zone. A sustained move above it could bring the 700–800 area into focus and favor further Nasdaq outperformance. If the ratio continues to fall, the dashed support line remains an important reference. A break below that line would strengthen the case for silver to outperform.
Silver Price Outlook: Softer US Jobs Data Could Support Further Recovery
The silver price forecast depends on the $48–$50 support area. A firm hold above it would keep the rounded base breakout valid and leave room for a recovery toward $60–$61. A monthly close below $48 would weaken that outlook. Friday’s US jobs report could shape the next move through the dollar and Treasury yields. Improving performance against the Nasdaq would add confidence to the recovery.
Gold Predictors Premium Membership
Get exclusive short-term and swing trade ideas with precise entry levels, stop-loss, and target prices, including justification and analysis — all delivered directly via WhatsApp.
Our premium service includes deep technical analysis on gold and silver markets. We cover cycle analysis, price forecasting, and key timing levels.
Members also receive a weekly market letter with detailed analysis, commentary from our Chief Analyst, including actionable insights, trade timing, and direction forecasts for gold and silver.
Stay ahead of the market — join our premium community today.