Gold Price Consolidates Below $3,500—Next Target $4,000?
Gold continues to trade in a strong uptrend, showing repeated bullish rallies followed by short consolidation phases. Since early 2024, prices have reached a record high of $3,500 and have since consolidated below this level. These consolidations resemble past setups that led to major breakouts. Current technical patterns and strong market fundamentals suggest gold may be preparing for another upward move. However, a deeper correction to $ 3,000-$ 3,100 might develop before the next move higher.
Gold Price Consolidation Pattern Signals Potential Breakout to $4,000
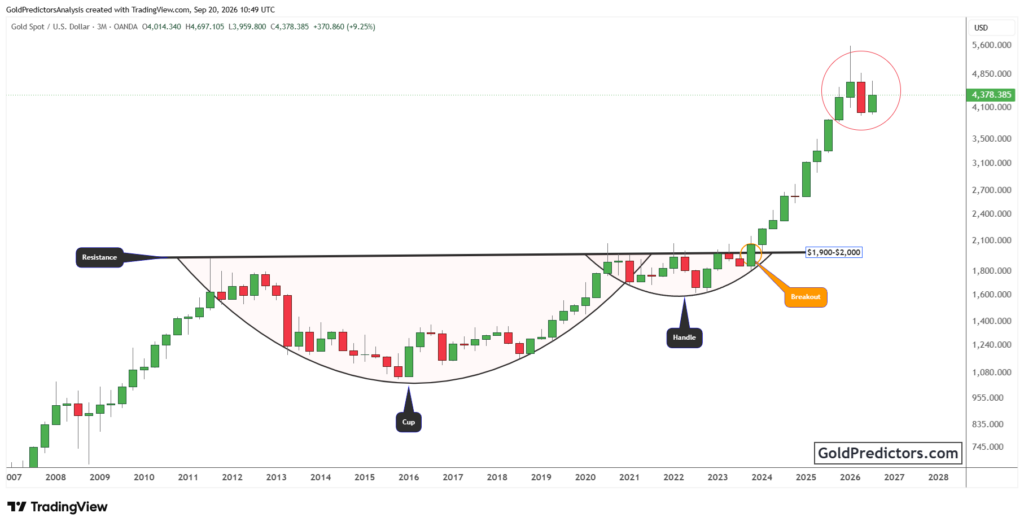
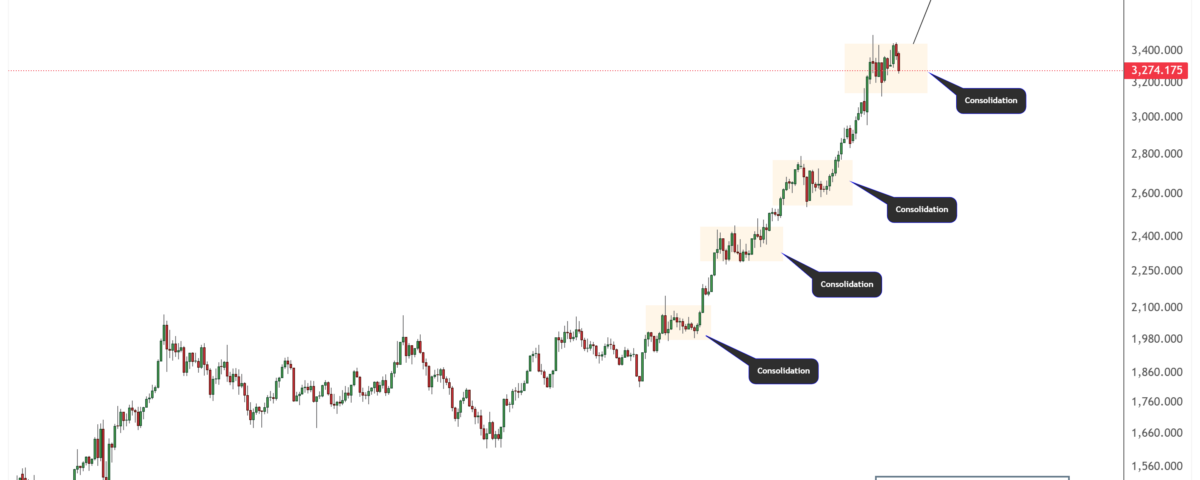
The gold chart below shows the trend and formation of key consolidation zones in gold prices over the past few years. It clearly shows a consistent pattern of bullish rallies followed by periods of consolidation. These consolidation phases are highlighted on the chart and represent periods where gold paused before making its next move higher.
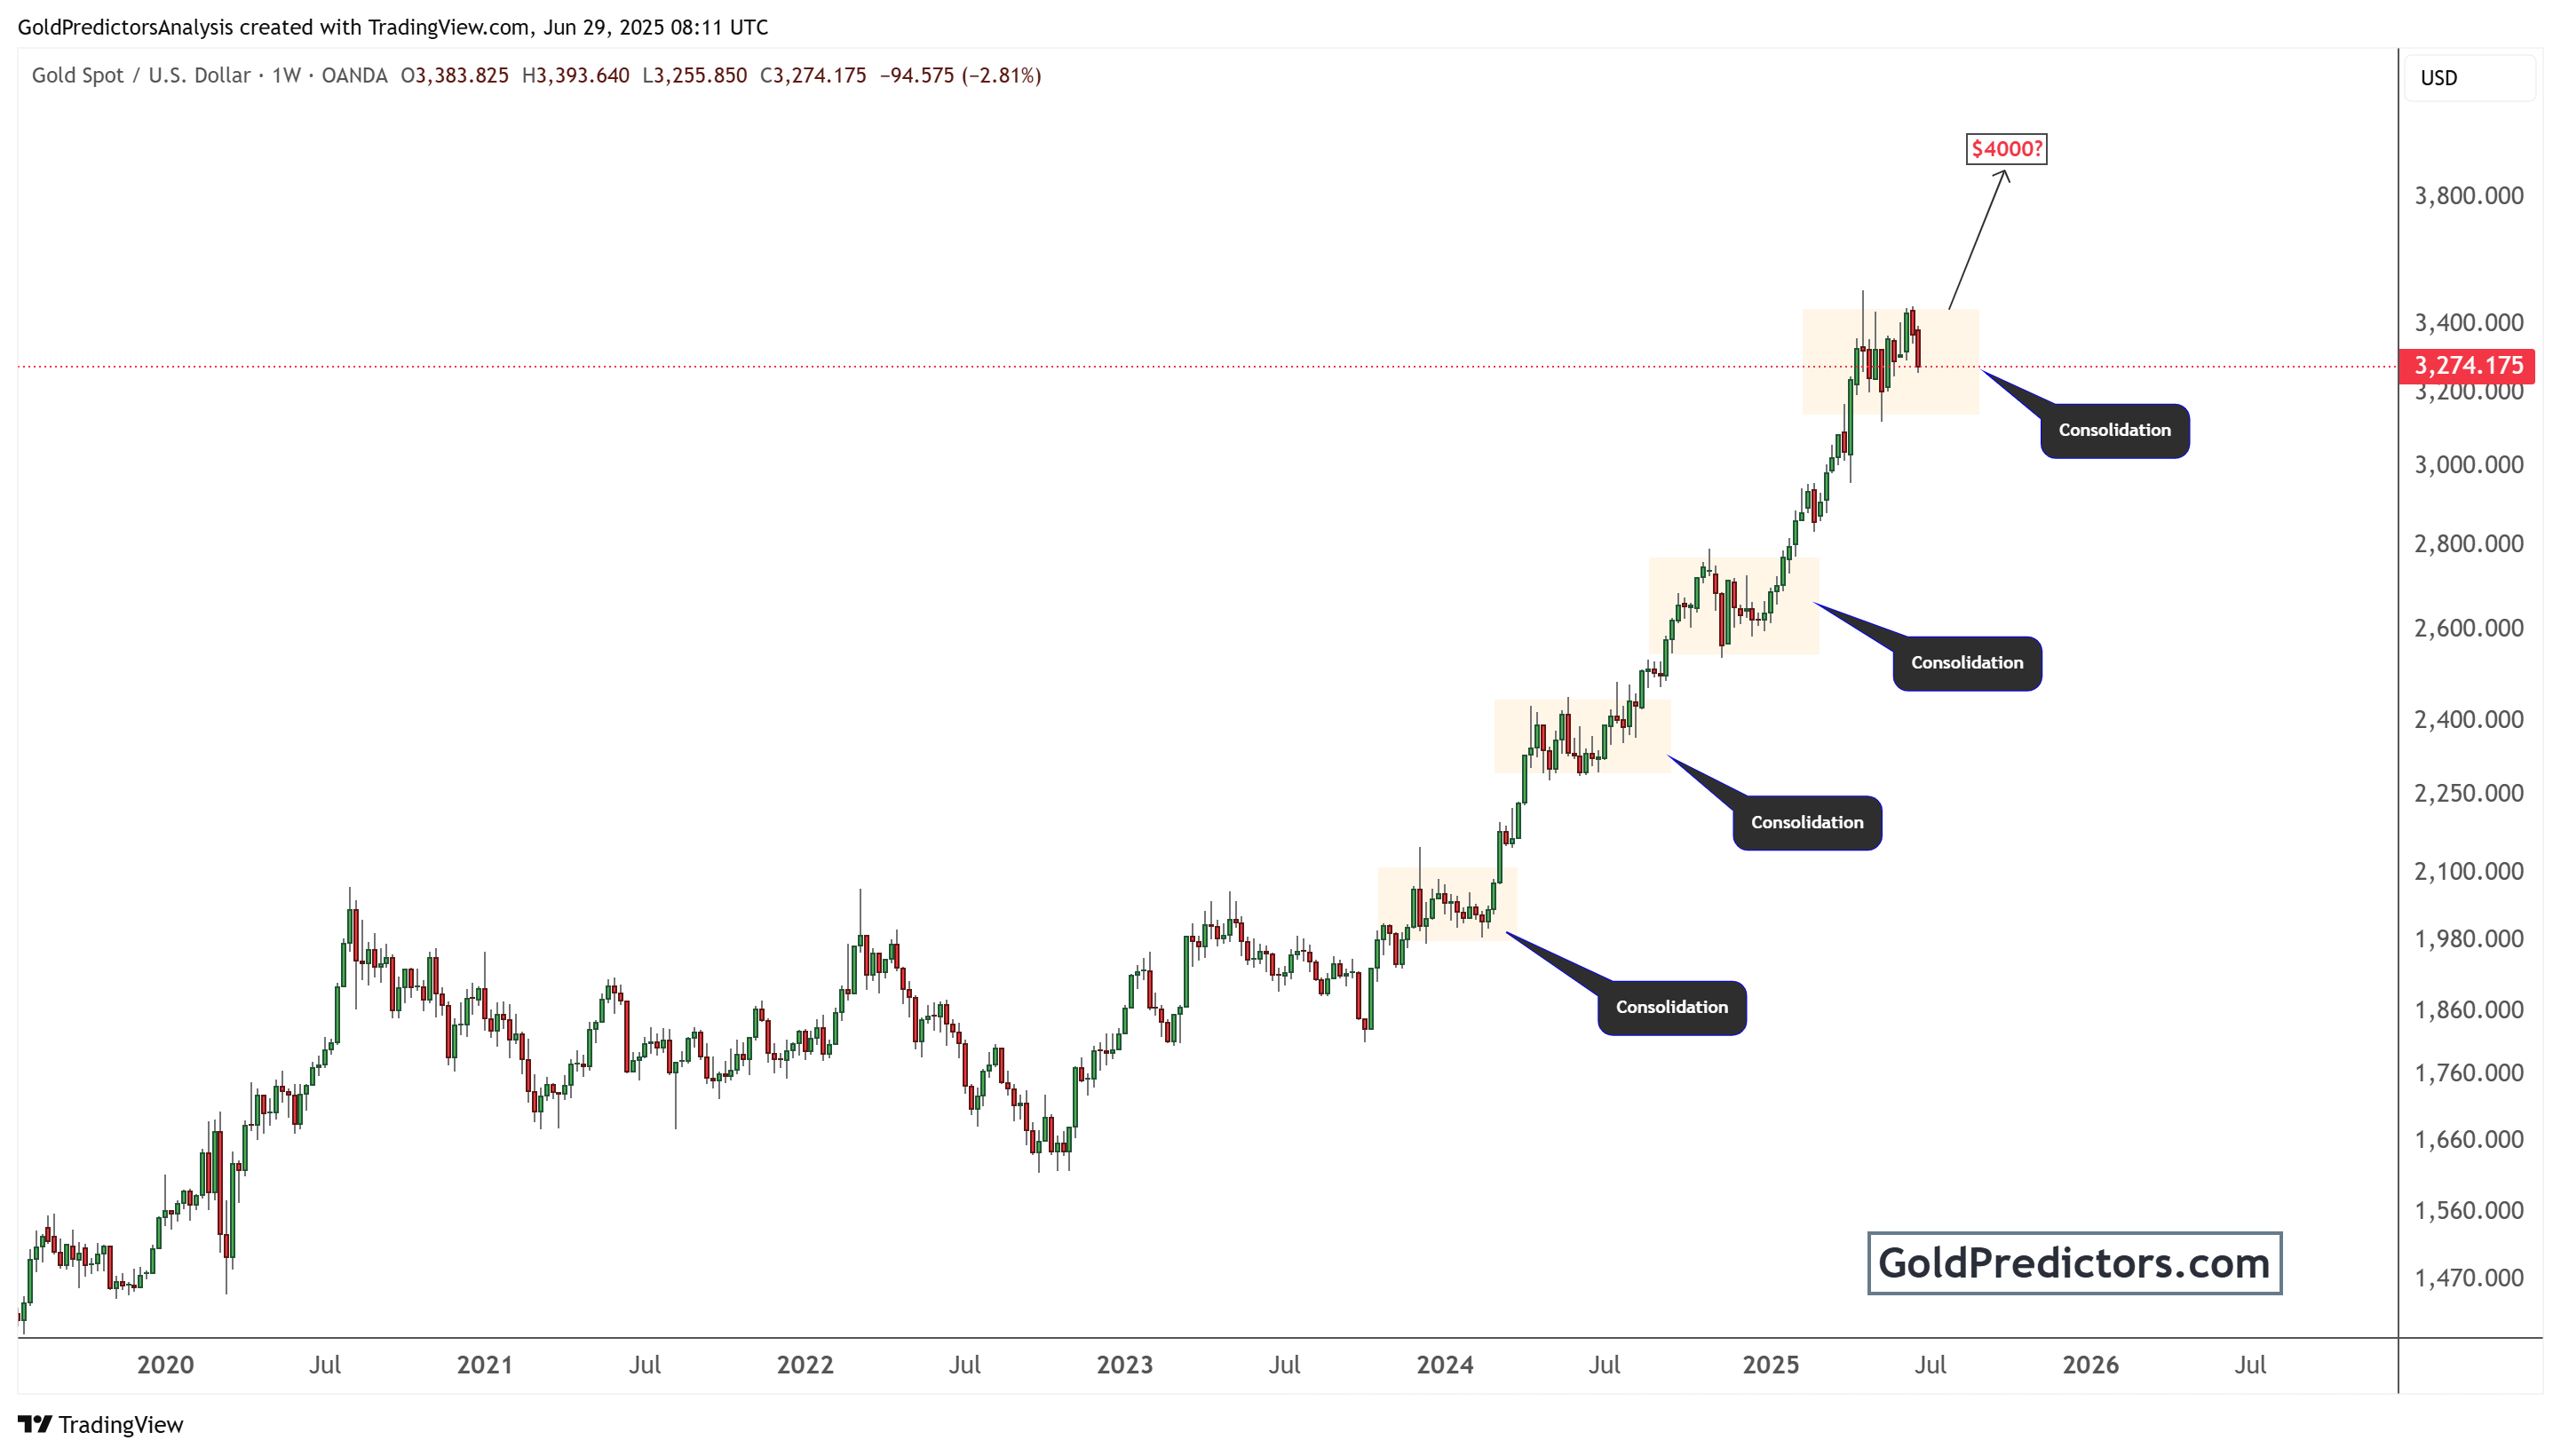
Since early 2024, gold has been in a strong uptrend. After reaching significant resistance levels near $3,500, the price entered another consolidation zone. Historically, these consolidation phases have acted as launchpads for the next leg higher. The chart suggests a similar setup, where, after this brief consolidation, gold could target the $ 4,000 level.
The price of gold currently stands at around $3,300 per ounce, slightly below its recent highs. However, the price remains in a sideways pattern, which points toward a continuation of the broader bullish trend. Market sentiment remains positive, driven by ongoing geopolitical tensions, rising inflation, and central banks’ increasing gold reserves.
If gold follows the same structure observed in previous rallies, a breakout from the current consolidation zone could propel prices toward $ 4,000. Traders and investors should closely monitor this consolidation phase, as its resolution may define gold’s next significant move.
Historic Gold Breakout above Inflation-Adjusted Trendline Suggests Long-Term Bull Market
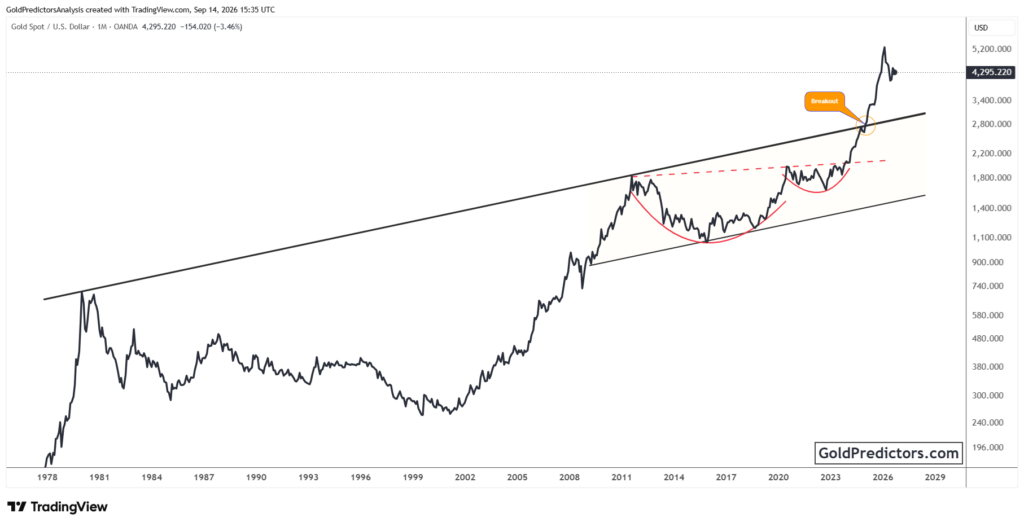
The chart below shows a long-term historical view of gold prices adjusted for changes in the global money supply. This perspective tracks gold’s performance over several decades, highlighting significant peaks, downtrends, and major breakout events. It helps to illustrate how gold’s value evolves when adjusted for monetary expansion.
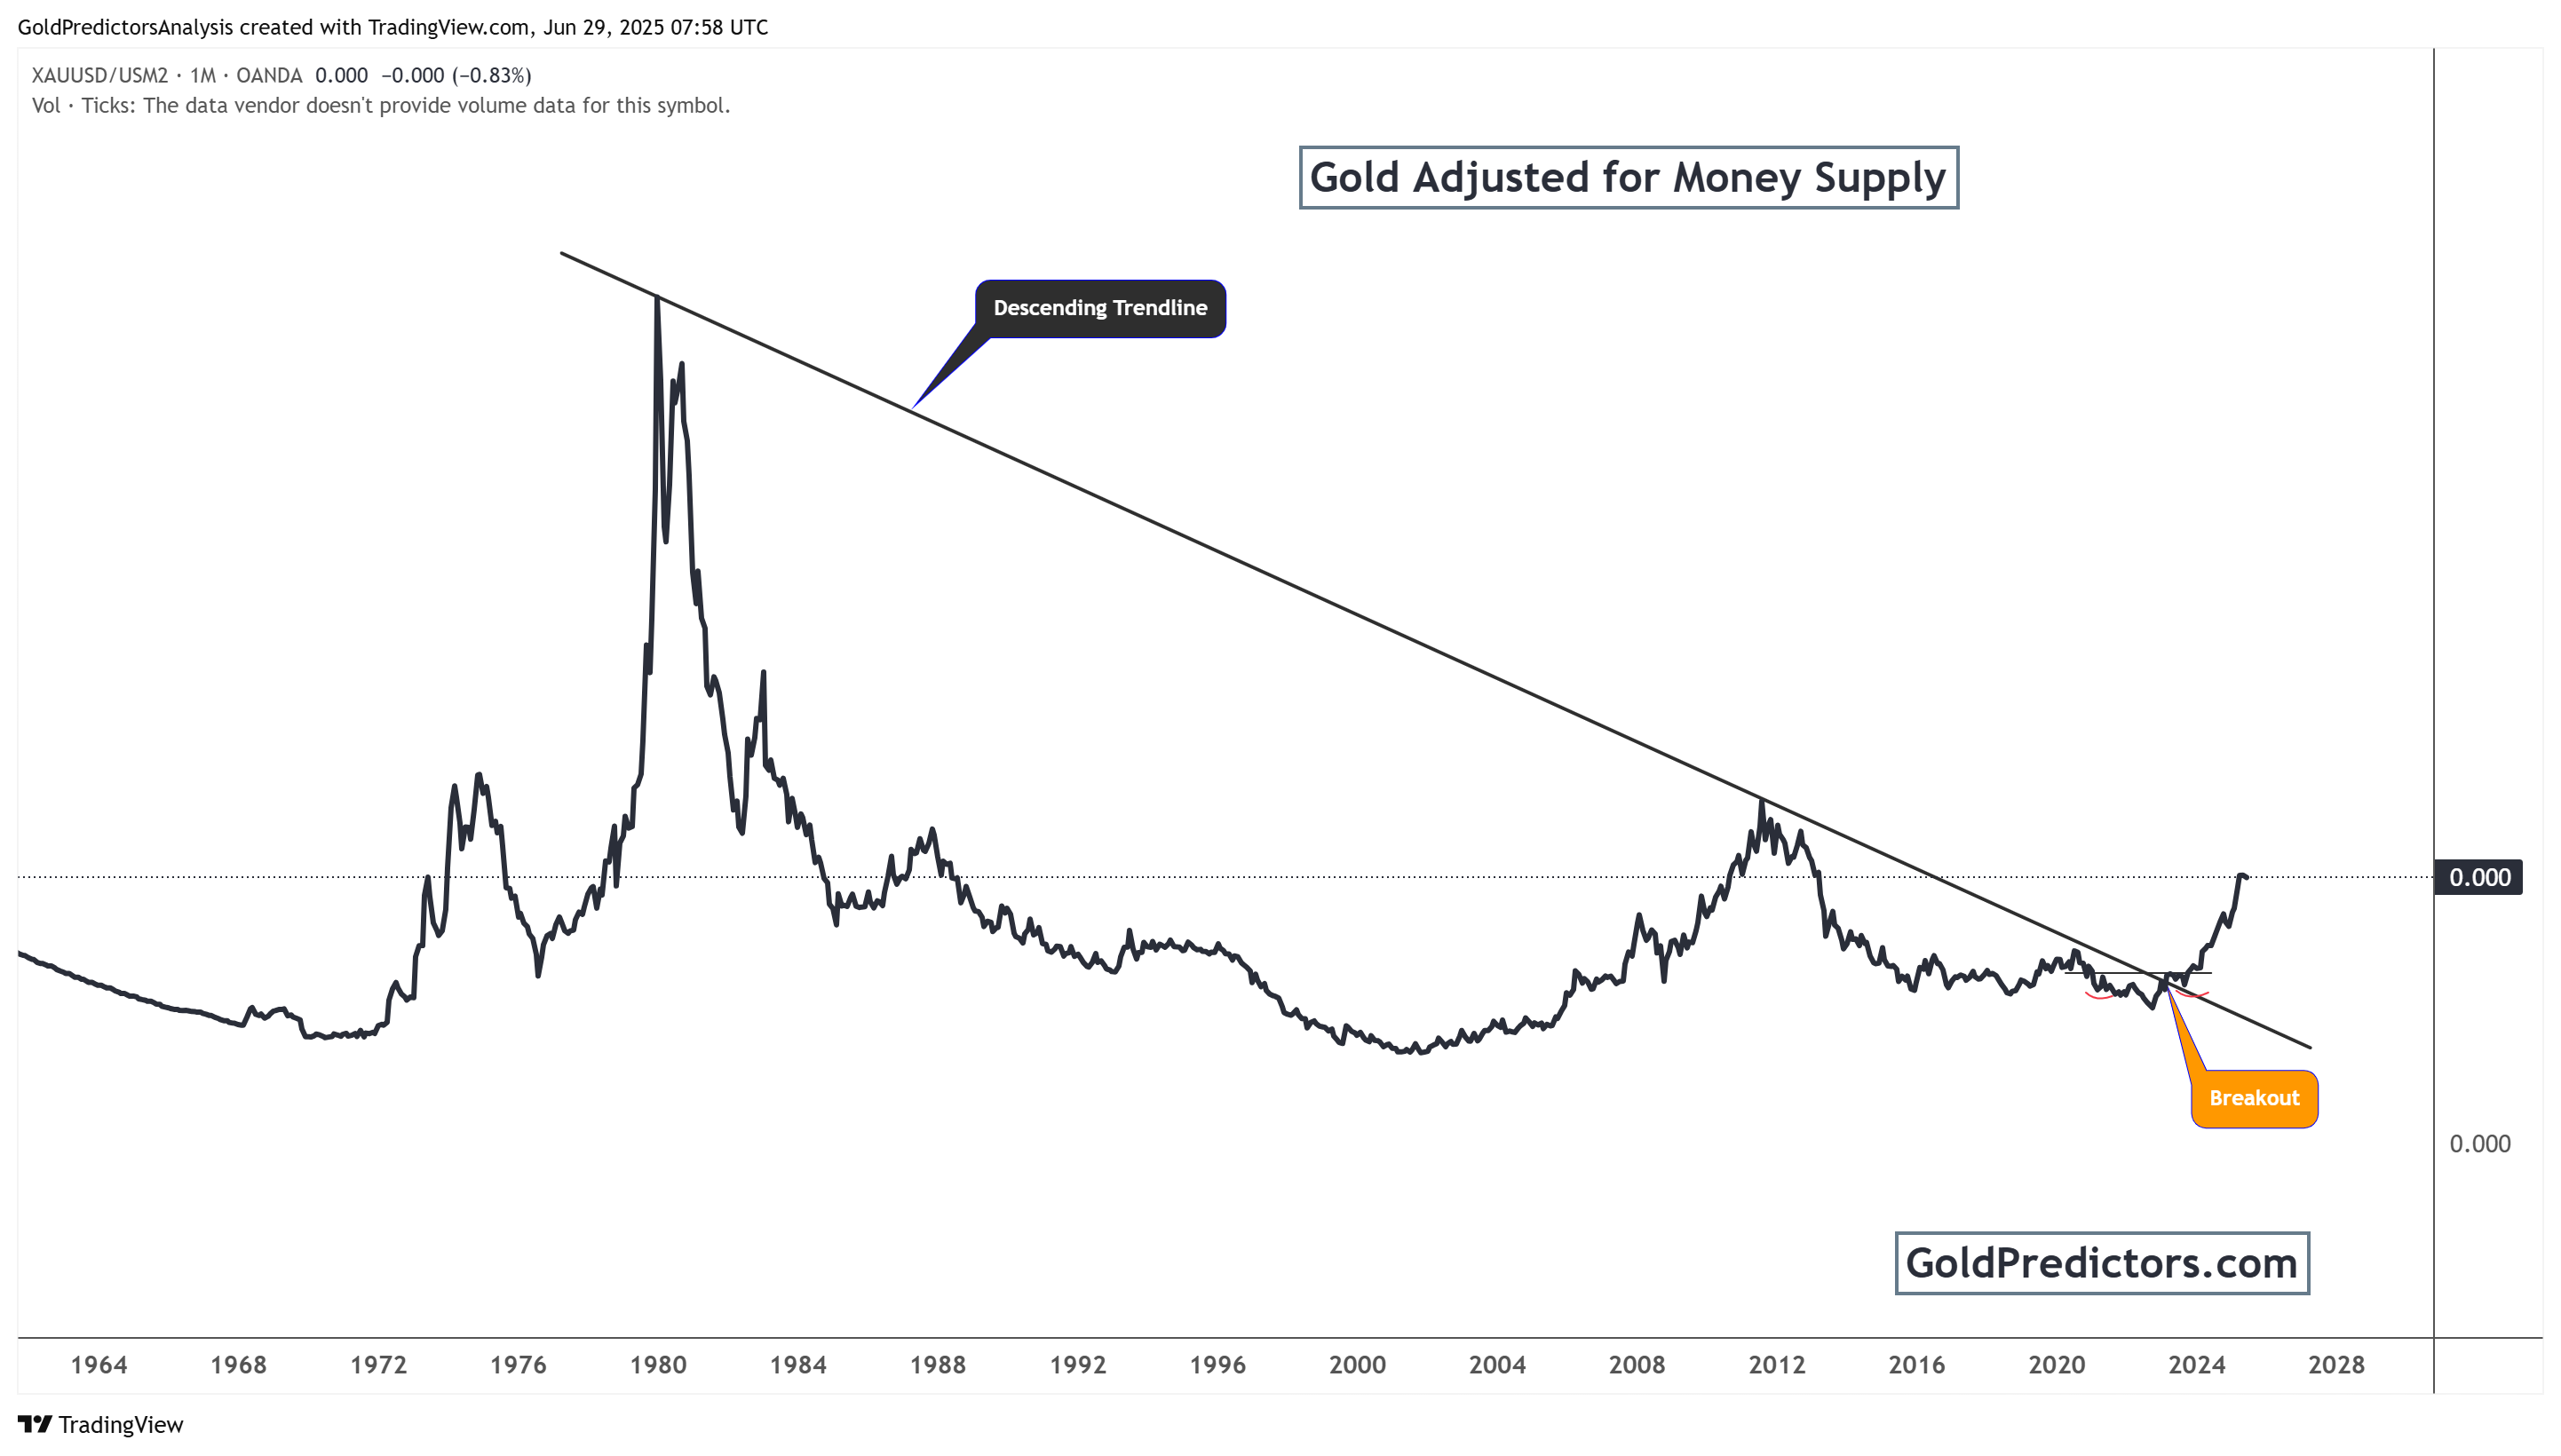
Since the early 1980s, gold adjusted for money supply had remained below a dominant descending trendline. This trendline served as a long-term resistance, capping the real value growth of gold. However, in 2024, gold decisively broke above this descending trendline, signalling a significant technical breakout with substantial bullish implications.
Such a breakout is a positive signal for gold’s future performance. It suggests that gold is entering a new structural growth phase, driven by macroeconomic factors such as high inflation, currency debasement, and rising global debt. Historically, similar breakout events have preceded major rallies in gold. Combined with increasing nominal gold prices and growing demand as a safe-haven asset, the alignment of short-term and long-term bullish patterns strengthens the outlook for continued gains. Investors should view this breakout as a sign of a broader market cycle shift, positioning gold as a hedge against inflation and currency weakness.
Conclusion: Gold Poised for $4,000 Rally as Technical and Fundamental Factors Align
Gold is exhibiting strong signs of resilience in both the short and long term. The current consolidation near $3,300 mirrors past patterns that preceded strong rallies. With ongoing geopolitical risks, inflation, and central bank demand, gold remains fundamentally supported. If the market structure remains intact, a breakout could propel prices toward the $4,000 level.
Long-term technical indicators also support this bullish case. The breakout above the money supply-adjusted trendline marks a historic shift. This rare event suggests a significant change in gold’s intrinsic value. Similar breakouts in the past led to strong multi-year uptrends, reinforcing the bullish outlook.
Investors should closely monitor gold as it tests this key consolidation zone. A confirmed breakout could trigger a wave of new buying. Whether for protection against inflation or as a store of value, gold remains a popular choice.
Gold Predictors Premium Membership
Get exclusive short-term and swing trade ideas with precise entry levels, stop-loss, and target prices, including justification and analysis — all delivered directly via WhatsApp.
Our premium service includes deep technical analysis on gold and silver markets. We cover cycle analysis, price forecasting, and key timing levels.
Members also receive a weekly market letter with detailed analysis, commentary from our Chief Analyst, including actionable insights, trade timing, and direction forecasts for gold and silver.
Stay ahead of the market — join our premium community today.