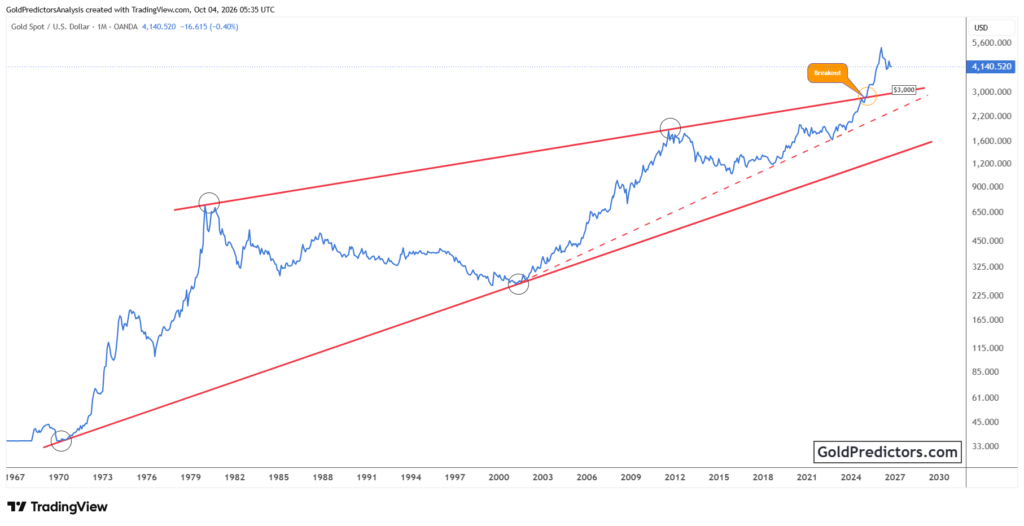
Gold Price Forecast: XAU/USD Consolidates as Palantir-to-Gold Ratio Tests Resistance
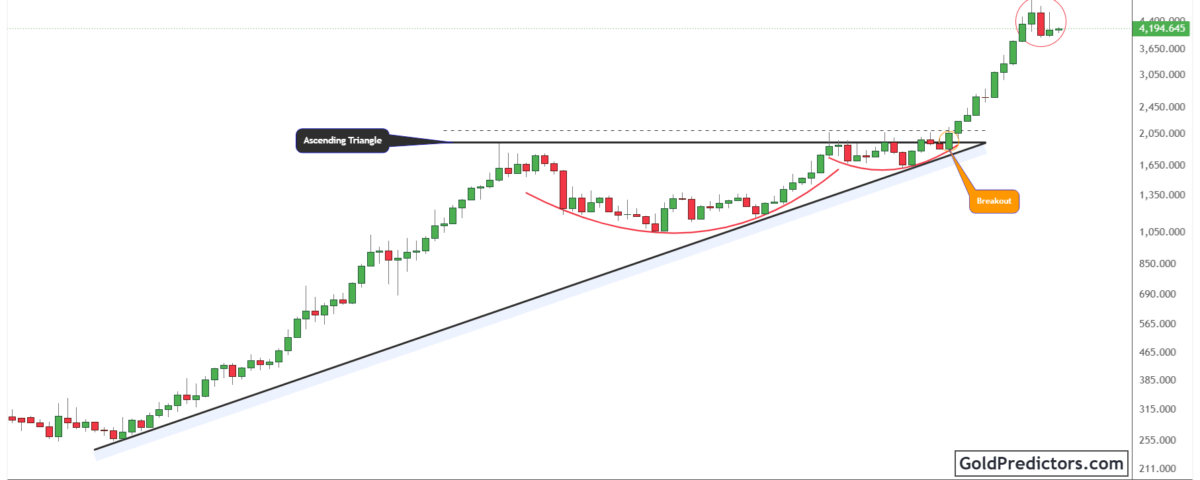
Gold (XAU/USD) is consolidating near $4,195 after a sharp correction from its peak. The price remains well above the major ascending triangle breakout, keeping the broader upward structure intact. Regional tensions could support defensive demand, while higher energy costs may increase inflation and interest-rate pressures. Meanwhile, the Palantir-to-Gold ratio is testing resistance near 0.05 after Palantir’s recent outperformance. These market drivers and the next move in both technical structures could help clarify gold’s outlook.
Gold Market Outlook: Saudi Airport Attack Raises Regional Risks
The 10 October attack on King Khalid International Airport in Riyadh has raised regional security concerns. The attack disrupted flights and suspended airport operations. US President Donald Trump said Washington would consider joining Saudi strikes against the Houthis. For gold, the risk of a wider conflict could strengthen demand for defensive assets when markets reopen. The attack also raises concerns about regional infrastructure. However, an airport disruption alone does not establish that oil production has fallen. The market impact will depend on further developments.
Energy supply strains, rising interest rates and heavy public debt are also shaping preparations for this week’s IMF–World Bank meetings in Bangkok. These pressures create a mixed backdrop for gold. Higher fuel costs could keep inflation elevated and make monetary easing harder. If inflation-adjusted yields rise, gold faces greater competition from interest-bearing assets. At the same time, weaker growth and geopolitical uncertainty could support defensive demand. Gold faces competing forces, with its next move depending on how energy prices and yields respond.
Gold Technical Analysis: Consolidation Continues Above the Triangle Breakout
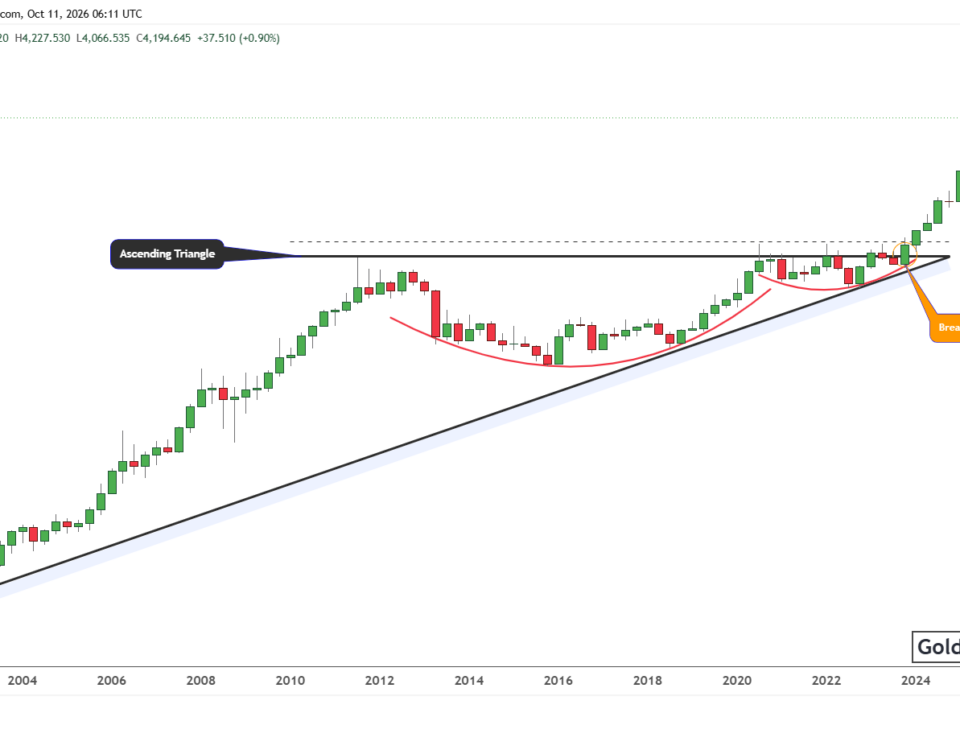
The quarterly gold chart shows a major ascending triangle. A rising support line meets a broad horizontal resistance area near $2,000–$2,100. Gold moved above this area and later accelerated sharply. The rounded bases within the larger structure show that the rally followed an extended period of consolidation. This gives the broader upward trend a clear historical foundation.
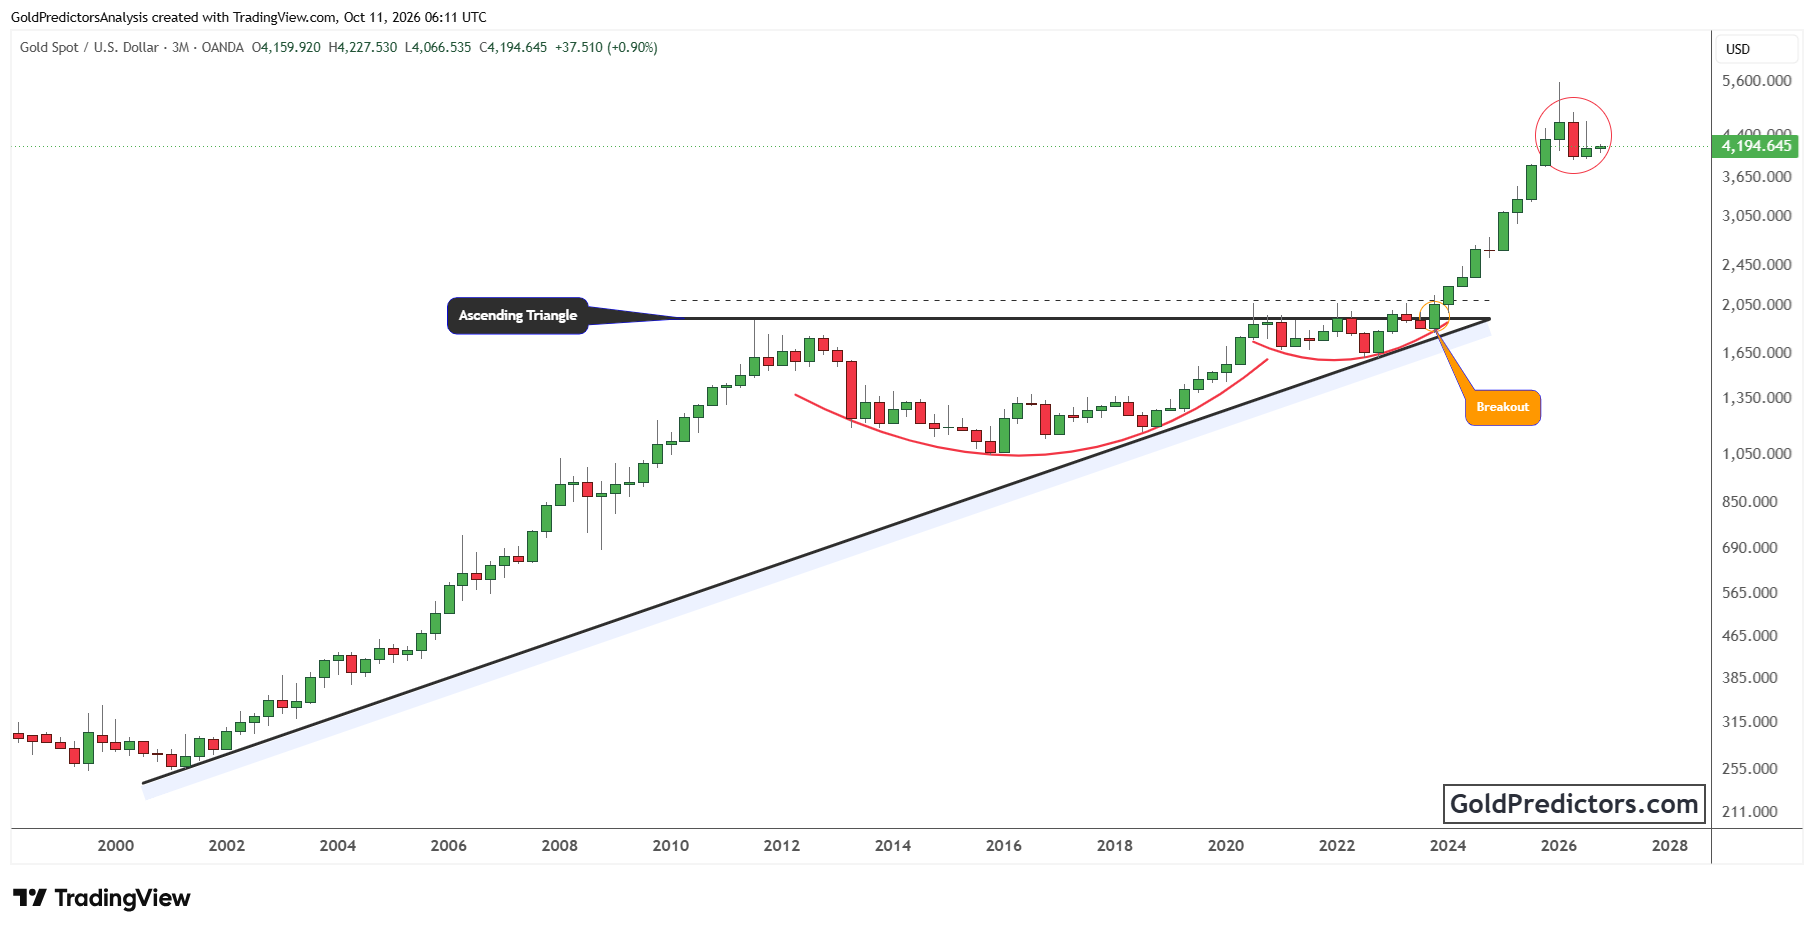
Price has since pulled back, and the latest candles cluster near $4,200. The long upper wick near the peak shows that gold could not maintain its highest levels. The subsequent correction confirms that momentum has cooled. However, price remains far above the earlier breakout area. The broad structure therefore remains intact, while the recent candles point to consolidation rather than renewed acceleration.
The current quarterly candle is still forming, with a low near $4,067 and a high near $4,228. The chart shows a price of $4,194.65, close to the $4,200 psychological level. Gold would show renewed strength if it rises above the recent quarterly range and holds there. A decline below $4,000 would weaken the near-term outlook. These levels highlight the key areas to watch, while the wider chart helps assess gold’s long-term trend.
Palantir-to-Gold Ratio Tests Key Resistance after Recent Outperformance
The monthly Palantir-to-gold chart divides Palantir’s share price by the gold price. The ratio formed a rounded base, cleared earlier resistance, and moved into a broad consolidation range. The lower boundary sits near 0.024–0.025, while the upper boundary lies around 0.05. The latest reading of 0.0498 places the ratio close to resistance after a rise from the lower part of that range.
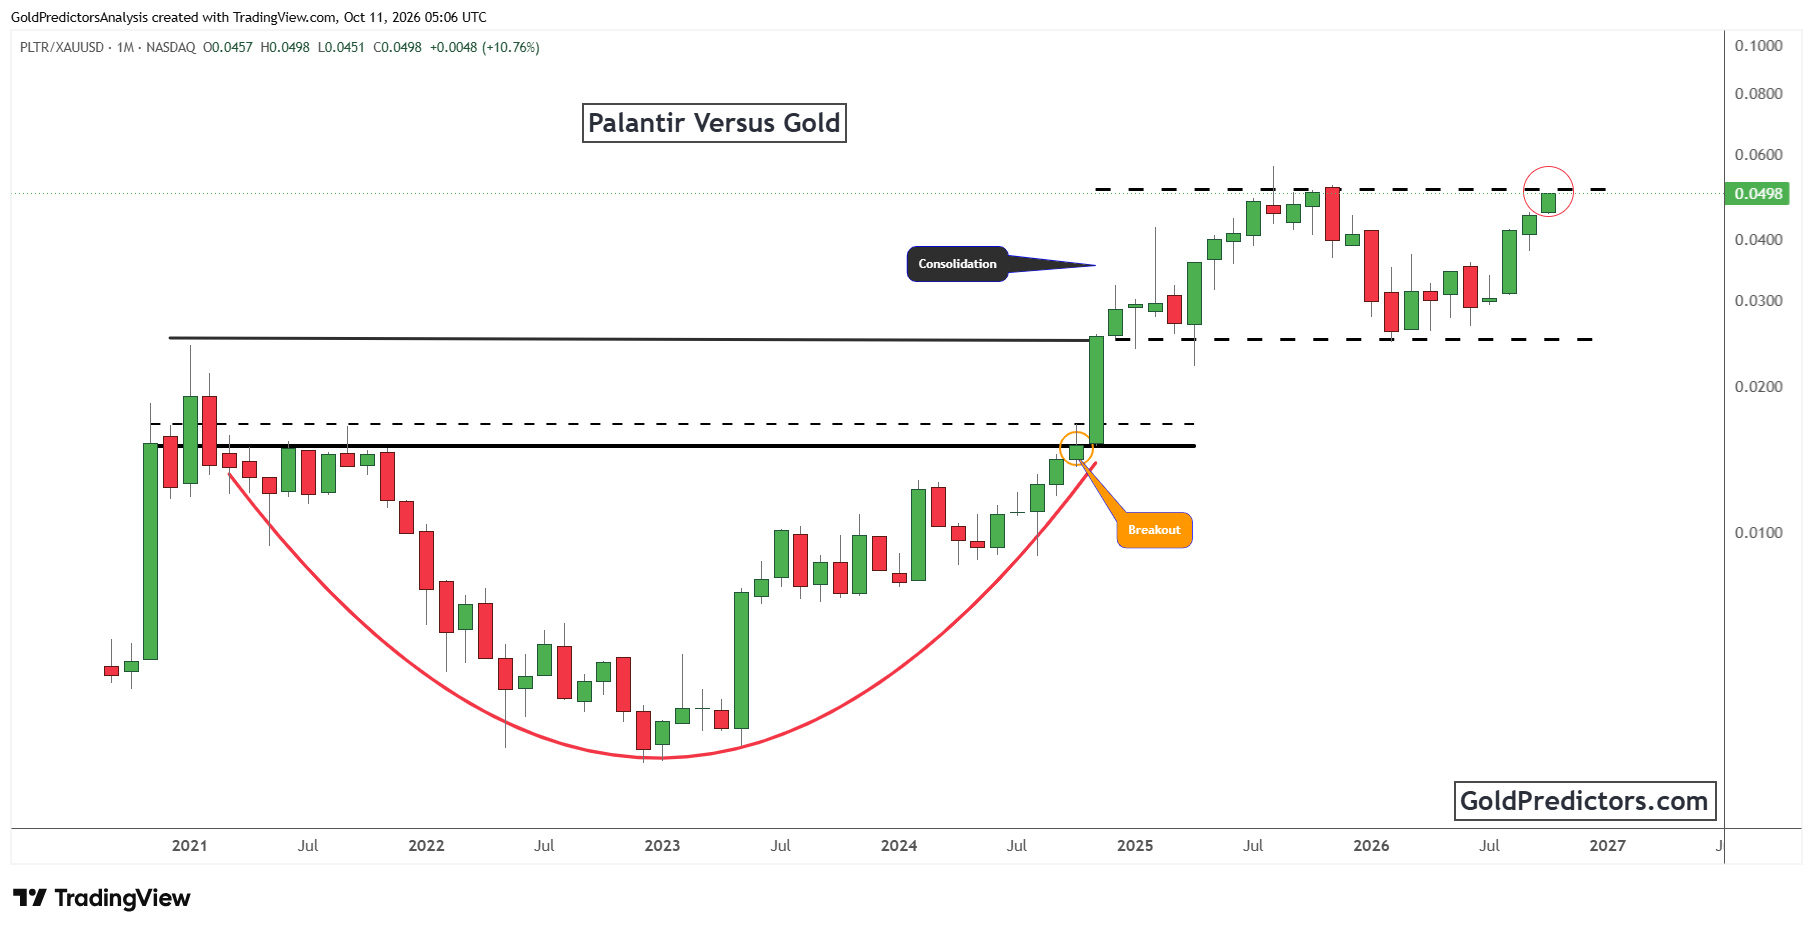
A rising ratio means Palantir is outperforming gold over the period measured. A sustained move above 0.05 would suggest that this relative strength is extending. Both assets could rise while the ratio strengthens if Palantir gains faster. The ratio reflects Palantir’s performance against gold, while other technology stocks may follow a different trend.
A rejection near 0.05 could suggest gold is gaining strength relative to Palantir. A return toward the lower boundary would extend that shift. The key issue is whether the current test leads to a durable move above resistance or another turn within the range. The current monthly candle remains incomplete, so a brief move above the boundary would need follow-through.
Gold Price Outlook: Regional Tensions and Rate Risks Could Shape the Next Move
Gold’s broader upward structure remains intact, but the recent consolidation leaves its next direction unsettled. Sustained strength above the quarterly range would improve the outlook, while renewed weakness below $4,000 would increase correction risk. Escalating regional tensions could support defensive demand when markets reopen, although higher energy costs could complicate the interest-rate outlook. Meanwhile, the Palantir-to-gold ratio’s test of 0.05 will help show whether Palantir’s recent outperformance continues or gold gains relative strength.
Gold Predictors Premium Membership
Get exclusive short-term and swing trade ideas with precise entry levels, stop-loss, and target prices, including justification and analysis — all delivered directly via WhatsApp.
Our premium service includes deep technical analysis on gold and silver markets. We cover cycle analysis, price forecasting, and key timing levels.
Members also receive a weekly market letter with detailed analysis, commentary from our Chief Analyst, including actionable insights, trade timing, and direction forecasts for gold and silver.
Stay ahead of the market — join our premium community today.