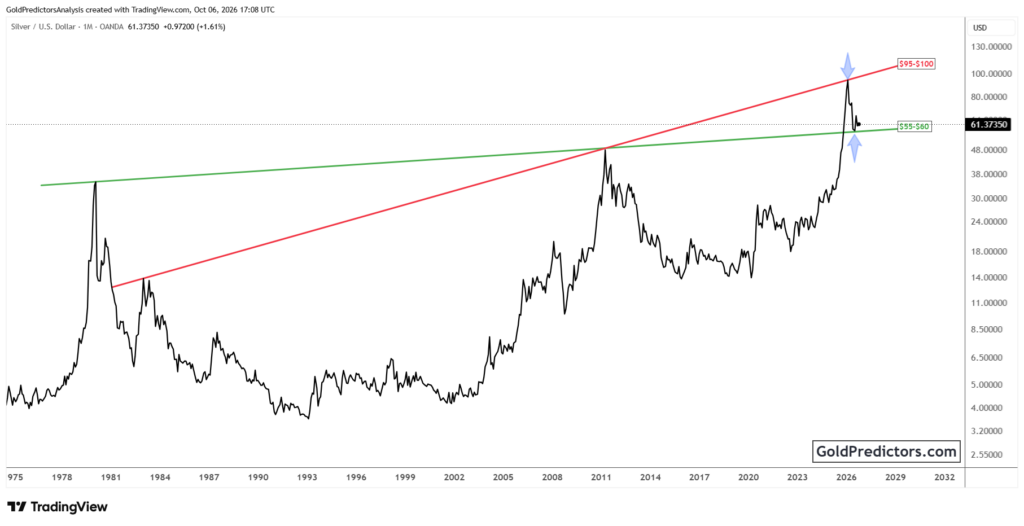
Silver Price Forecast: Could US Inflation Trigger a Deeper Correction?
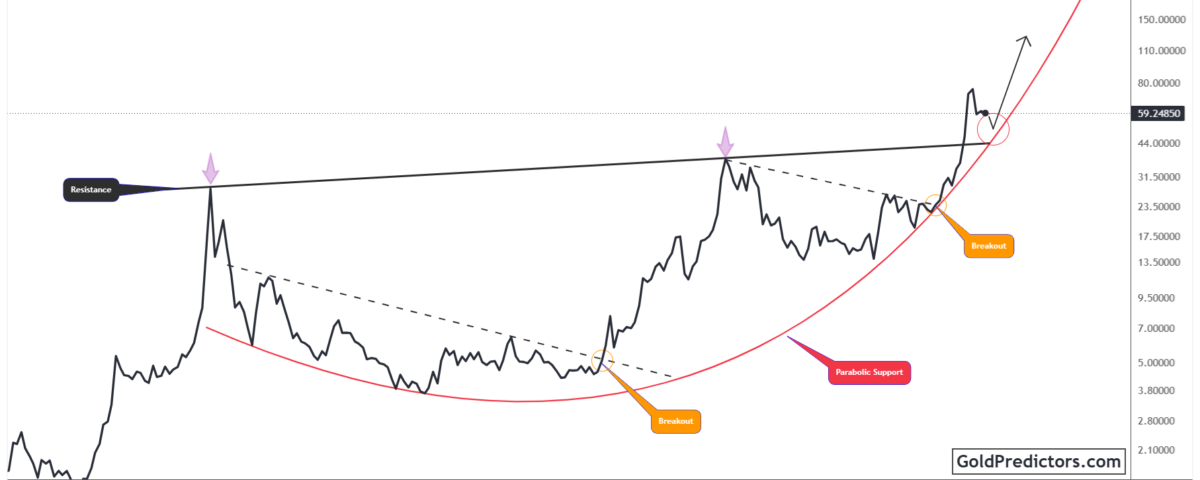
Silver (XAG/USD) is consolidating near $59 after a sharp correction. Price remains above its former long-term resistance, keeping the broader upward structure intact. Upcoming US inflation data could shift interest rate expectations and influence silver’s next move. Meanwhile, the silver-to-Dow Jones ratio is retesting the upper boundary of its major triangle. Holding this boundary would support silver’s relative strength. These technical tests and the inflation reports could help clarify whether silver can build a firmer base or faces a deeper correction.
Silver Market Outlook: US CPI Could Shift Interest Rate Expectations
Silver remained under pressure on 13 October as the dollar held near an 18-month high. Elevated energy costs also kept inflation and further interest rate increases in focus. Higher rates can weigh on silver because the metal pays no interest. Lower oil prices, a weaker dollar and falling Treasury yields could ease pressure on silver around $60. However, a fresh rise in energy prices could quickly weaken that support by raising inflation concerns again.
The next major event is the US consumer price report on 14 October. Producer prices follow on 15 October. Both releases cover September. On 13 October, market pricing implied roughly a 17% probability of an October rate increase and an 87% probability of a December increase. This gap suggests that inflation risk remains important despite limited expectations for immediate action. Stronger inflation could lift yields and the dollar, making support harder to maintain. Softer figures could help silver stabilize. Silver would then need to hold steady after the first market reaction.
Silver’s Parabolic Support: Can Rising Support Limit the Correction?
The quarterly silver chart shows a strong rise above a resistance line connecting major historical peaks. The price has since corrected to approximately $59.95, but it remains above that boundary. The former resistance line provides a potential support reference around $40–$45. This keeps the broader upward structure intact despite weaker momentum following the correction.
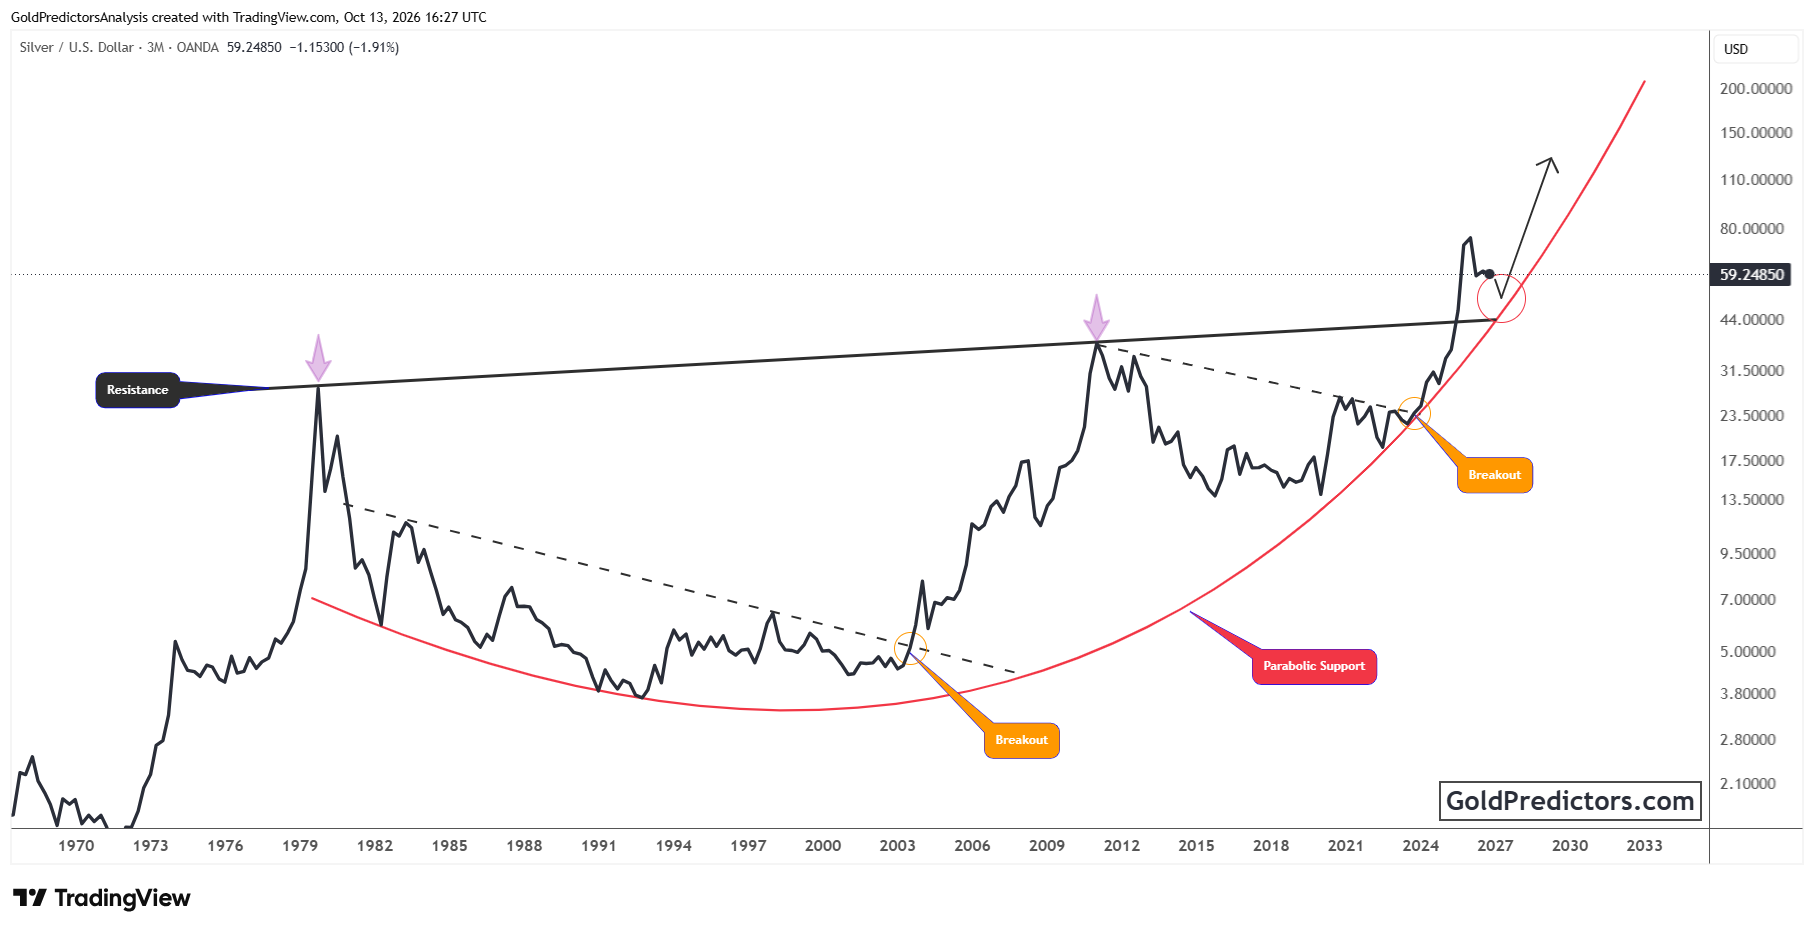
The curved red line marks a rising parabolic support path beneath price. Its level changes over time, so the timing of any retest matters. Further consolidation or a deeper pullback could occur while silver remains above these broader support references. Stabilization near $60 would help establish a firmer base closer to current levels.
If silver loses its consolidation base, the lower support references would become more relevant. Holding these areas would support the broader upward scenario. A sustained decline beneath both would weaken that structure. The upward arrow illustrates a possible continuation path that depends on silver holding support and rebuilding momentum. It does not establish a confirmed outcome or a precise timeframe.
Silver-to-Dow Jones Ratio Retests Its Major Triangle Breakout
The monthly silver-to-Dow Jones ratio stands near 0.00115. It recently moved above the descending upper boundary of a multi-decade symmetrical triangle. The subsequent pullback has brought the ratio back toward that boundary. This makes the current area an important test of whether former resistance can provide support. The breakout remains relevant, but the sharp retreat shows that silver’s relative momentum has slowed.
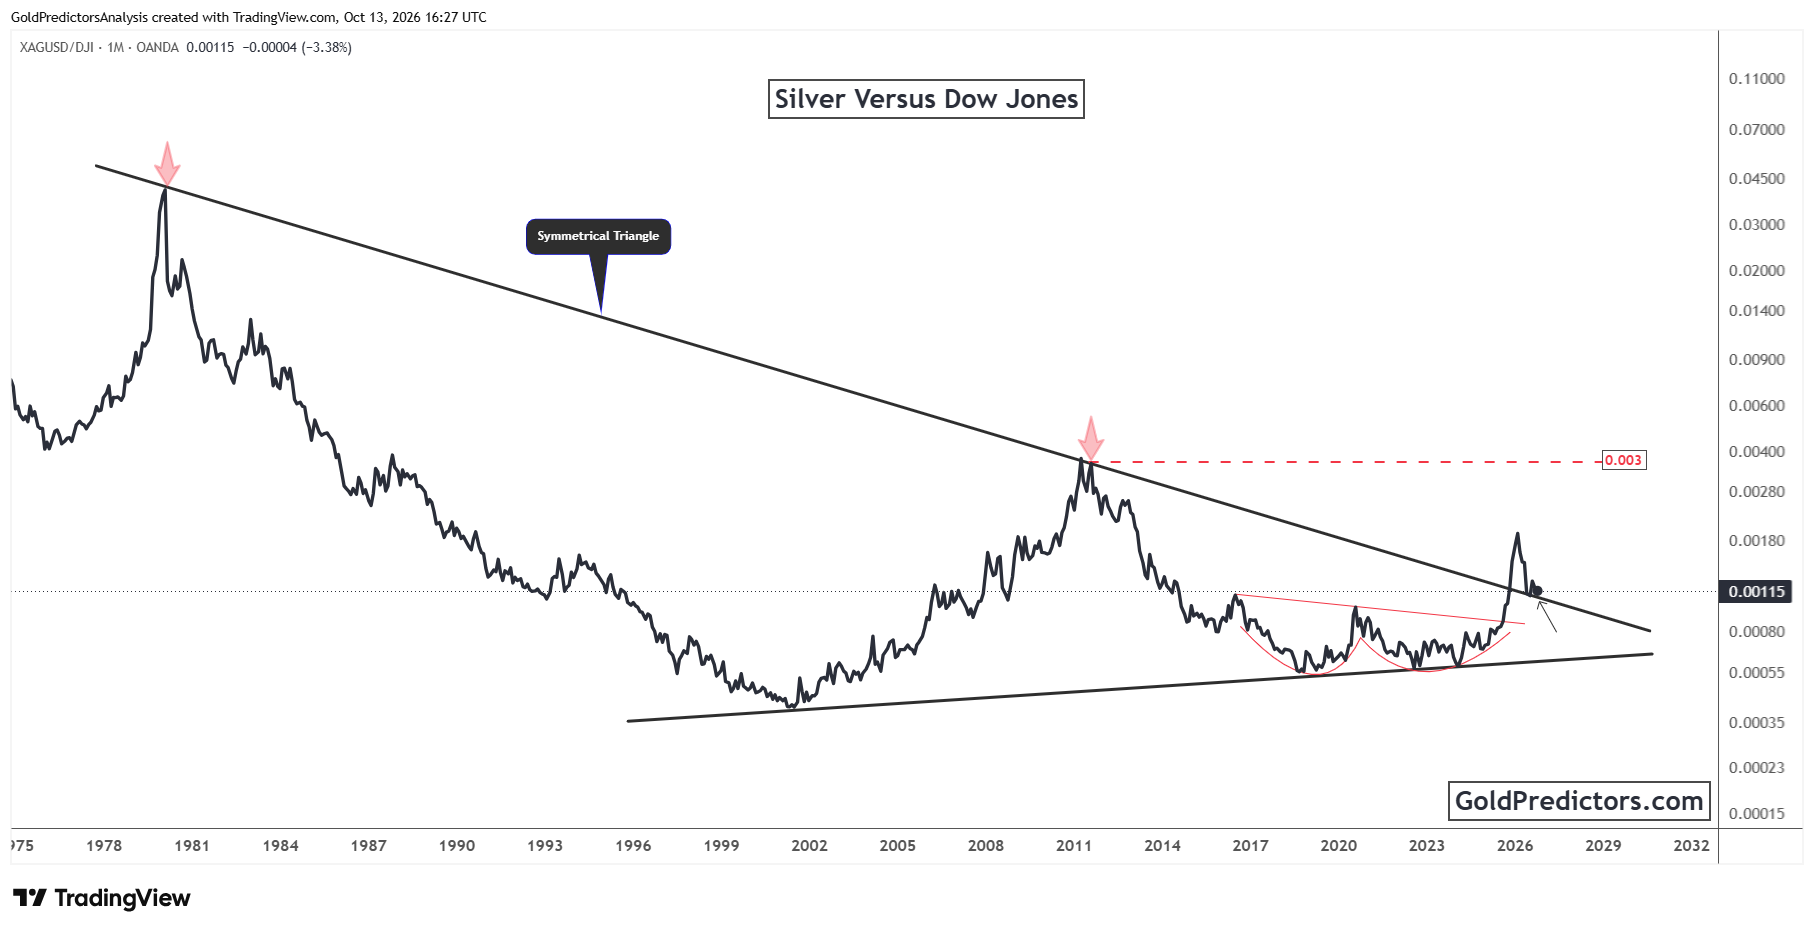
The smaller rounded bases within the triangle add context to the recent move. The rounded bases suggest that silver’s prolonged relative weakness began to ease before the ratio accelerated. If the ratio holds the descending boundary and turns higher, that would support renewed silver outperformance against the Dow. The marked 0.003 level remains a distant upper technical reference. Reaching it would require a much larger and sustained rise in the ratio.
A sustained fall back inside the triangle would weaken the breakout and indicate renewed Dow outperformance. This distinction matters for the silver price forecast. A rising ratio means silver performs better over the period measured. Silver could rise faster than the Dow, or fall less during a decline. The ratio therefore adds evidence about relative performance, while the silver price chart provides the direct view of price direction.
Silver Price Outlook: Softer CPI Could Help Silver Build a Firmer Base
Silver’s price forecast depends on whether price stabilizes near $60 and whether the silver-to-Dow ratio holds above its triangle boundary. Softer US inflation could help by easing pressure from yields and the dollar. Persistent inflation would make stabilization more difficult. Silver still trades above its former long-term resistance, but firmer price action and a successful ratio retest would provide stronger evidence that the correction is settling.
Gold Predictors Premium Membership
Get exclusive short-term and swing trade ideas with precise entry levels, stop-loss, and target prices, including justification and analysis — all delivered directly via WhatsApp.
Our premium service includes deep technical analysis on gold and silver markets. We cover cycle analysis, price forecasting, and key timing levels.
Members also receive a weekly market letter with detailed analysis, commentary from our Chief Analyst, including actionable insights, trade timing, and direction forecasts for gold and silver.
Stay ahead of the market — join our premium community today.