Silver Nears Historic $50 Breakout After Forming Multi-Decade Cup-and-Handle
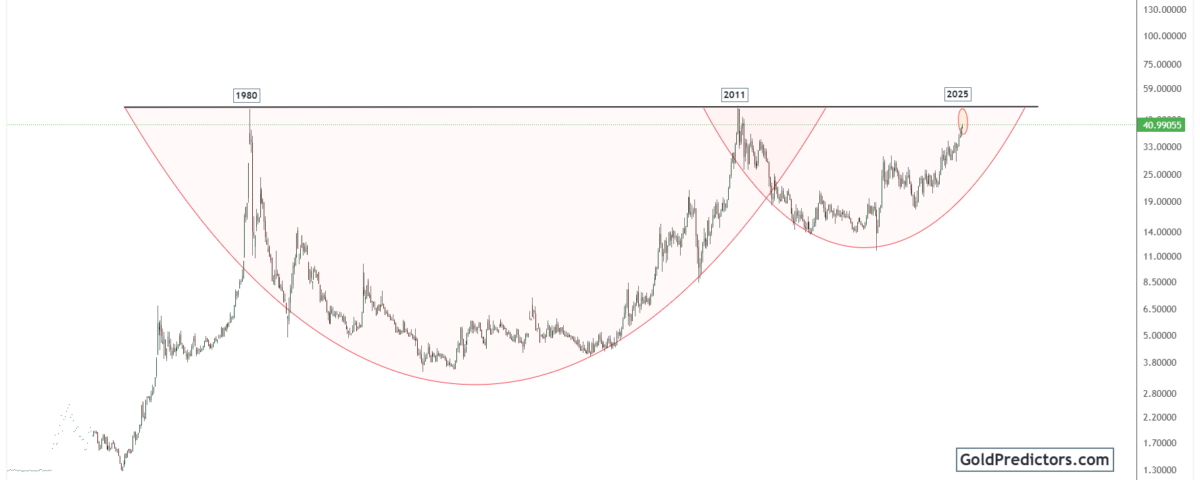
Silver (XAGUSD) is nearing a critical technical breakout after more than four decades of consolidation. Over this period, the metal has formed a massive cup-and-handle pattern that spans from 1980 to 2025, with price action now approaching the long-term $50 resistance level.
Moreover, the monthly chart reveals a triangle formation, defined by higher lows and a tightening range. This triangle structure confirms persistent buying pressure and adds strength to the bullish setup. Additionally, a rising parabolic base, expanding volume, and favorable macro conditions are now coming together to support a potential breakout.
Silver Forms Multi-Decade Cup and Handle Ahead of Key $50 Breakout Zone
The silver chart below shows a well-defined multi-decade cup-and-handle pattern that spans nearly four decades. Initially, silver reached the $50 region in 1980, then peaked again at the same level in 2011, and now trades just below that mark in 2025. The $50 resistance zone has served as a psychological and technical barrier for more than 40 years.

Between 1980 and the early 2000s, silver trended downward gradually, forming the left half of the cup structure. Subsequently, a sharp rally occurred, leading to a peak in 2011 and creating the right side of the curve. Following its 2011 peak, silver declined until 2015 before starting a gradual recovery that formed the handle of the pattern. Since then, silver has shown a persistent uptrend, with each pullback forming a higher low and reinforcing bullish momentum.
Notably, the setup gains significance as the current price action converges with the neckline of the cup, which marks a critical breakout zone. Price has now approached this resistance zone for a third time, after forming a clear parabolic base. Historically, such long-term formations often lead to strong upside moves when supported by volume and macroeconomic catalysts.
Silver Builds toward Breakout as Triangle Pattern Tightens Below Resistance
The silver chart below shows a well-formed triangle pattern developing on the monthly timeframe. Since 2018, silver has been steadily rising within this structure, marked by a series of higher lows along the lower trendline. Meanwhile, the upper boundary has consistently acted as resistance near the $43–$45 zone. A breakout above this range could signal continuation of the long-term uptrend.
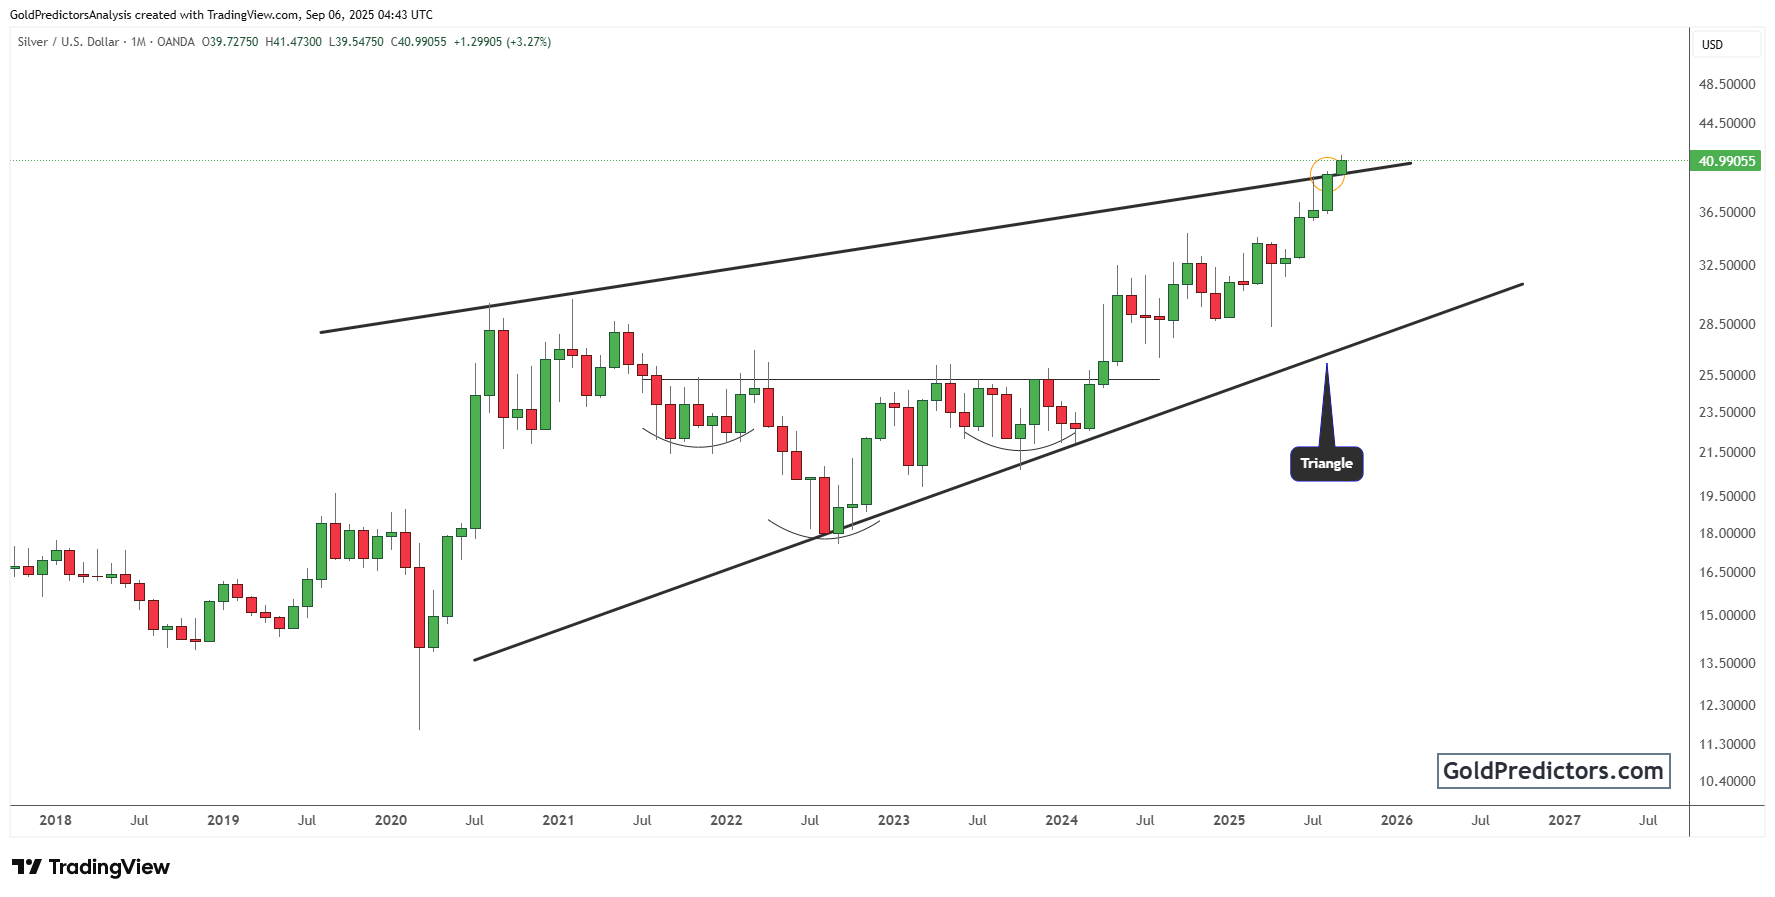
Moreover, the broader wedge features a head-and-shoulders pattern that consistently aligns with the prevailing upward trend. Silver’s most recent monthly close near $41 signals a fresh breakout attempt. However, Momentum is clearly gaining strength toward key resistance. A sustained close above this resistance would complete the ascending triangle breakout and indicate continuation of the broader uptrend.
In addition, the triangle formation reflects a period of consolidation, with price ranges compressing before a breakout attempt. The compressing structure indicates persistent buying pressure, showing that bulls remain in control despite resistance.
At the same time, trading volumes are showing signs of steady build-up, which strengthens the case for an eventual breakout. A confirmed breakout would push silver above its long-term resistance. Furthermore, it would likely encourage greater institutional involvement, thereby supporting the continuation of the uptrend.
Conclusion: Decades of Compression Set the Stage for Silver’s Next Bull Market
Silver is positioned for a historic breakout, with decades of price compression setting the stage for a new long-term direction. The multi-decade cup-and-handle formation points to a significant trend shift as silver is moving towards the neckline near $50. Silver has faced rejection in this zone for more than four decades. However, current price action shows higher lows, stronger momentum, and supportive macro conditions that suggest a breakout may be near.
Technically, silver’s price action is aligning with a massive cup-and-handle formation and a larger triangle, both of which amplify the bullish setup. In addition, silver has established a stronger technical base through repeated rejections since 2020. Now, with the price hovering around $41, another breakout attempt is unfolding. Moreover, volume expansion, narrowing consolidation, and a parabolic base formation suggest that bulls are preparing for a breakout. The longer silver holds near this zone, the more explosive the breakout potential becomes.
Ultimately, if silver breaks and holds above $50, the move could unleash a new secular bull market. Long-term resistance would likely become a new support base, encouraging renewed interest from major market participants. Such a breakout could open the door to much higher price targets, with technical projections pointing toward $70 and beyond. However, silver’s current technical structure presents one of the most compelling long-term opportunities in the precious metals sector.
Gold Predictors Premium Membership
Get exclusive short-term and swing trade ideas with precise entry levels, stop-loss, and target prices, including justification and analysis — all delivered directly via WhatsApp.
Our premium service includes deep technical analysis on gold and silver markets. We cover cycle analysis, price forecasting, and key timing levels.
Members also receive a weekly market letter with detailed analysis, commentary from our Chief Analyst, including actionable insights, trade timing, and direction forecasts for gold and silver.
Stay ahead of the market — join our premium community today.