


Silver Bullish Structure Points to Explosive Move Amid Gold Ratio Breakout
The precious metals market entered a dynamic phase in 2025. Silver is showing positive price action on the daily chart, supported by classic technical patterns. Meanwhile, the gold-to-silver ratio has surged following a breakout from a multi-year wedge pattern. These trends highlight an evolving opportunity for silver investors, especially as the metal approaches a critical resistance zone. This article discusses silver’s bullish setup using the daily chart and examines the breakout in the gold-to-silver ratio to understand the next move in silver prices.
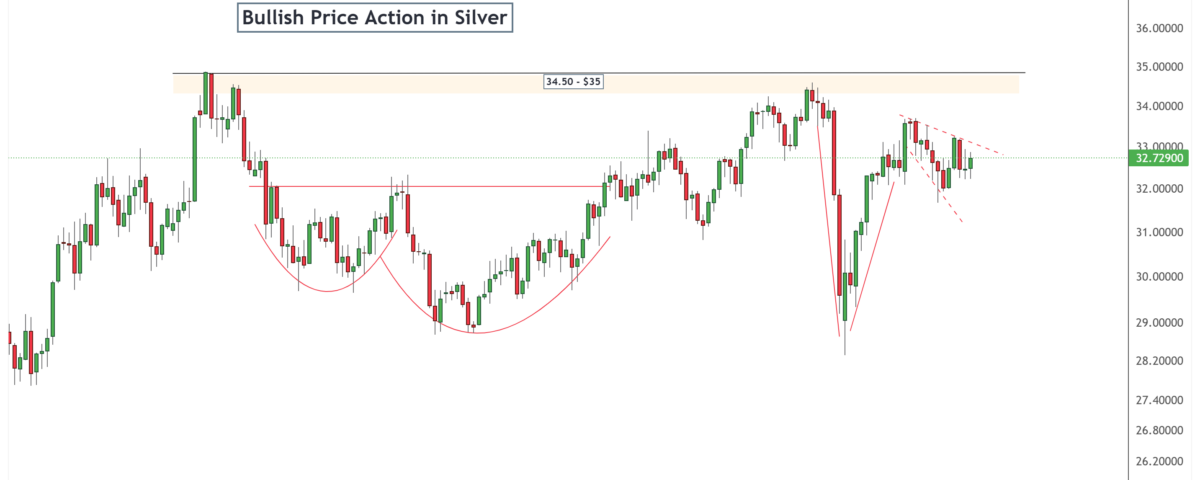
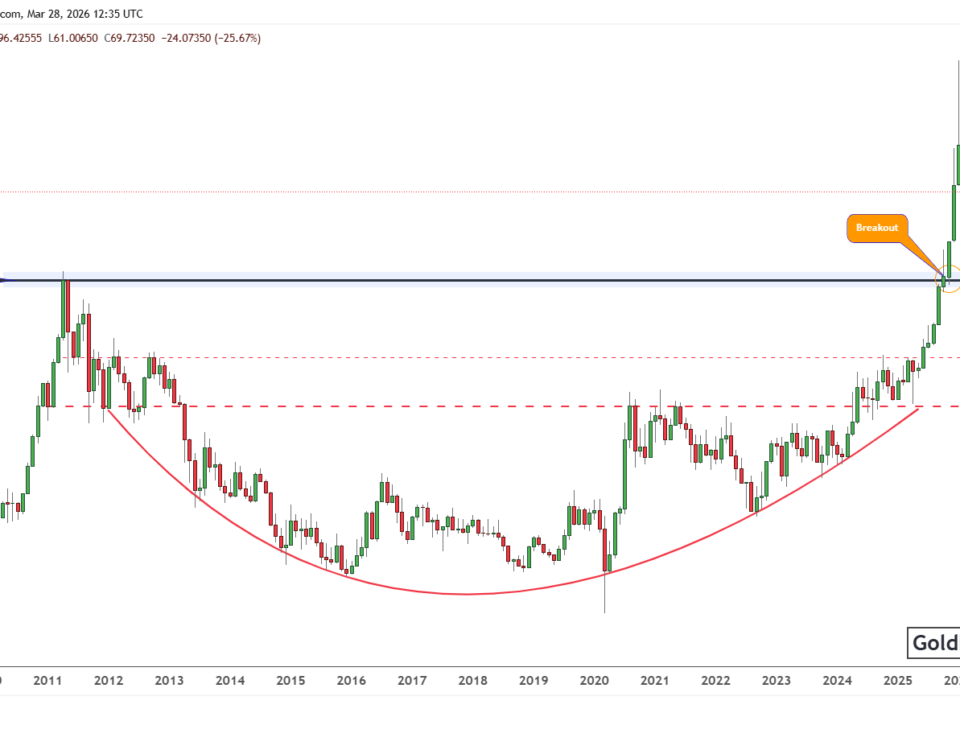
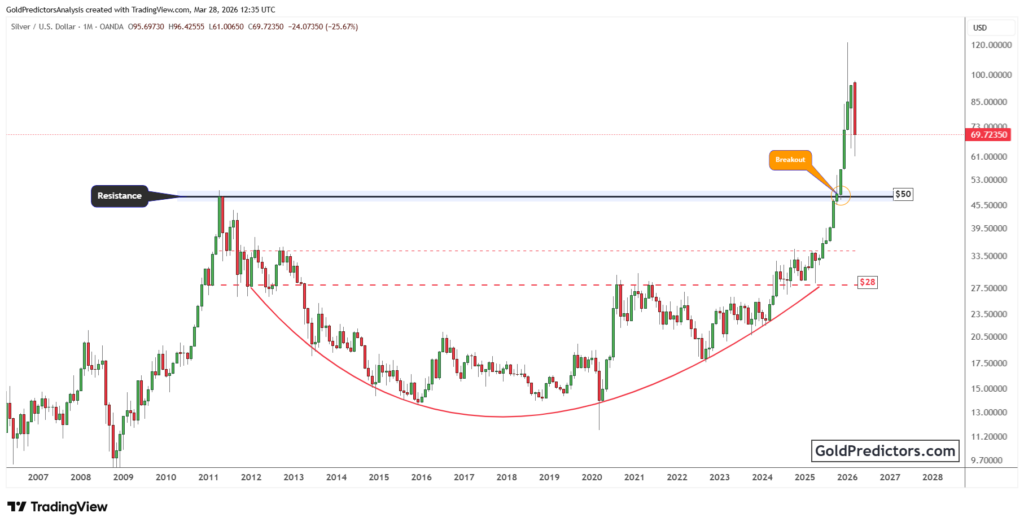
Bullish Cup and Handle Pattern Signals Potential Breakout above $35
The silver chart below shows clear signs of bullish momentum. A classic cup and handle pattern has formed on the daily time frame, which is often seen as a strong bullish continuation signal. This formation began taking shape in late 2024 and was completed by early 2025. The breakout from the handle portion of the pattern suggests that buyers are gaining control and driving prices higher. The multiple rounding bottom patterns in November 2024 and December 2024 indicate that the next move in silver is higher.

Currently, silver is trading around $32.73. It is approaching a major resistance zone between $34.50 and $35.00. This area has previously rejected price advances, but the recent strong rally and consolidative flag pattern suggest that a breakout is increasingly likely. The falling wedge within this consolidation is another bullish indicator. A breakout above this wedge pattern would validate the continuation of the upward move.
Moreover, volume analysis supports this bullish setup. The volume has increased on upward days, signalling strong buyer interest. The overall trend remains positive as silver continues to make higher lows. If silver can decisively break above the $35 level, it could trigger a new leg higher with potential targets near $38 and above.
Gold-to-Silver Ratio Breakout May Set Stage for Silver Surge
The chart below shows the weekly gold-to-silver ratio and provides essential context for precious metals investors. The long-term chart displays a broadening wedge pattern that lasted from mid-2020 through early 2025. This pattern has now broken to the upside, with the ratio moving sharply from 87 to 101.60, confirming a significant breakout.
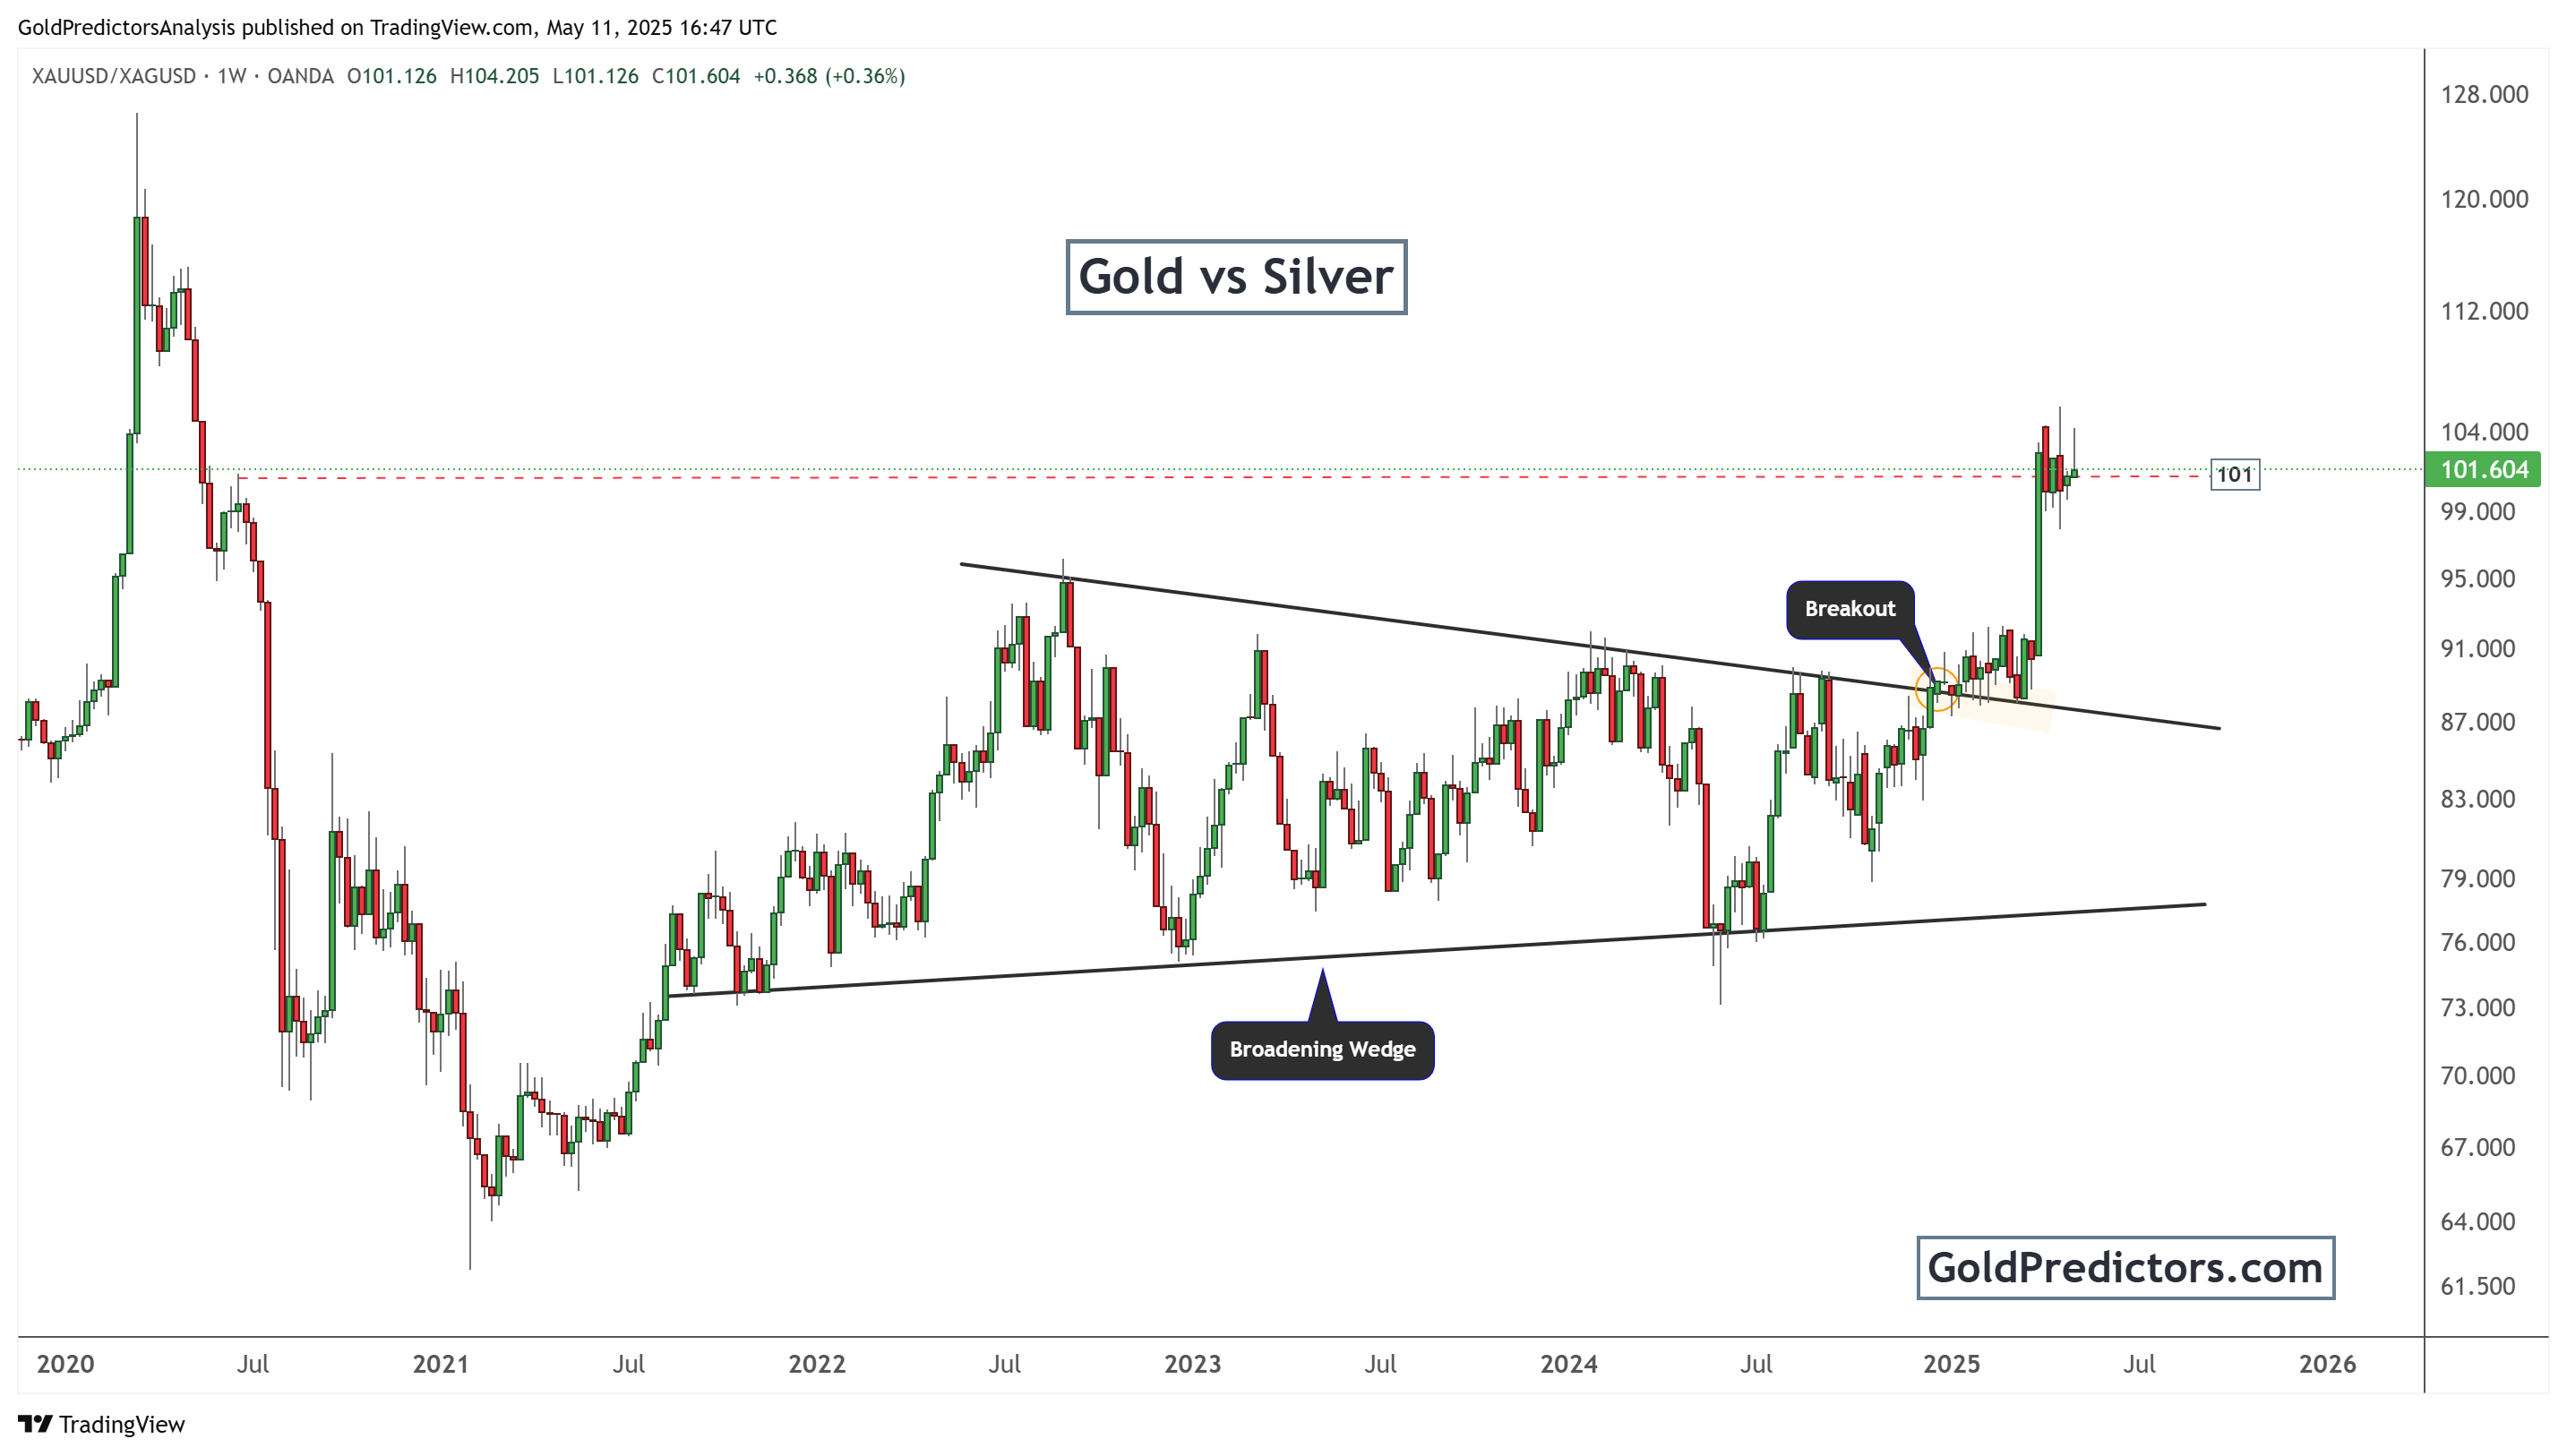
This move implies that gold has been outperforming silver in recent months. However, such a breakout often marks a short-term peak in the ratio. When the ratio reaches historically high levels, silver tends to play catch-up. This is especially relevant given silver’s bullish technical setup on the daily chart.
Investors should also note that the breakout in the gold-to-silver ratio comes after a long period of sideways consolidation. This structural shift may signal increased volatility and movement across both metals. However, since silver remains undervalued relative to gold on a historical basis, the recent ratio surge could soon reverse or stabilise, giving silver room to outperform.
This macro perspective aligns with the price action seen on the silver chart. Silver’s bullish momentum, combined with a potential overextension in the gold-to-silver ratio, creates a favorable environment for silver bulls.
Conclusion: Silver Bull Market Poised to Accelerate in 2025
The technical evidence from both charts supports a strong bullish thesis for silver in 2025. The daily silver chart shows a textbook bullish complex cup and handle formation with a possible breakout above the $35 resistance zone. This level is crucial. A clean break above it would open the door to significant gains.
At the same time, the gold-to-silver ratio has broken out of a broadening wedge to the upside. While this indicates recent gold strength, it also sets the stage for a silver resurgence. Historically, such extreme ratio levels tend to normalise, and silver could benefit from this rebalancing.
Traders and investors should monitor the $34.50 to $35.00 resistance closely. A confirmed breakout above this zone, supported by volume and momentum, would confirm a major bullish continuation. Given the technical and macro backdrop, silver remains one of the most promising assets in the precious metals space for 2025.
Gold Predictors Premium Membership
Get exclusive short-term and swing trade ideas with precise entry levels, stop-loss, and target prices, including justification and analysis — all delivered directly via WhatsApp.
Our premium service includes deep technical analysis on gold and silver markets. We cover cycle analysis, price forecasting, and key timing levels.
Members also receive a weekly market letter with detailed analysis, commentary from our Chief Analyst, including actionable insights, trade timing, and direction forecasts for gold and silver.
Stay ahead of the market — join our premium community today.