


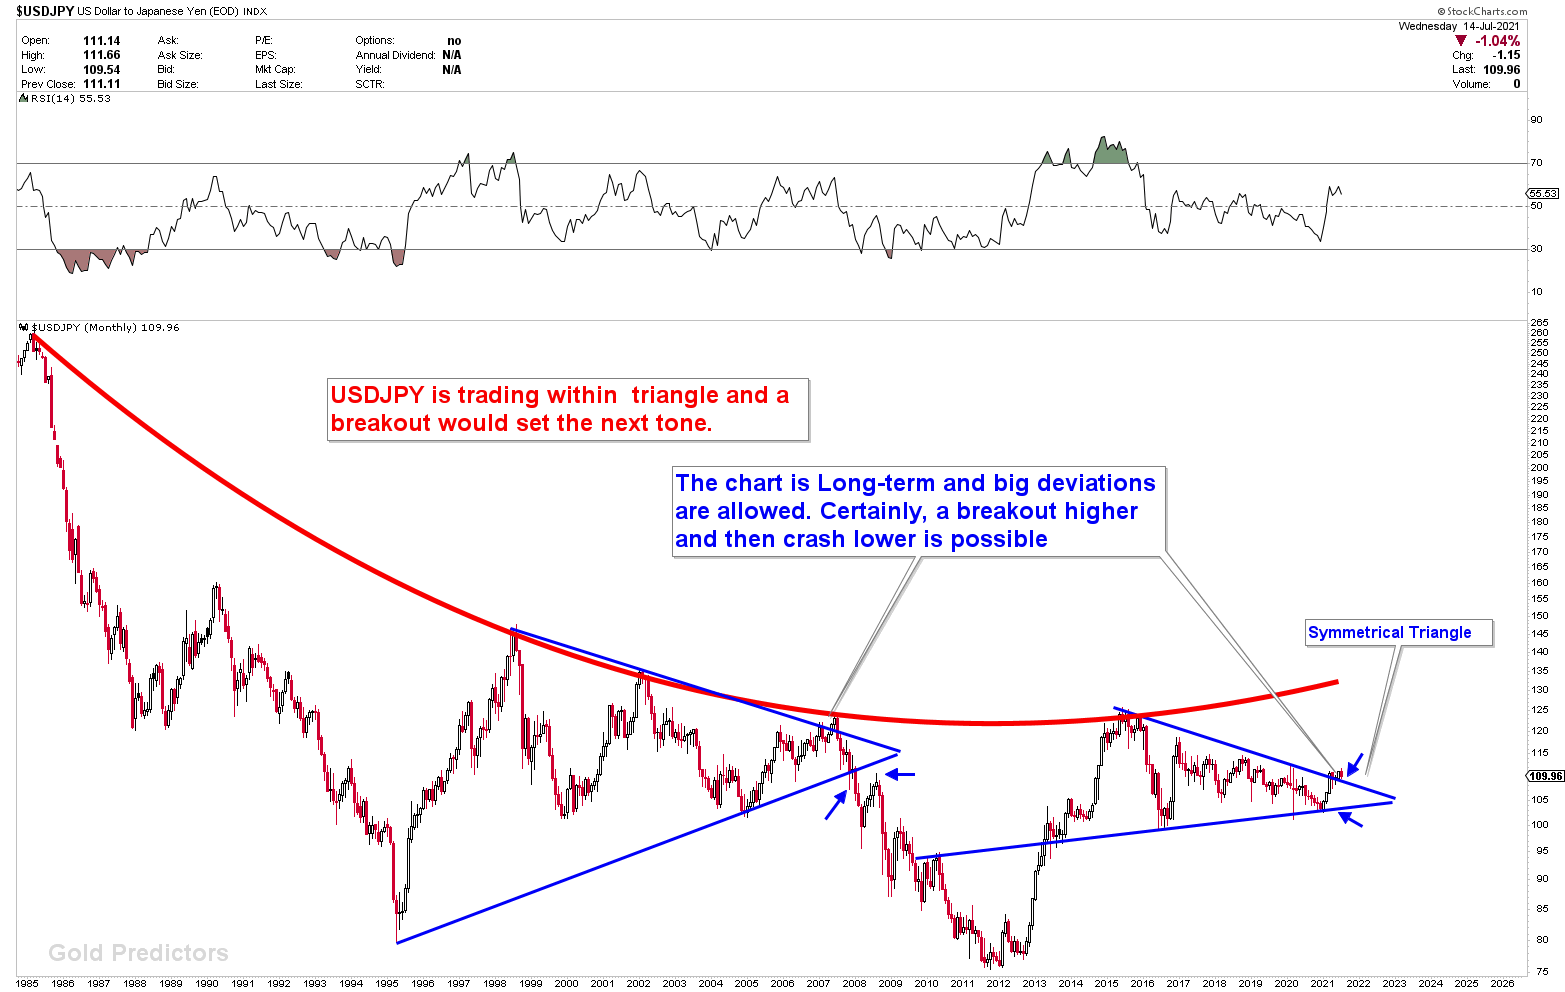
Japanese Yen at the Inflection
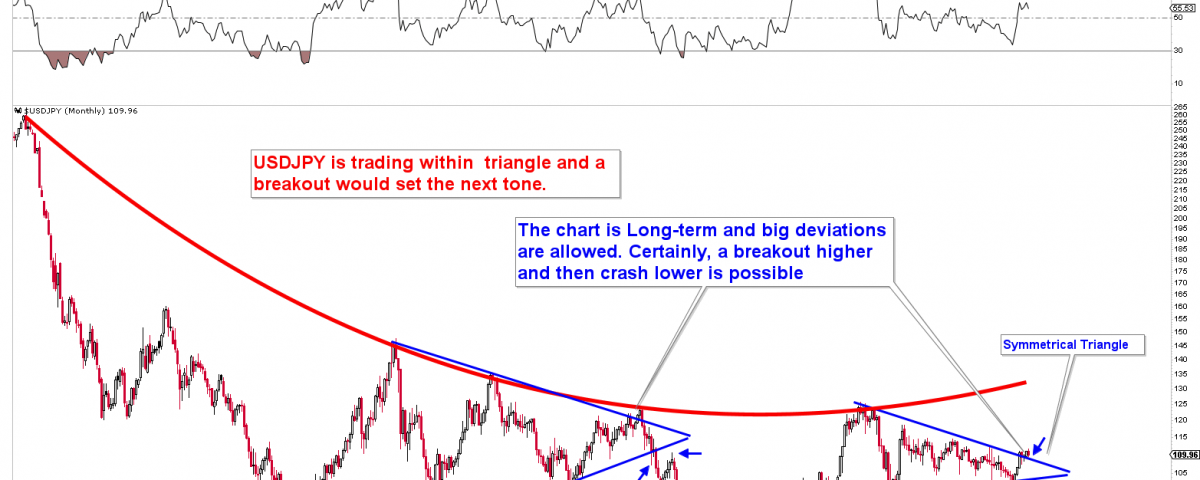
For the past three months, Japanese yen pairs have been trading at an inflection point. The monthly chart of the USDJPY is shown below. Bull and bear traps are very common in forex markets, and prices are likely to produce fake breakouts before the actual move. When the USDJPY produced a fake breakout in the 2007-2008 timeframe, a similar triangle was observed. The same patterns are forming, and all Japanese yen pairs are trading at a critical juncture where a drop could occur. This is known as an inflection point, and a breakout will send prices higher.
Weakest Currency: NZD
Strongest Currency: CAD, GBP
Best Instruments to Focus:
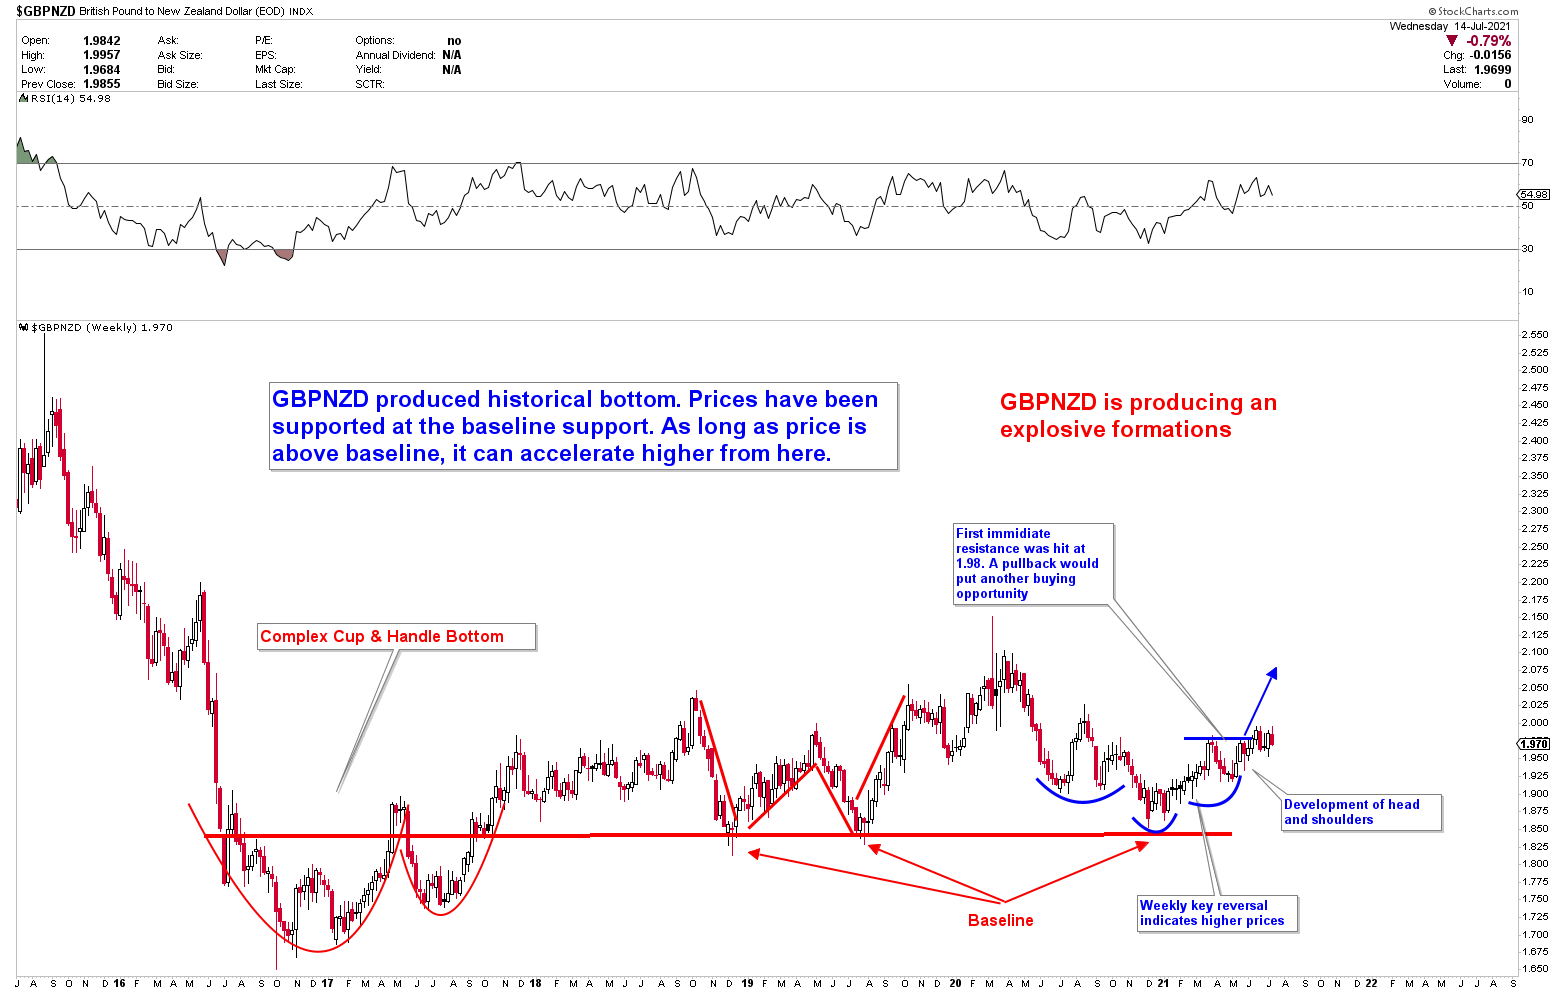
Long GBPNZD
Short NZDCAD
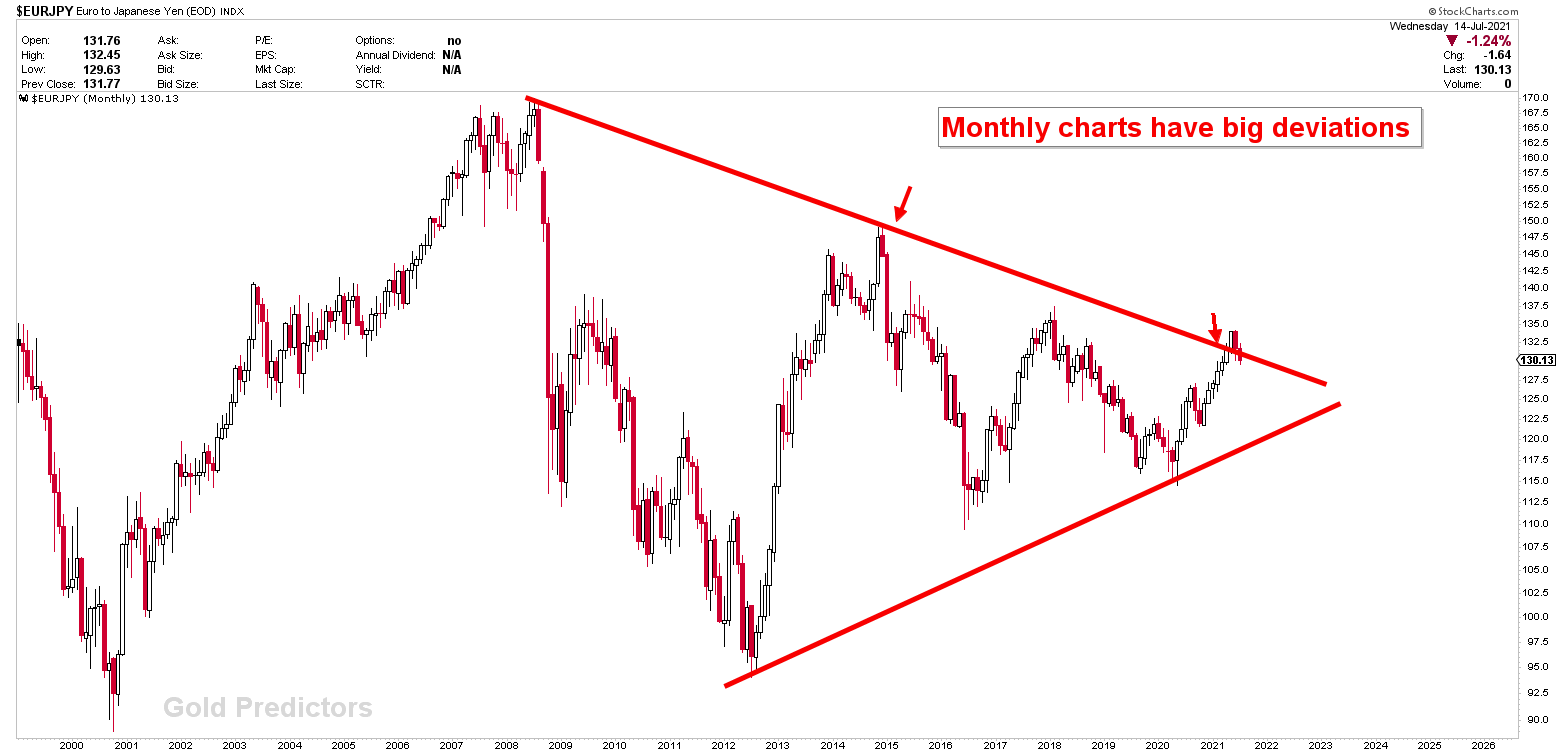
The importance of the Japanese yen inflection can be seen more clearly when compared to the Euro. The pair is returning to the triangle after a move higher last month. We haven’t declared a breakout yet because the patterns on monthly charts indicate that prices will breakout first, then crash lower.
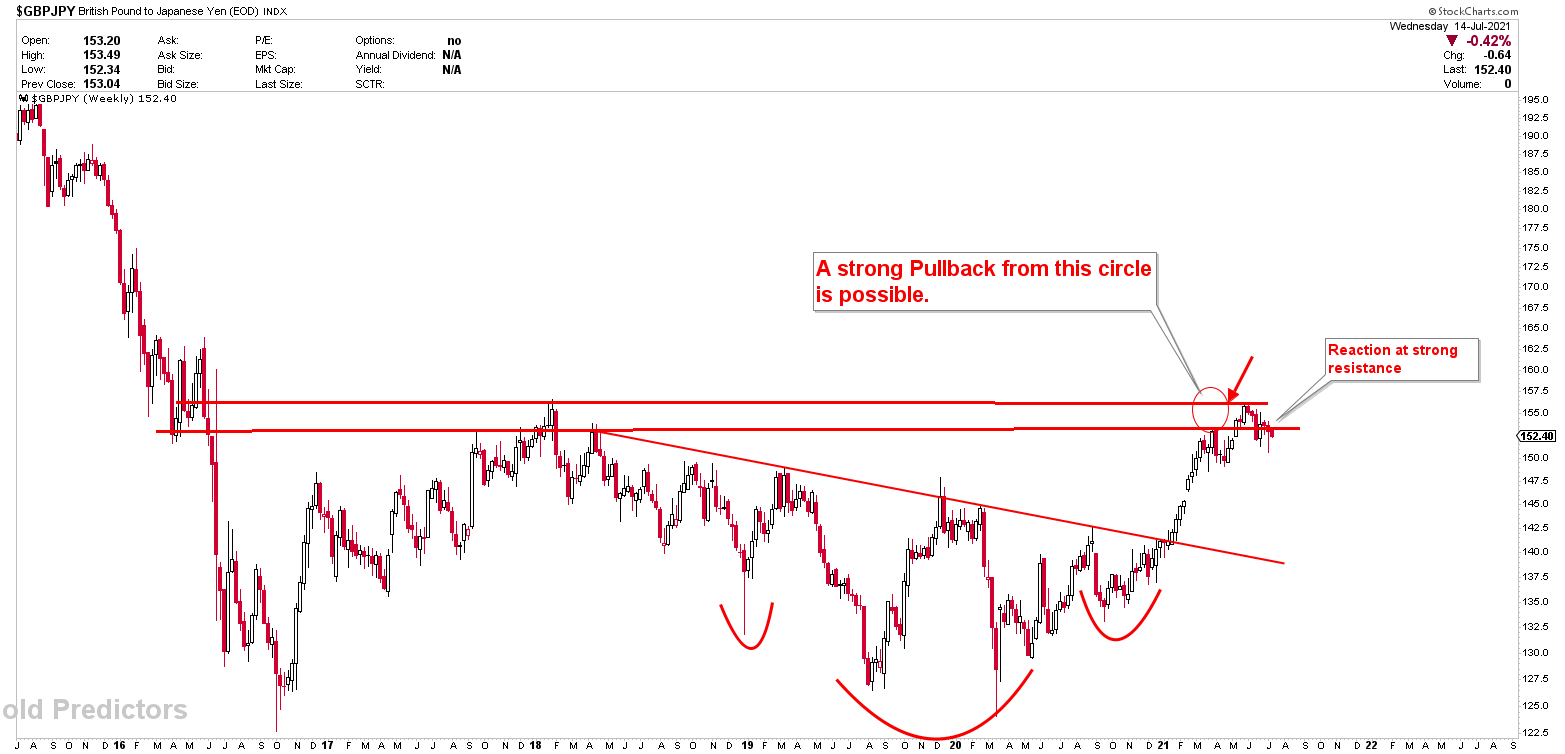
The GBPJPY outlook is depicted in the chart below. The analysis was first presented with a circle in March 2021. For the past three months, the price has been trading within the circle, and it is now pulling back to fall lower. A pullback must be treated as a buying opportunity because the bottom was formed with strong bullish patterns. Traders will only look to sell since the drop in the pair might be deep. On other hands, any breakout here will shift the market higher.
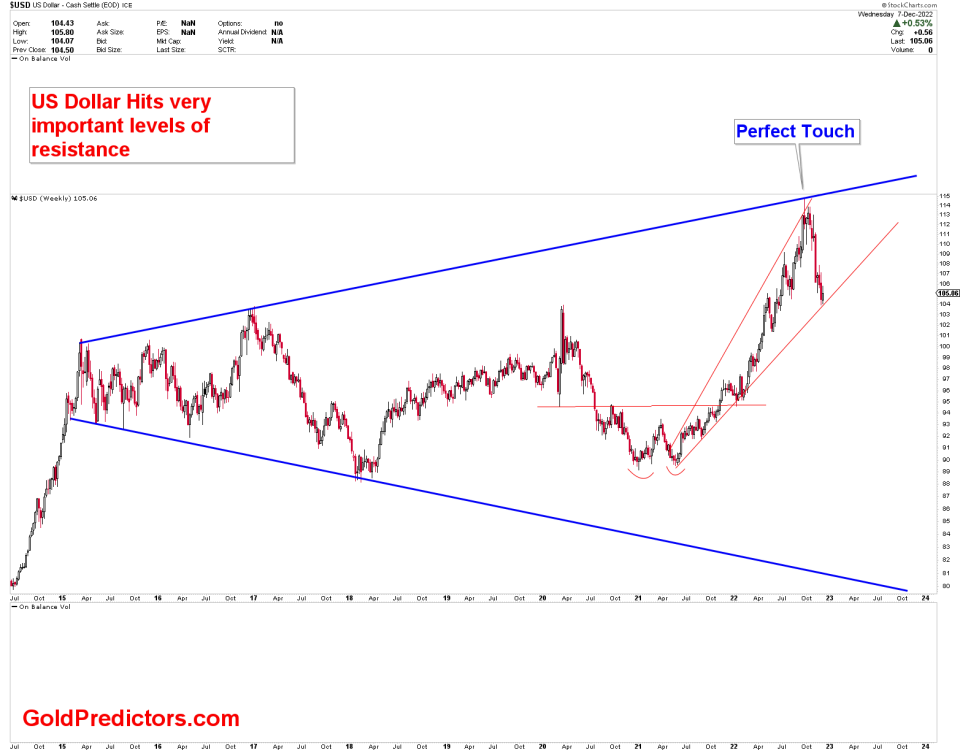
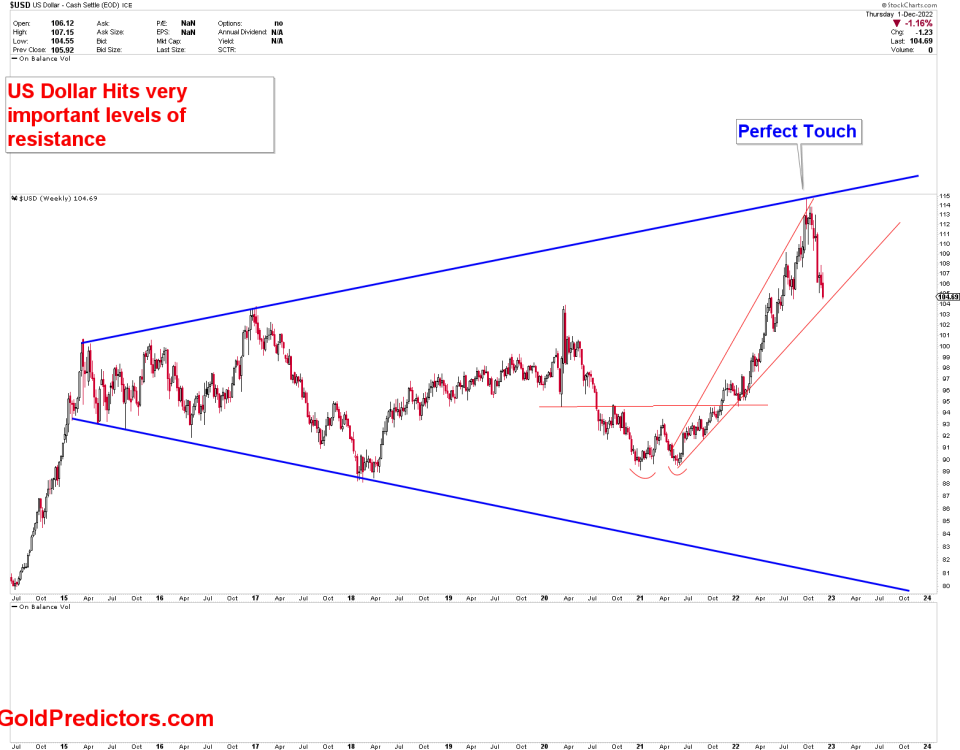
US dollar Markets
The US dollar spent a week at the previous week’s resistance line. The US dollar is under tremendous pressure and might certainly crash lower sooner than later. The current bounce, however, has resulted in a range of 89-94. The US dollar index is likely to fall once this sideways range ends.
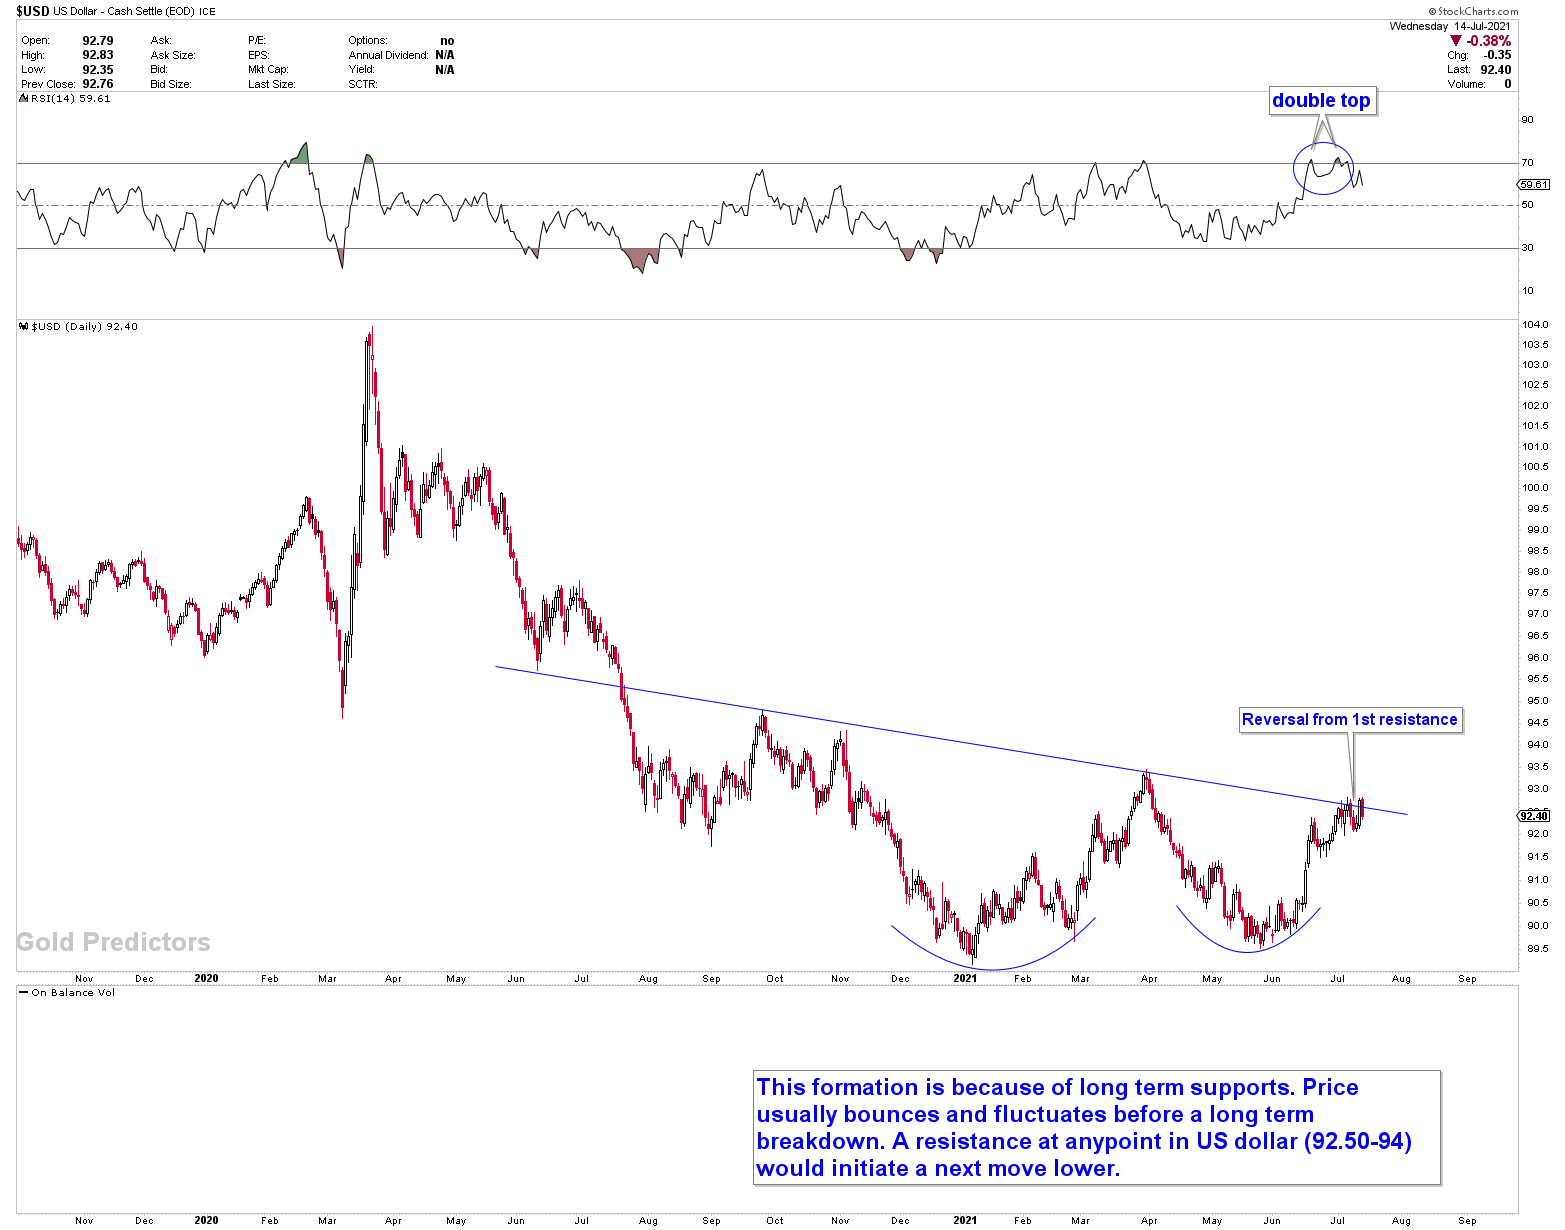
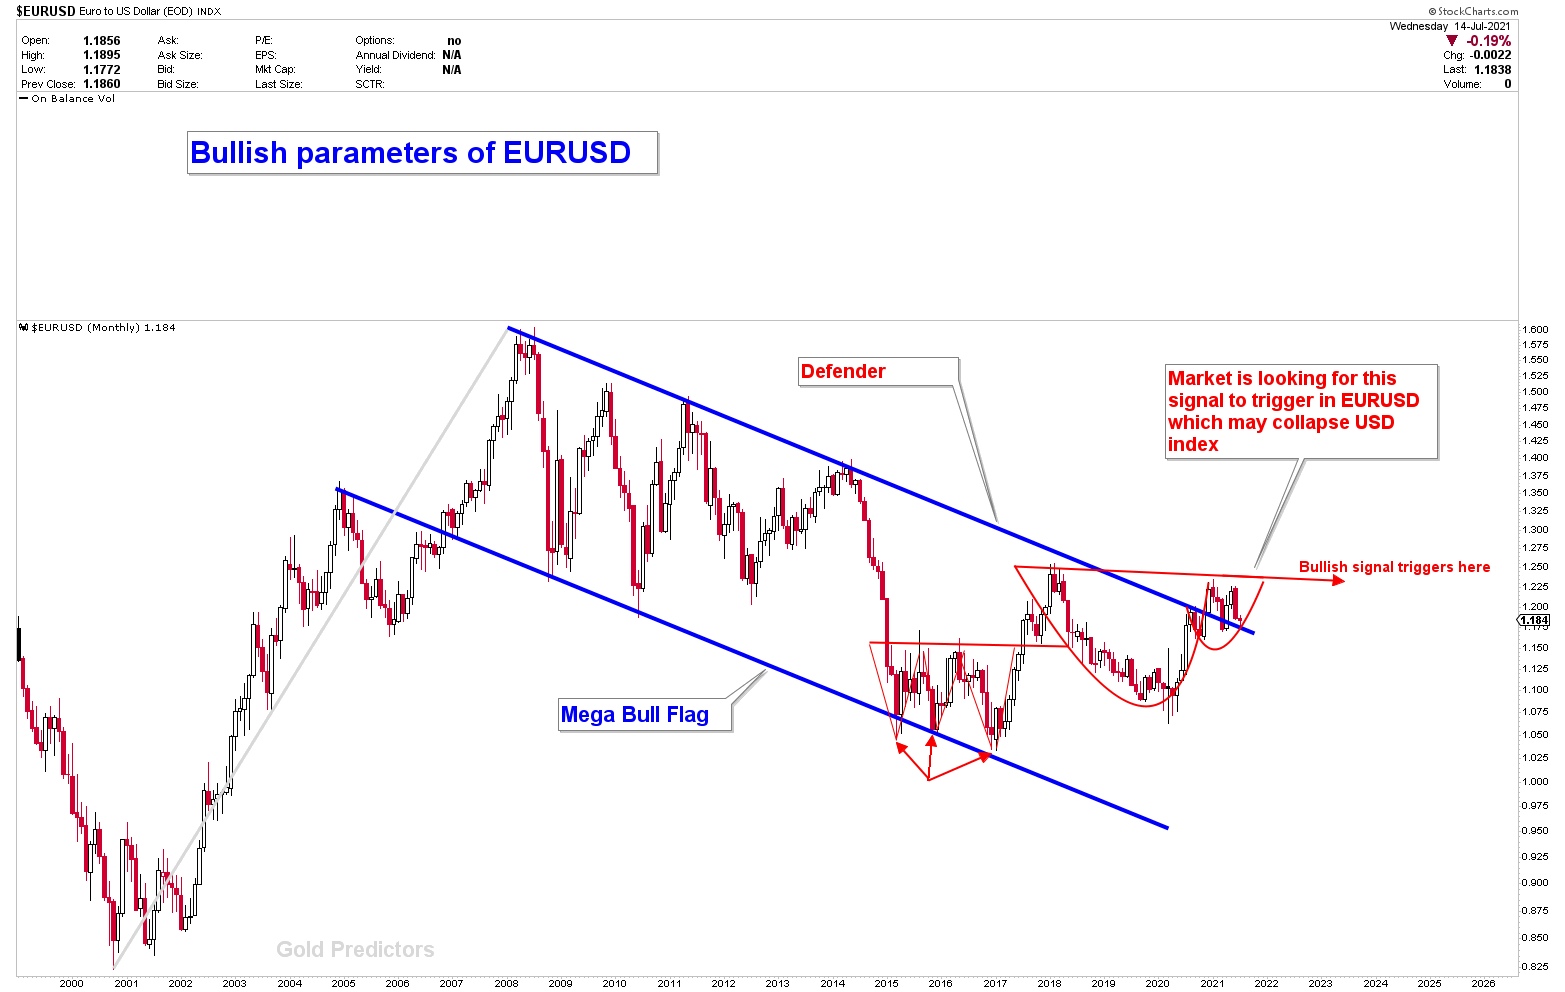
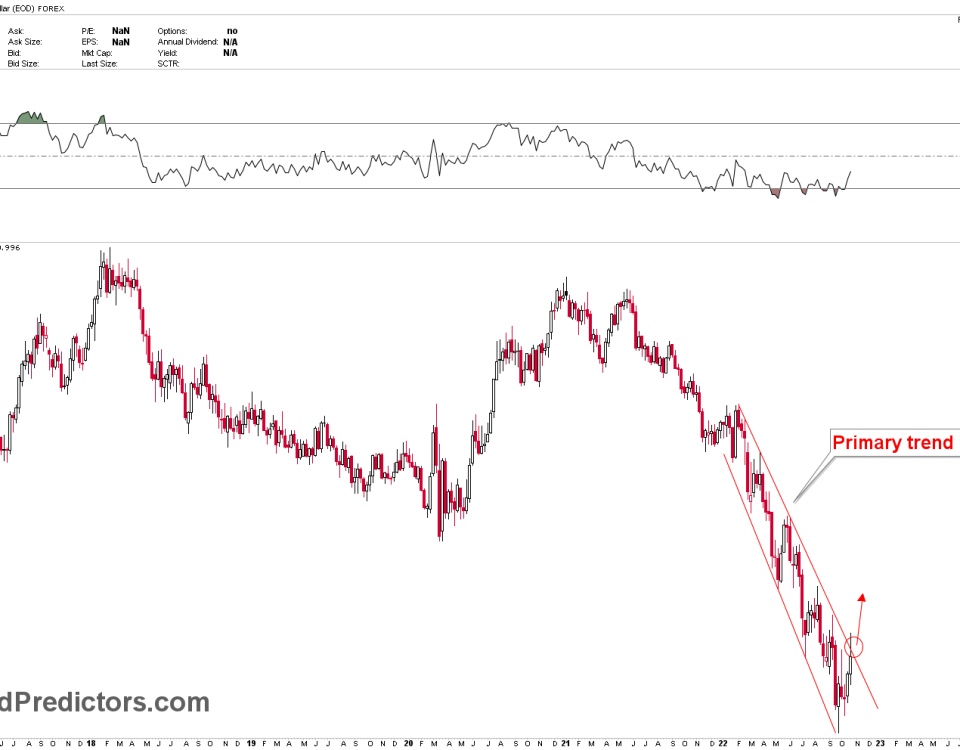
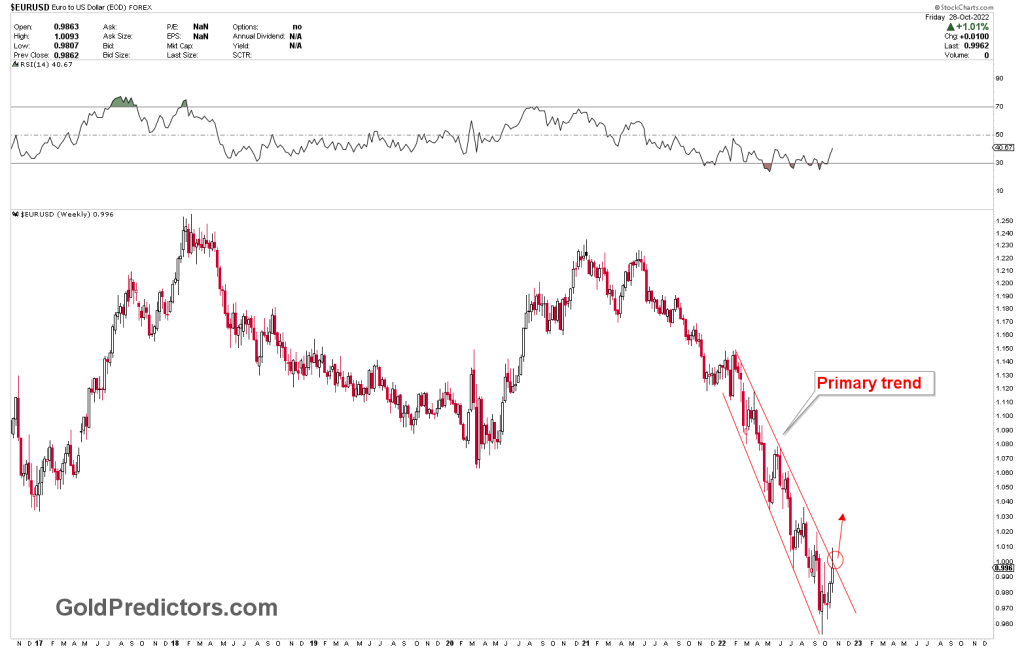
Since the EURUSD is inversely proportional to the US dollar index, when the US dollar collapses, the EURUSD . The evolution of patterns in the EURUSD reveals a significant bullish trend in the instrument. The breakout of a bullish flag with a triple bottom indicates that the EURUSD must go higher.
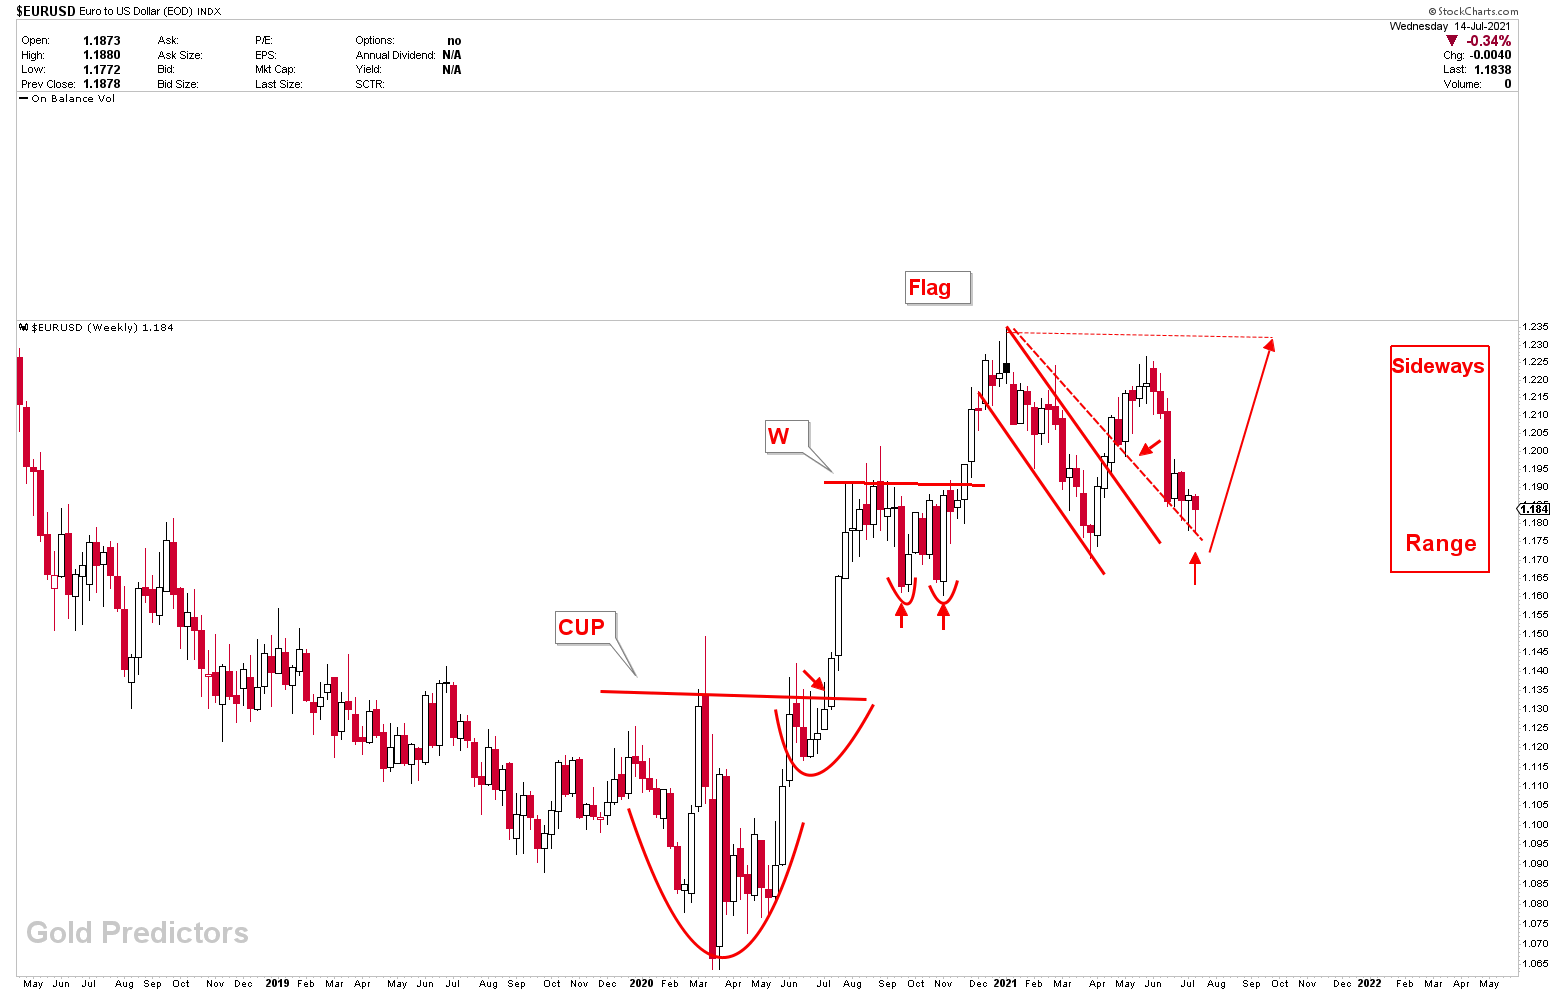
Looking at the weekly chart of the EURUSD, it appears that the pair has been testing the dotted line for the past five weeks. Each test is followed by a sharp bounce, indicating that the price will most likely reverse from this area.
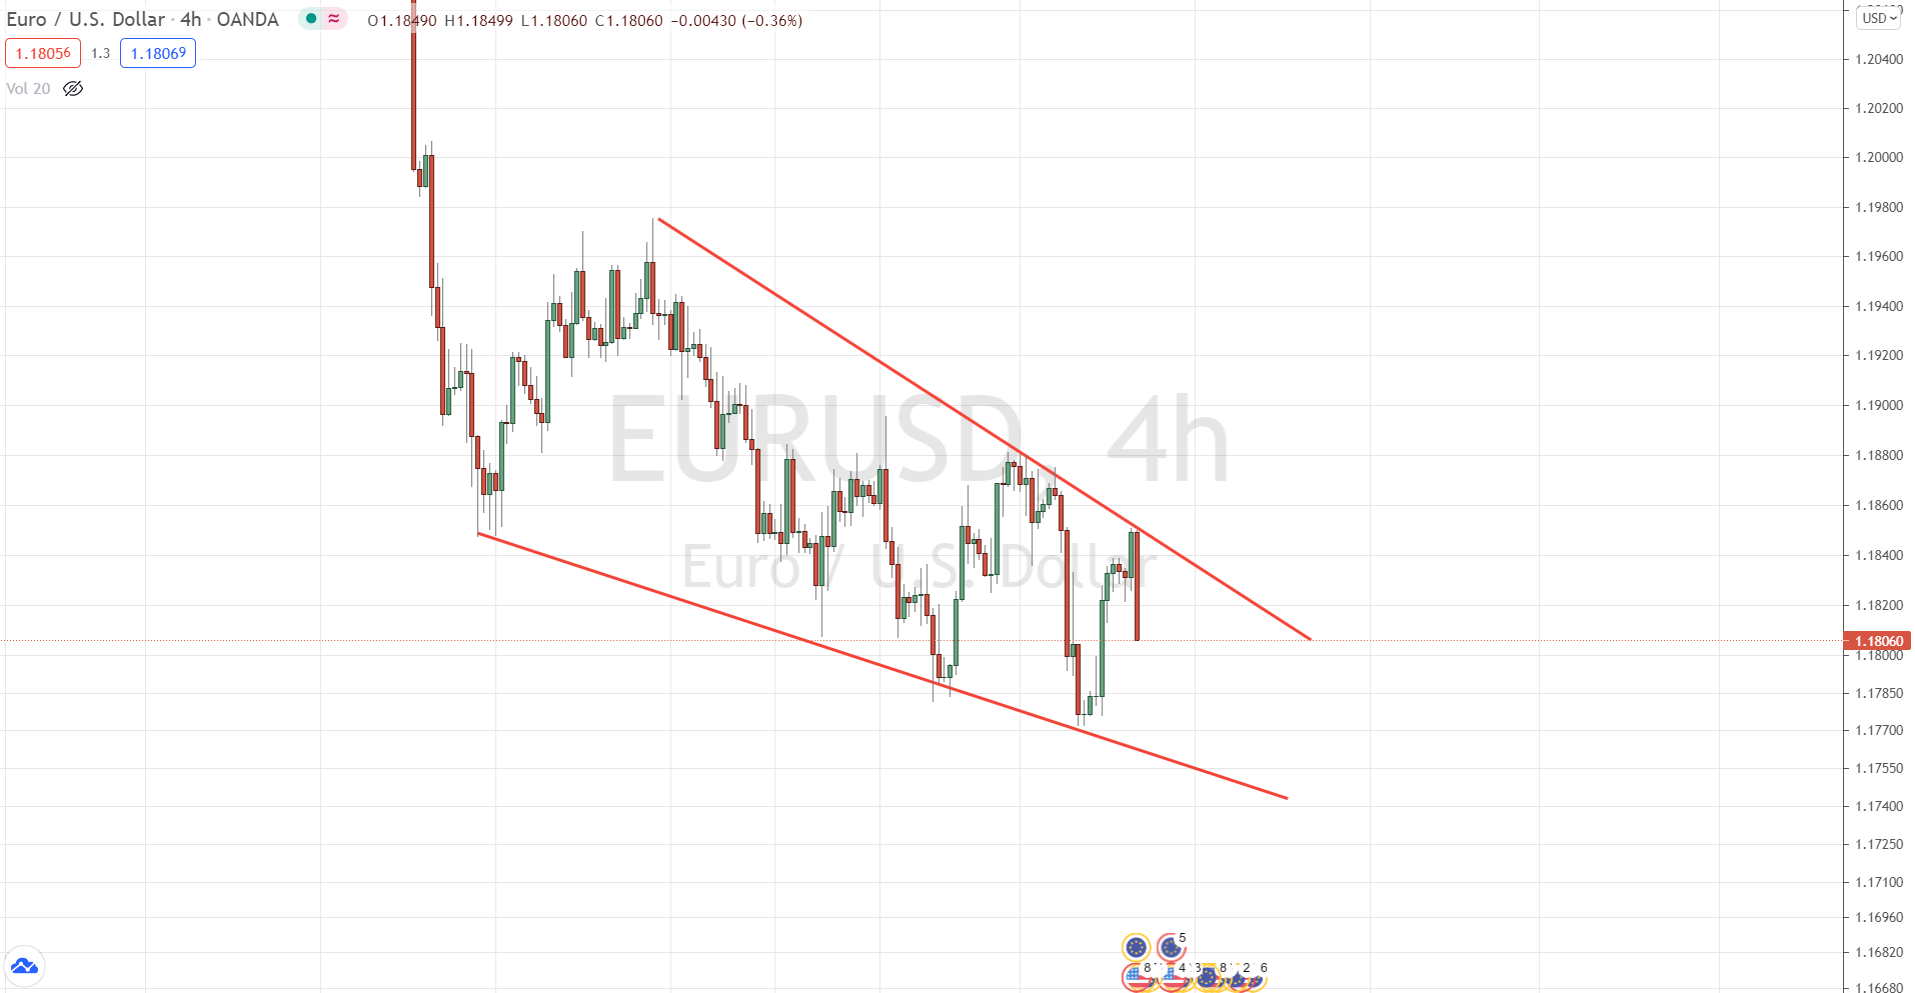
When viewing the EURUSD chart on a four-hour scale, it appears that the price is compressing at a lower angle of support, which is a positive sign for the instrument. A breakout below the falling wedge, on the other hand, indicates that the pair will continue to fall further on short term.
Since this is a pure price pattern, we are sticking to our GBPNZD forecast.
Since four months, we’ve been using the same chart to illustrate the bullish outlook in this pair. GBPNZD is expected to increase thousands of pips as long as the baseline support holds. It has already gained 1000 pips from our forecast, but it still have another 1000 pips to go. Every pullback should be regarded as a buy signal in the pair.
Signup for GoldPredictors