


US dollar Index Bearish View
We’ve been discussing the possibility of the US dollar index churning in the 89-93 range. The US dollar index goes up to 93 levels of resistance, but the bearish outlook for the US dollar index remains unchanged. The outlook is still very bearish, and we expect it to fall in the near future. Today, the US dollar index bearish view is illustrated using few of the correlated markets.
Highlights
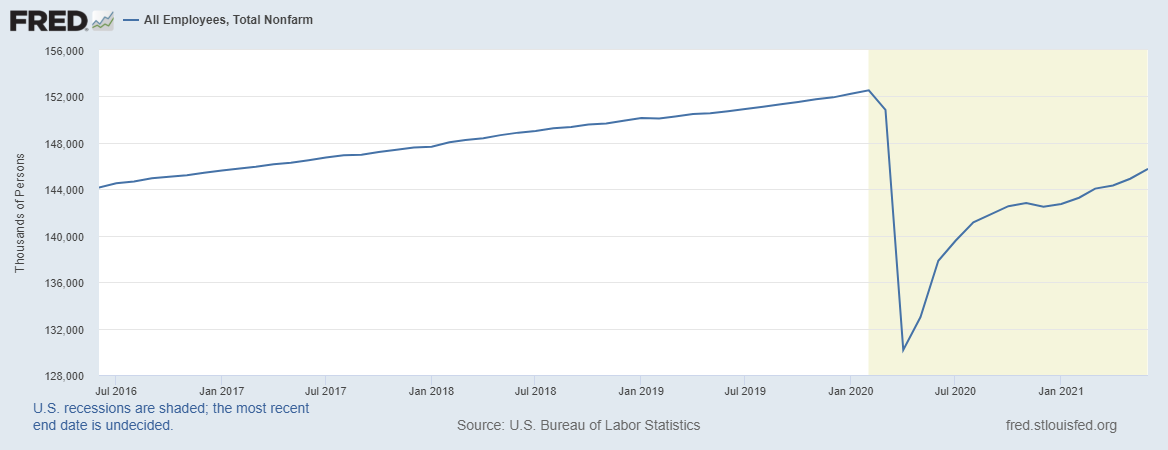
The chart below presents the total nonfarm in terms of thousands of person. Although June payrolls increased by 850,000 over the previous month, there is still a 6.7 million job shortfall when compared to the pre-pandemic peak of February 2020. Many businesses are having difficulty filling positions as increased unemployment benefits, and pandemic safety concerns prevent workers from returning to work. With estimated total weekly hours worked down by 3.6%, some of the shortfall is made up by increased average hours per employee. Despite the lag in hours worked, GDP is expected to exceed its 2019 peak of $19.3 trillion in Q3 of 2021, implying increased productivity. The bond market appears to be pleased with the June labour report, with 10-year Treasury yields falling sharply, which indicates US dollar weakness.
Weakest Currency: NZD
Strongest Currency: CAD, GBP
Best Instruments to Focus:
Long GBPNZD
Short NZDCAD
USD correlated pairs might be risky for the current week
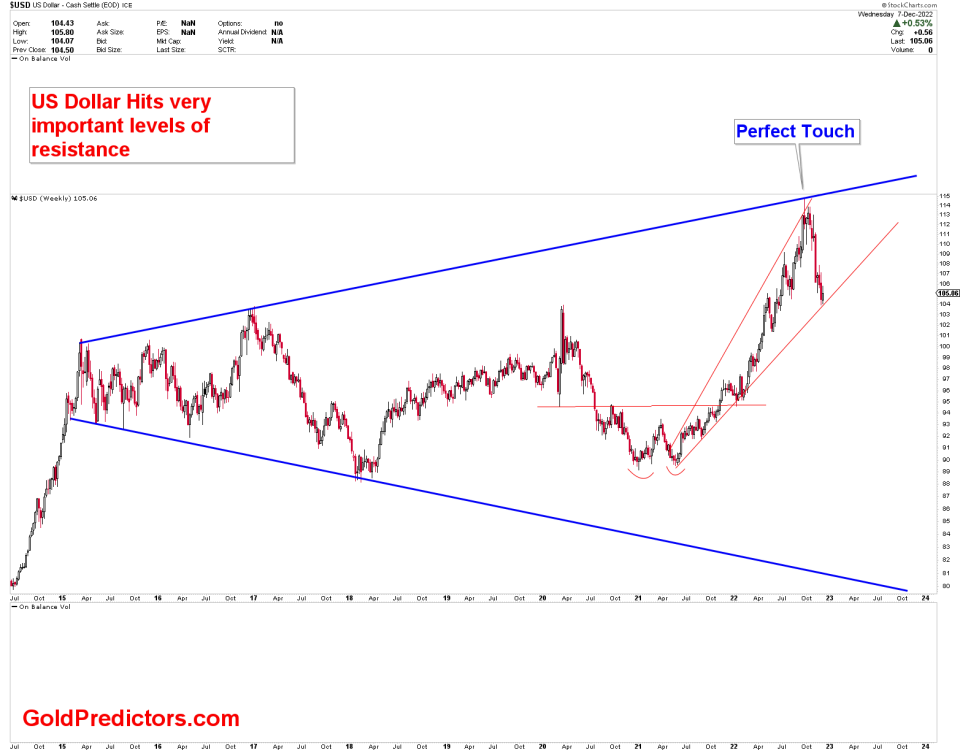
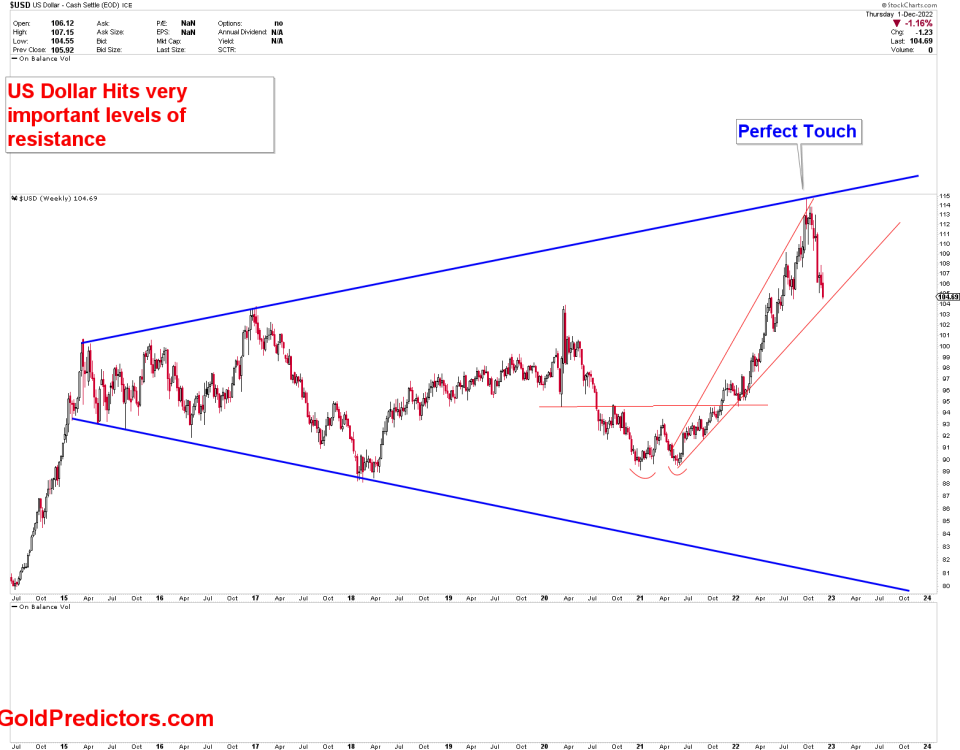
US Dollar Index Technical Outlook
The monthly chart of the US dollar index illustrates the importance of the trading zone. The chart was created a few months ago and is currently playing out perfectly. We clearly stated when the US dollar index was trading at 89-90 levels regarding that possibility of the US dollar index shacking. As per our expectations, the US dollar has risen from value of 89 to 92.50 within a few days.
USD Index Monthly Outlook
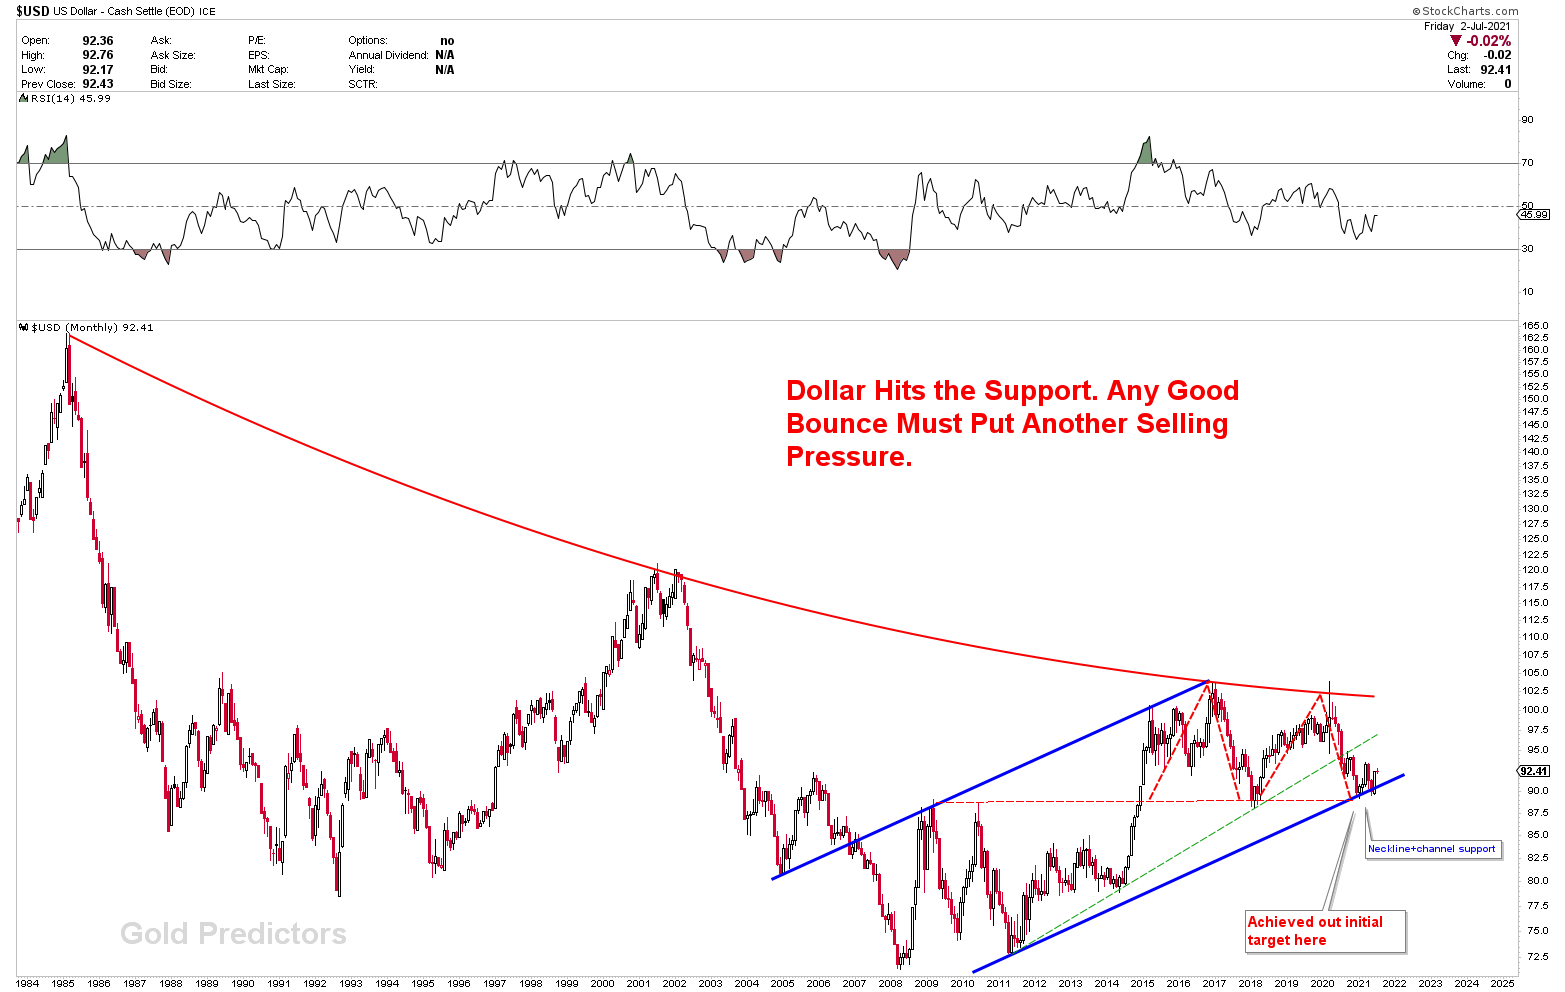
The long-term monthly chart is developed by drawing a falling curve from 1985’s peak to 2020’s peak. By the start of the Covid-19 crisis in February 2020, we had clearly stated how the value of US dollar would depreciate. The price has clearly depreciated from its peak of 102 to 89.
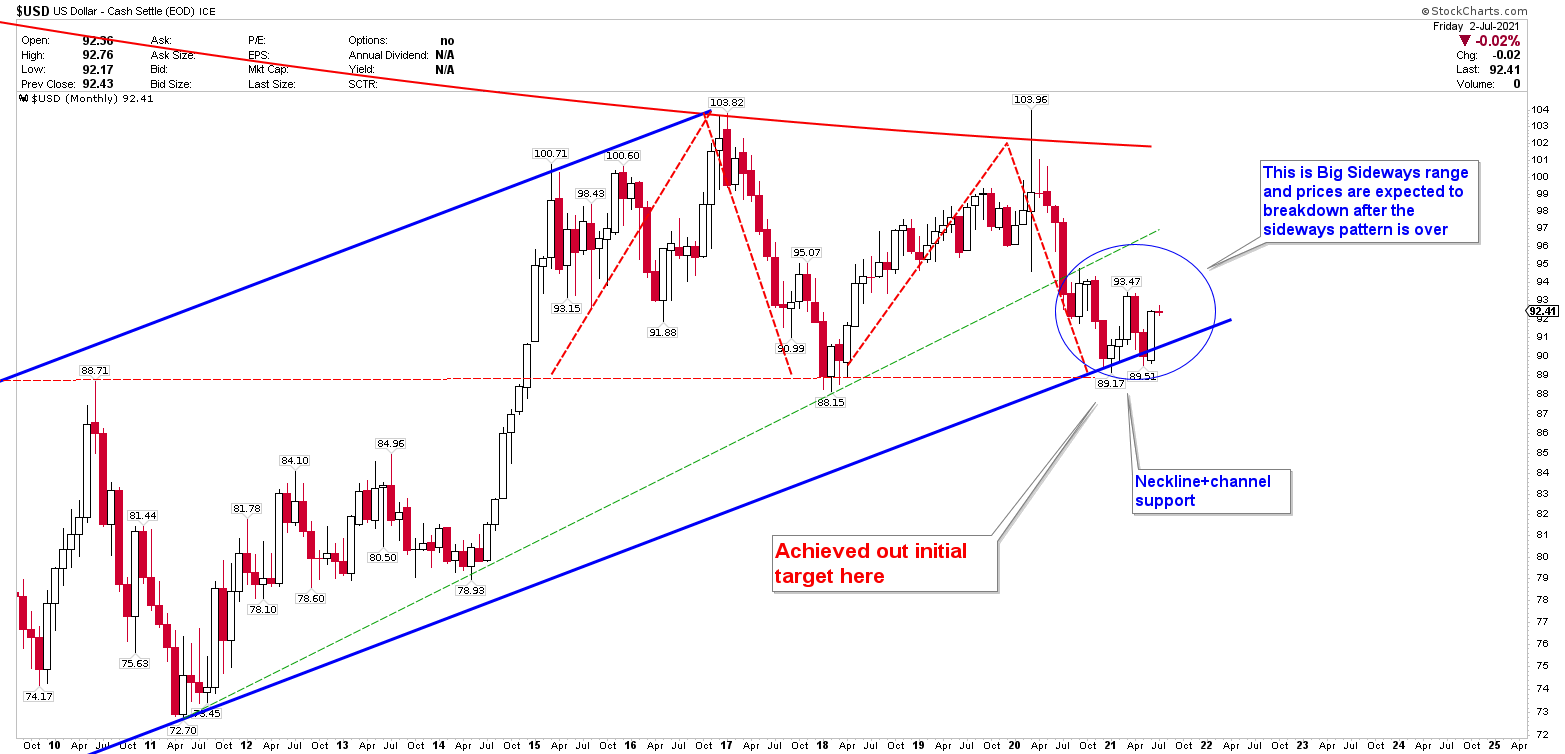
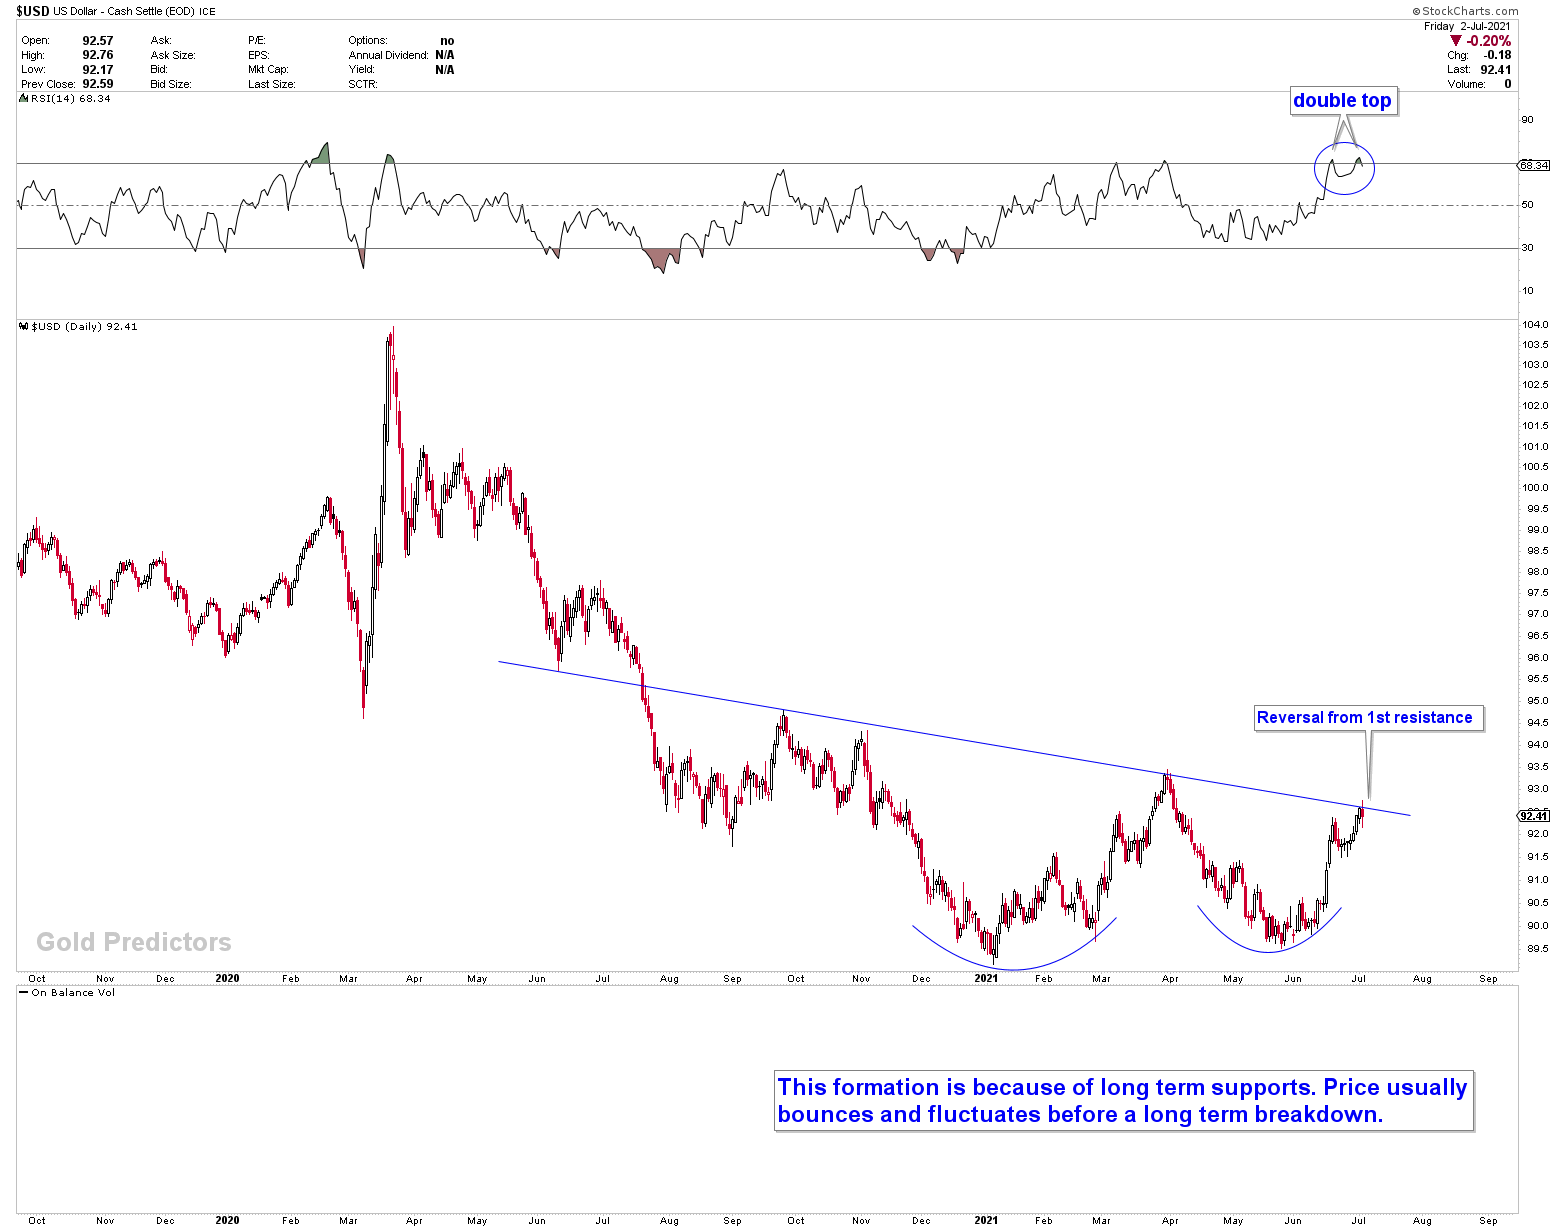
On the other hand, the drop of the US dollar index produced a M type bearish structure. This structure is a strongly bearish pattern. The first target of 89 was expected to be set at the lower angle of blue channel support. The necklines of M type patterns collide with the horizontal support at the same line. Since this support is mixed in with other levels of support, it is referred to as a major support juncture. We believe this juncture will be broken soon, and the dollar will eventually crash. However, pumping at these levels is possible for a slightly longer period. This pumping has produced a sideways range in the region of 89-93.
Let’s take a closer look at the monthly chart to see how important this area is. The US dollar index is shown with a blue circle indicating a possible sideways range, but we expect the primary direction of the US dollar index to remain downward.
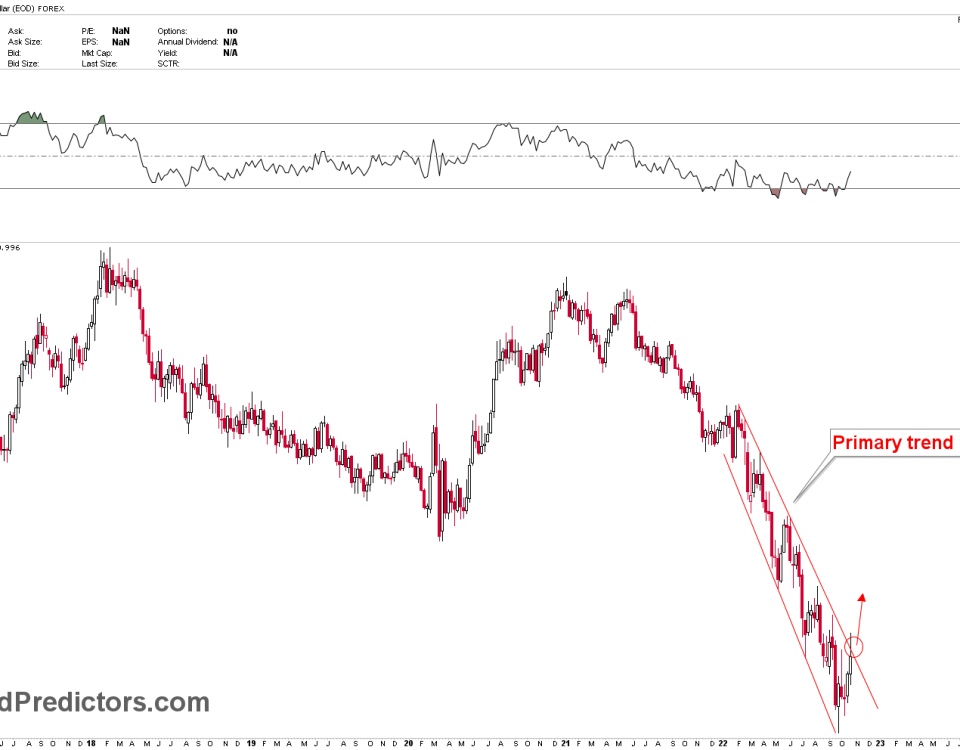
US Dollar Index Daily Chart
On daily charts, the current bounce in the US dollar index shows a clear double bottom. The real value of this double is zero. On daily charts, the US dollar index hit the first resistance at the blue trend line. This touch on blue line triggered a sharp reversal on Friday. In the short term, the US dollar value is likely to fall back towards 90. Since the US dollar index must decline, the patterns will remain choppy. This is because of the long term support juncture. The primary trend in US dollar index is likely to remain downward.
Let’s take a look at a few instruments that are correlated to the US dollar.
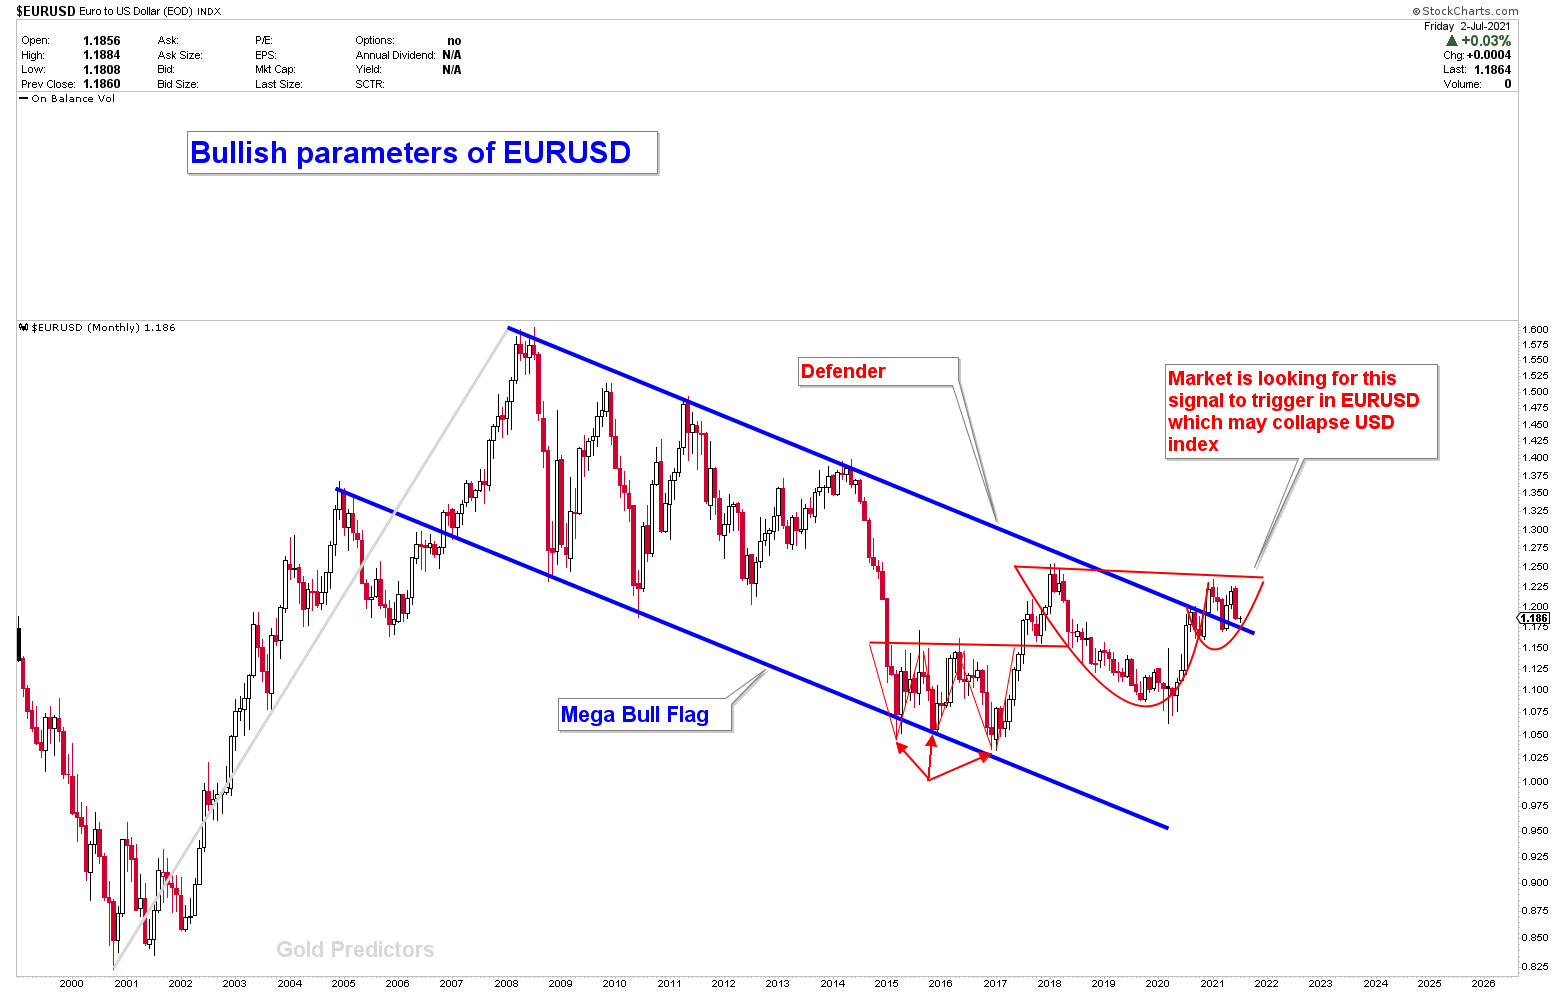
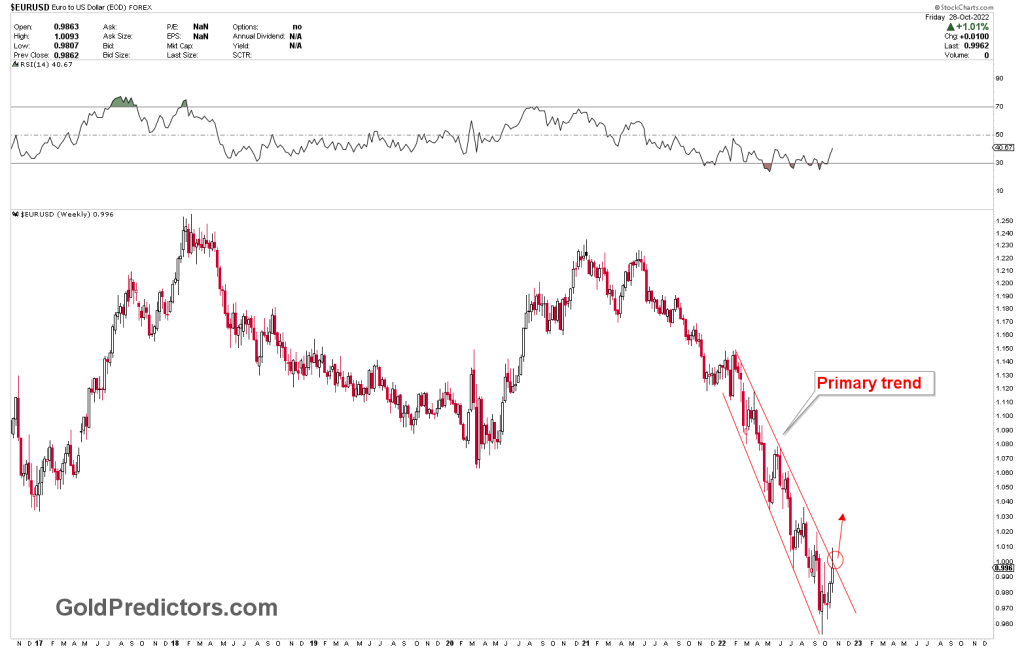
EURUSD Bullish Structure
The EURUSD is an inversely proportional instrument to the US dollar index. As the US dollar index develops strong bearish patterns, the EURUSD develops strong bullish patterns, as shown in the chart below. EURUSD formed a mega flag, and a breakout indicates that EURUSD will move higher in the near future. EURUSD is expected to break 2017-2018 highs, once the USD dollar index breaks the value of 89. The type of bottom formed at the lower angle of the bull flag is also supported on a broader scale.
The formation of a triple bottom at the bottom may encourage prices to rise in the near future. A type of CUP that is developing a handle to shoot higher, helped the triple bottom to become stronger. A break of the 2017-8 highs would trigger another bullish signal in the instrument. This would push prices to new yearly highs and the US dollar index to new yearly lows.
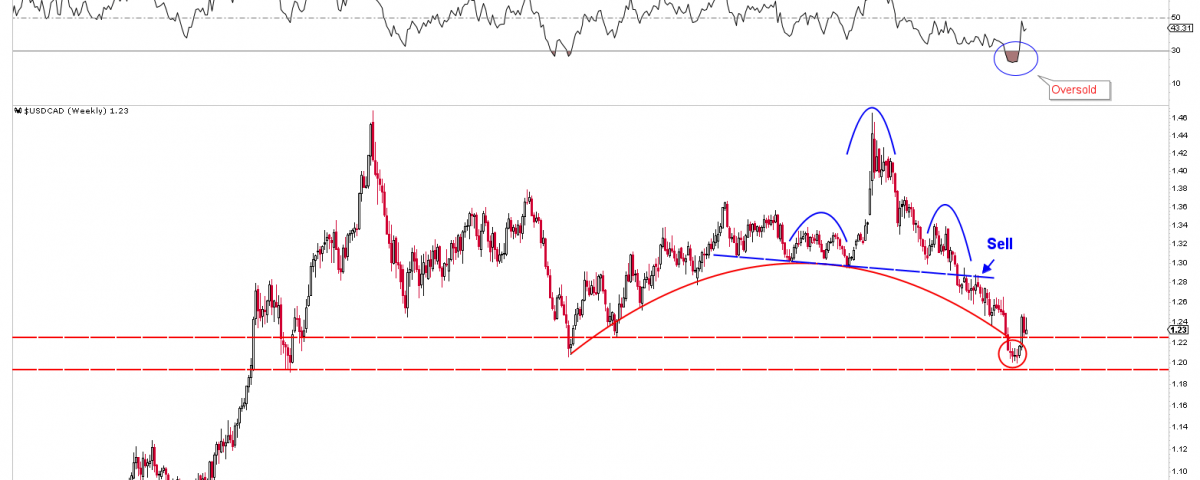
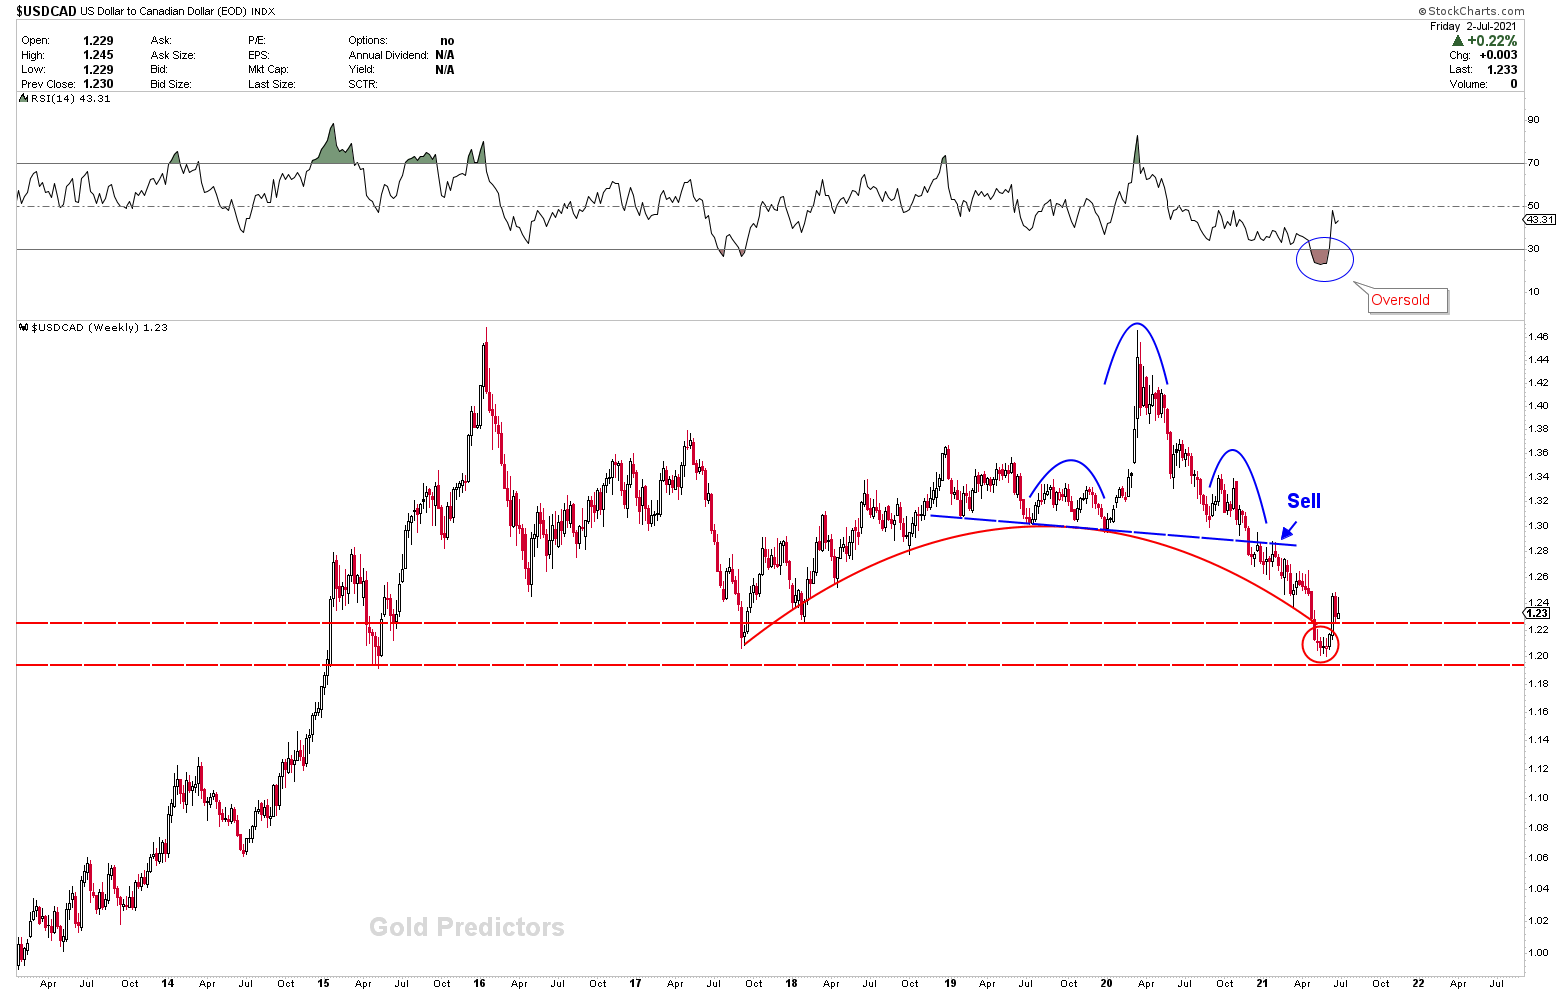
USDCAD Outlook
The USDCAD, which is influenced by the US dollar index, is another instrument to explore. We’ve been very bearish on USDCAD since last year. Not only because of the US dollar index’s weakness, but also because of the Canadian dollar’s strength. We marked a circle, when the US dollar was trading at 89-90 levels and the USDCAD at $1.20-$1.22 levels. We stated that the shaking of the US dollar at current levels would bounce the USDCAD. Within a few days, the USDCAD bounced around 500 pips from the bottom. USDCAD chart patterns are similar to the USD index. USDCAD has formed a double top with M type in the US dollar index. Any increase in the instrument’s strength is likely to trigger another sell signal for lower prices.
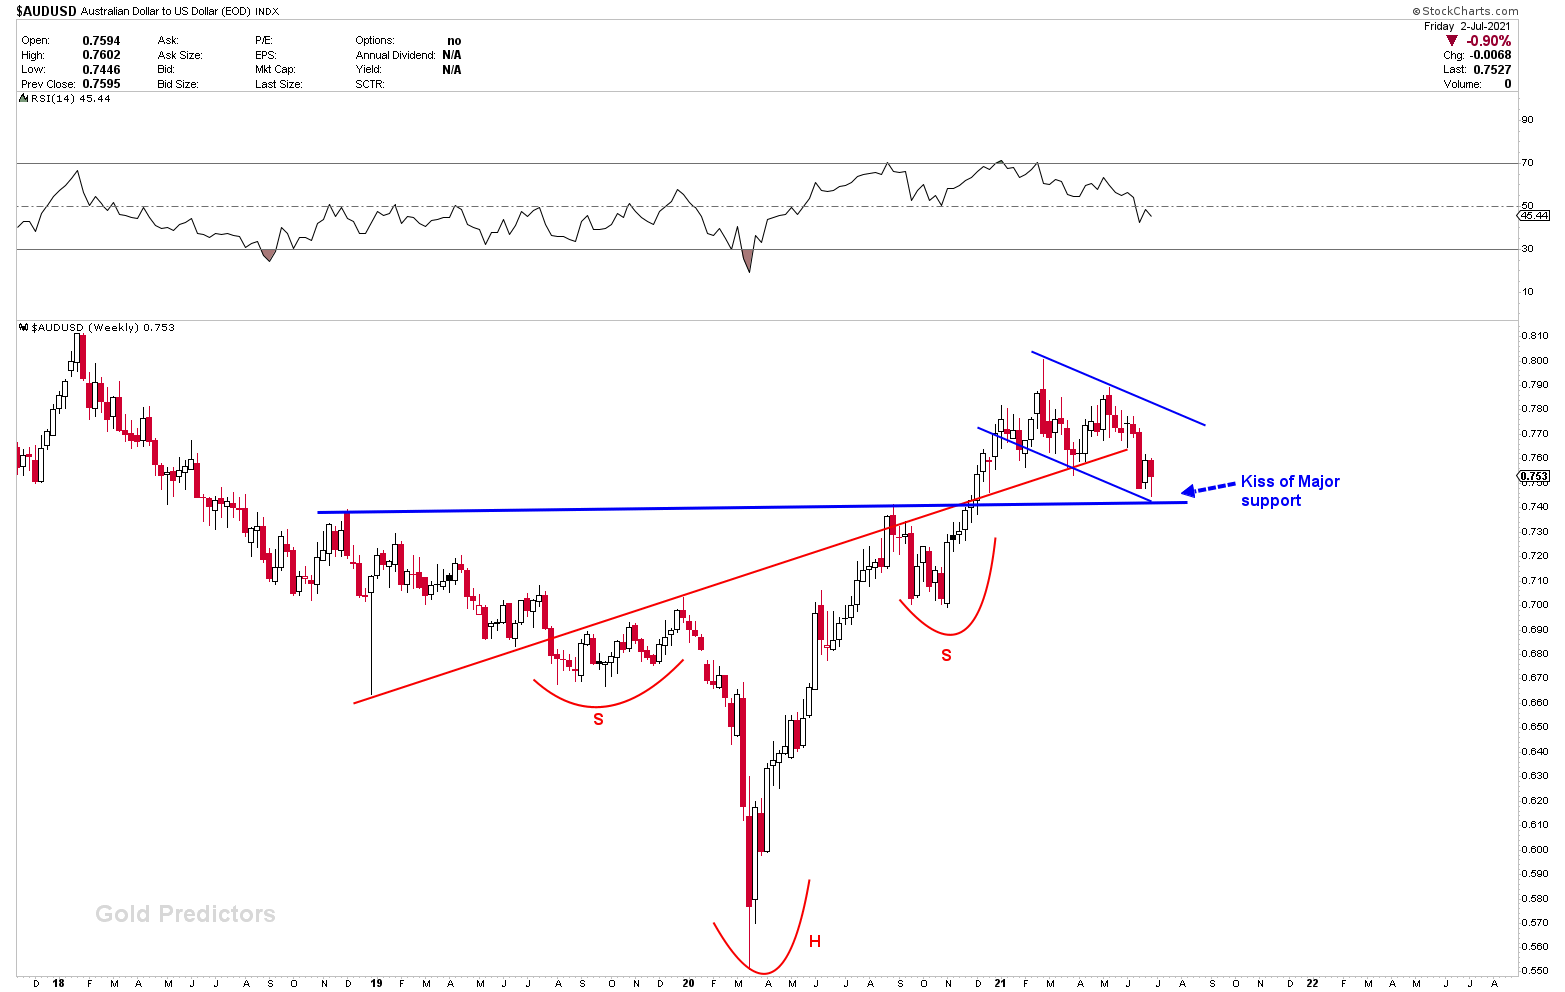
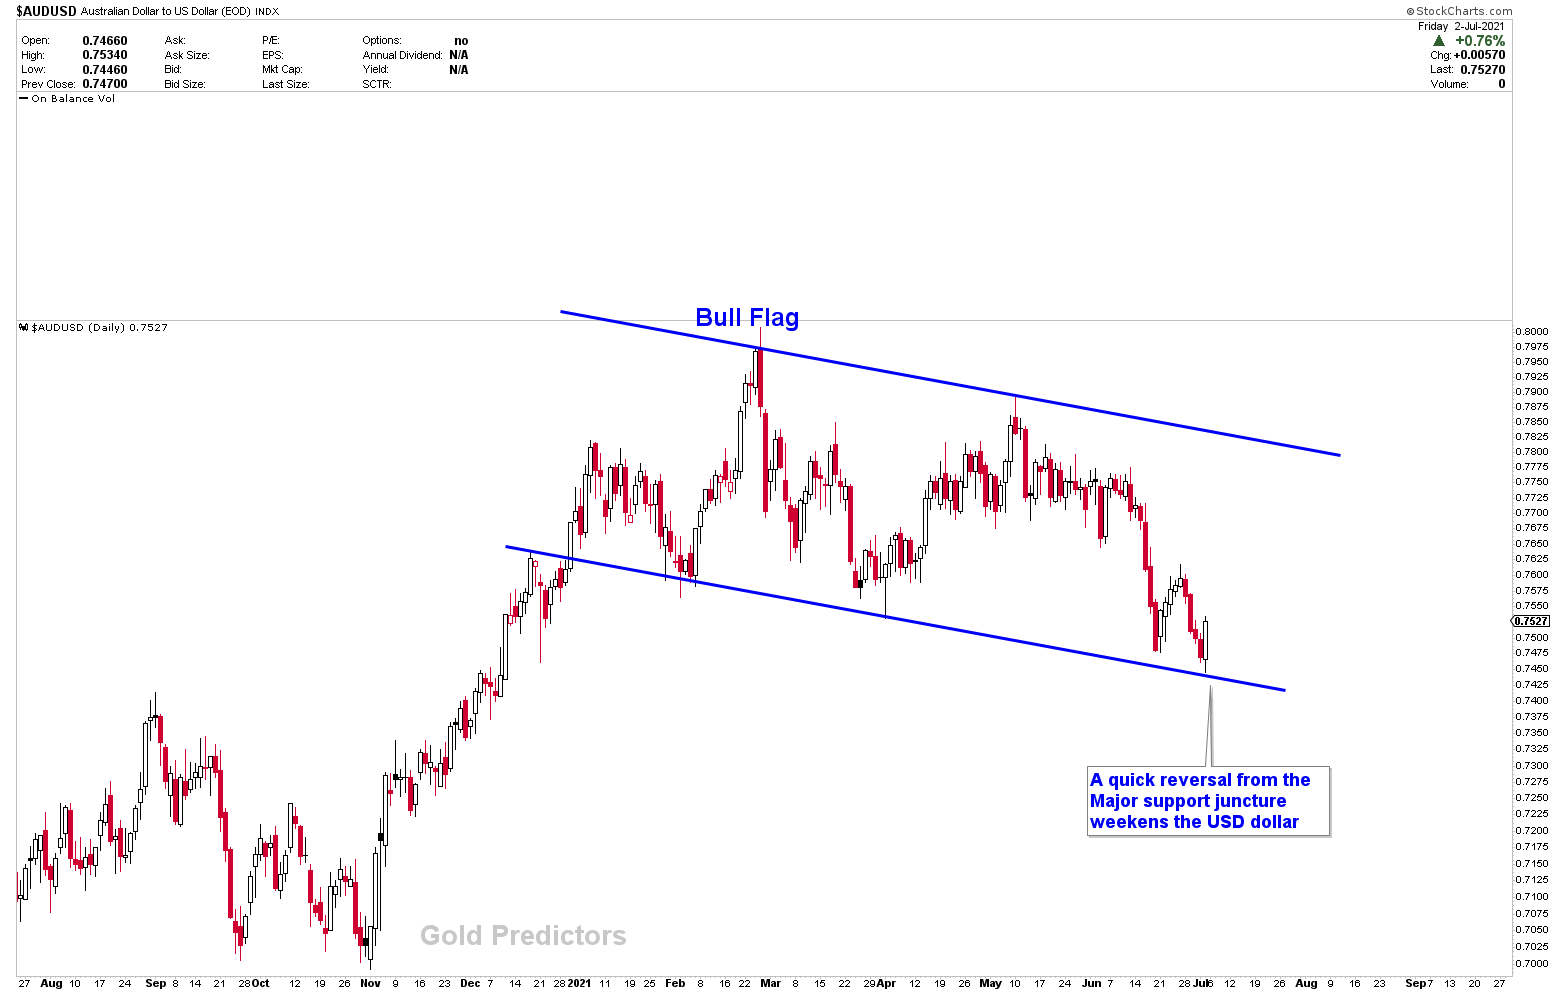
Australian Dollar To Benefit From USD Weakness
The commodity currency of the Australian dollar with respect to US dollar index (AUDUSD) is another instrument that is highly correlated to the US dollar. The AUDUSD has formed a rising inverted head and shoulder pattern, that is a bullish pattern. This pattern was discovered in August 2020 for our private investors, and the chart was later moved to members. In the last three months, the patterns have become very strong. However, after breaking through the resistance, the pair has pulled back to the inverted head and shoulder neckline, which was breached last week. The inverted head and shoulder guide prices to the blue horizontal support when the red neckline is breached.
According to price action, the recent drop in the price of the AUDUSD resulted in the development of another very bullish structure in the instrument. This structure has developed a bull flag above the support that was tested last week. Price bounced hard after testing support, forming a bullish hammer on the chart.
Take a look at the AUDUSD daily charts, where the bullish hammer can be seen with the flag. A breakout of this flag would throw the price to new yearly highs.
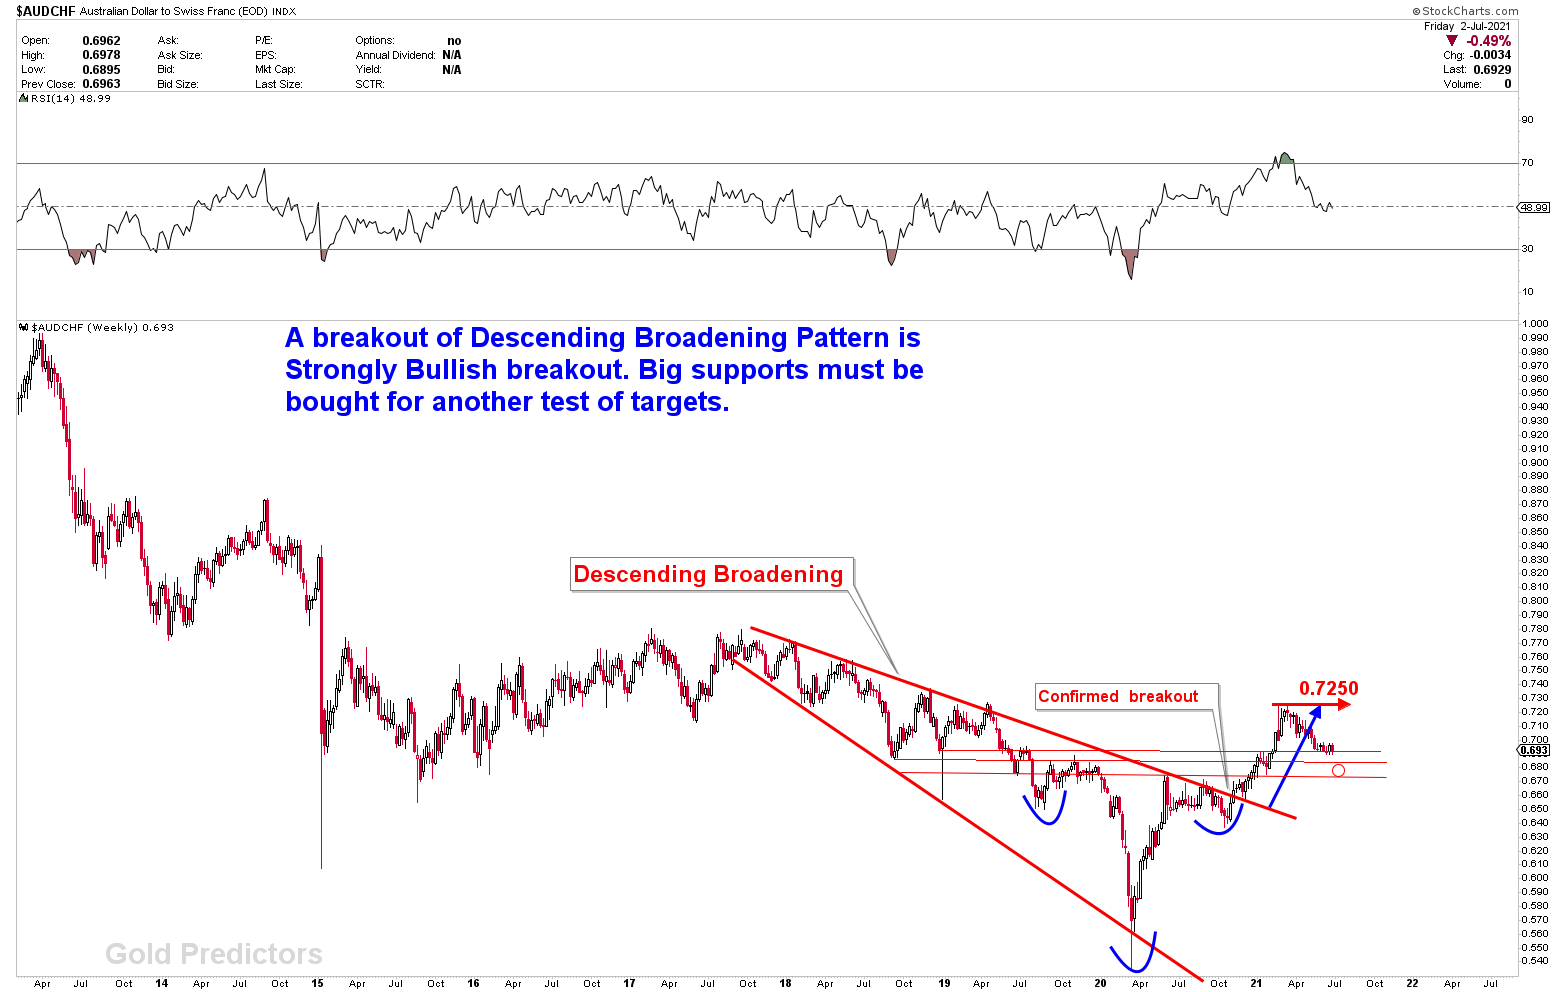
AUDCHF Bullish Structure
We’d like to follow up on the AUDCHF chart. The chart was created for our private investors in October 2020 and then later shown to members. When the price was at 0.66, we predicted that the instrument would rise up to 1000 pips. The descending broadening formation indicates a strong bullish outlook for the instrument. The initial resistance was set at 0.7250, and the pair is now falling from that level to new support. However, the structure of this pair is strongly bullish, and the instrument is expected to trade higher after finding support.
To receive free updates, please register as a free member.