Effects of US Dollar Weakness
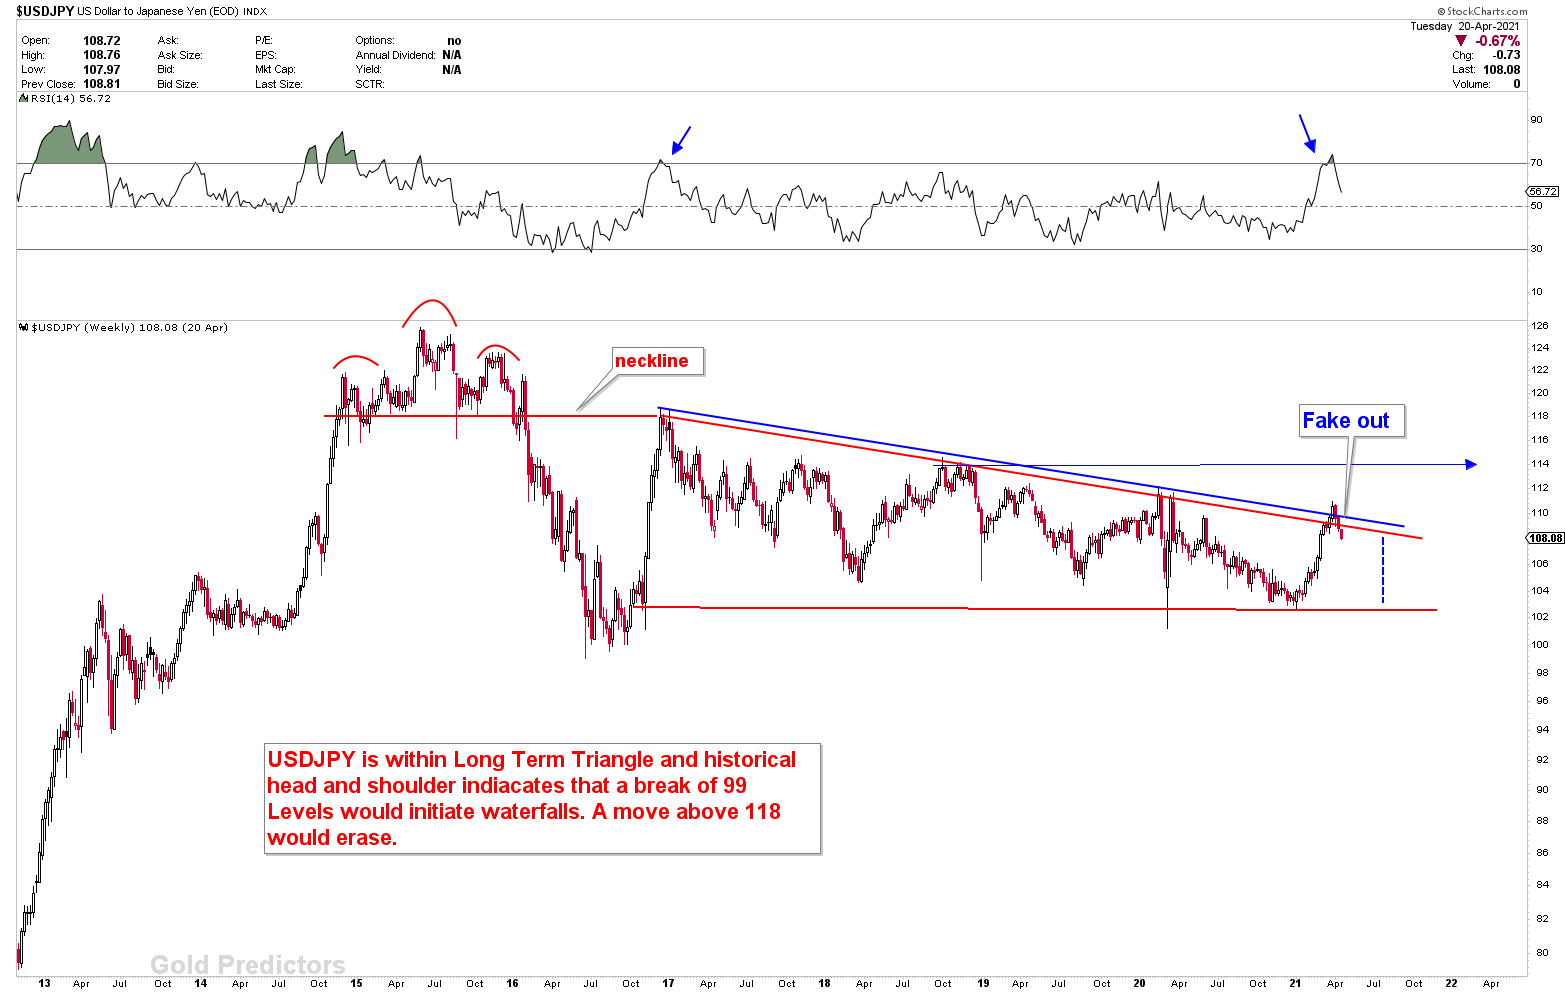
The end of the US dollar rally was discussed last week. The dollar plummeted, causing the USDJPY to resume its long-term bearish patterns. Australian dollar advances from the rising inverted head and shoulder neckline. The effect of US dollar weakness on the forex majors will be discussed today.
Highlights
- The resumption of the primary downtrend in the US dollar was discussed in last week’s report. The US dollar is poised to fall.
- EUR and CAD were highlighted as the strongest currencies, while NZD and AUD were highlighted as the weakest. The strongest currencies are still the Euro and the CAD, but the New Zealand dollar is bouncing off support. The Australian dollar is also reacting to the inflection points.
Weakest currency: NZD, AUD
Strongest Currency: EUR, CAD
Best Instruments to Focus:
No Recommendations
US Dollar Poised for Lower Prices
The central bank of Norway has hinted at a rate hike by end of the year. The Bank of Canada is unlikely to raise interest rates, but it is expected to change its forward guidance in order to prepare the market for a reduction in bond purchases. Because the central bank’s emergency liquidity has run out, tapering is the next logical step. It is currently buying C$4 billion per week in federal bonds. Purchases may be cut as early as next week.
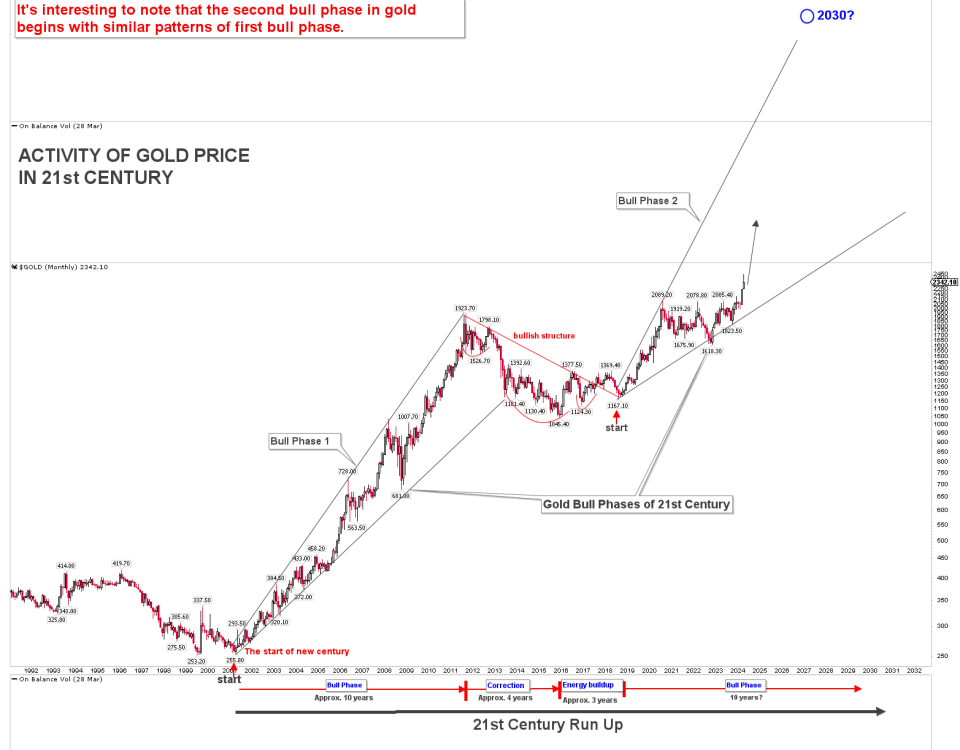
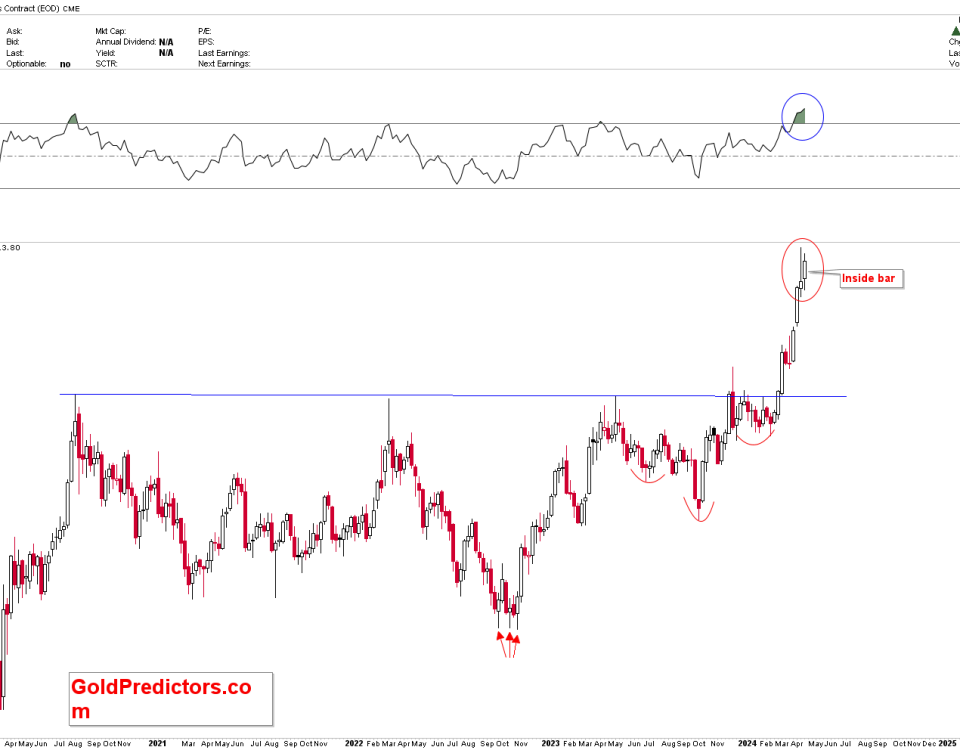
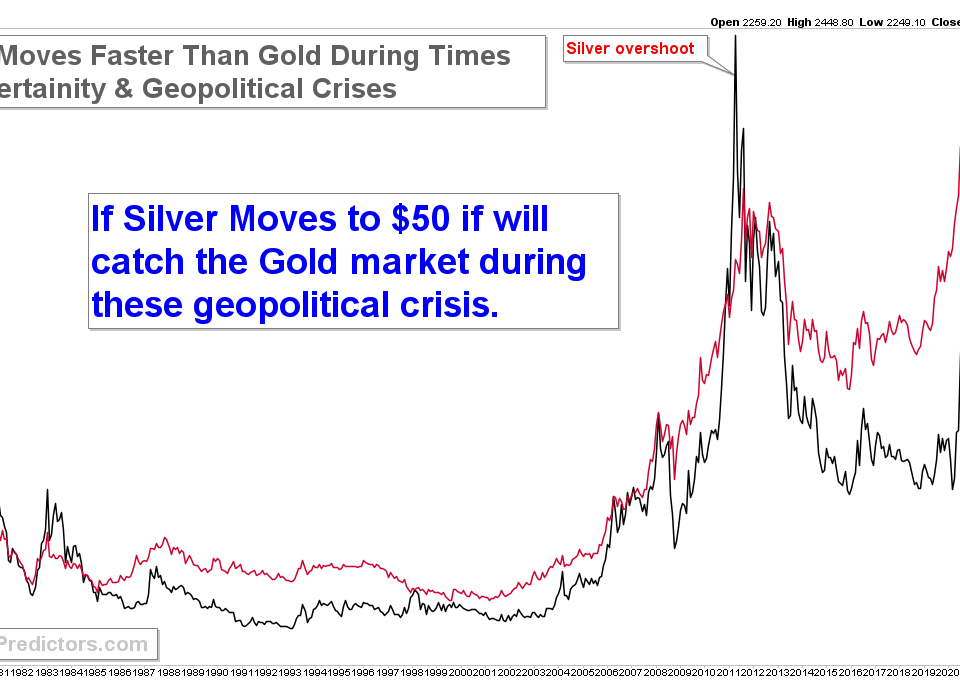
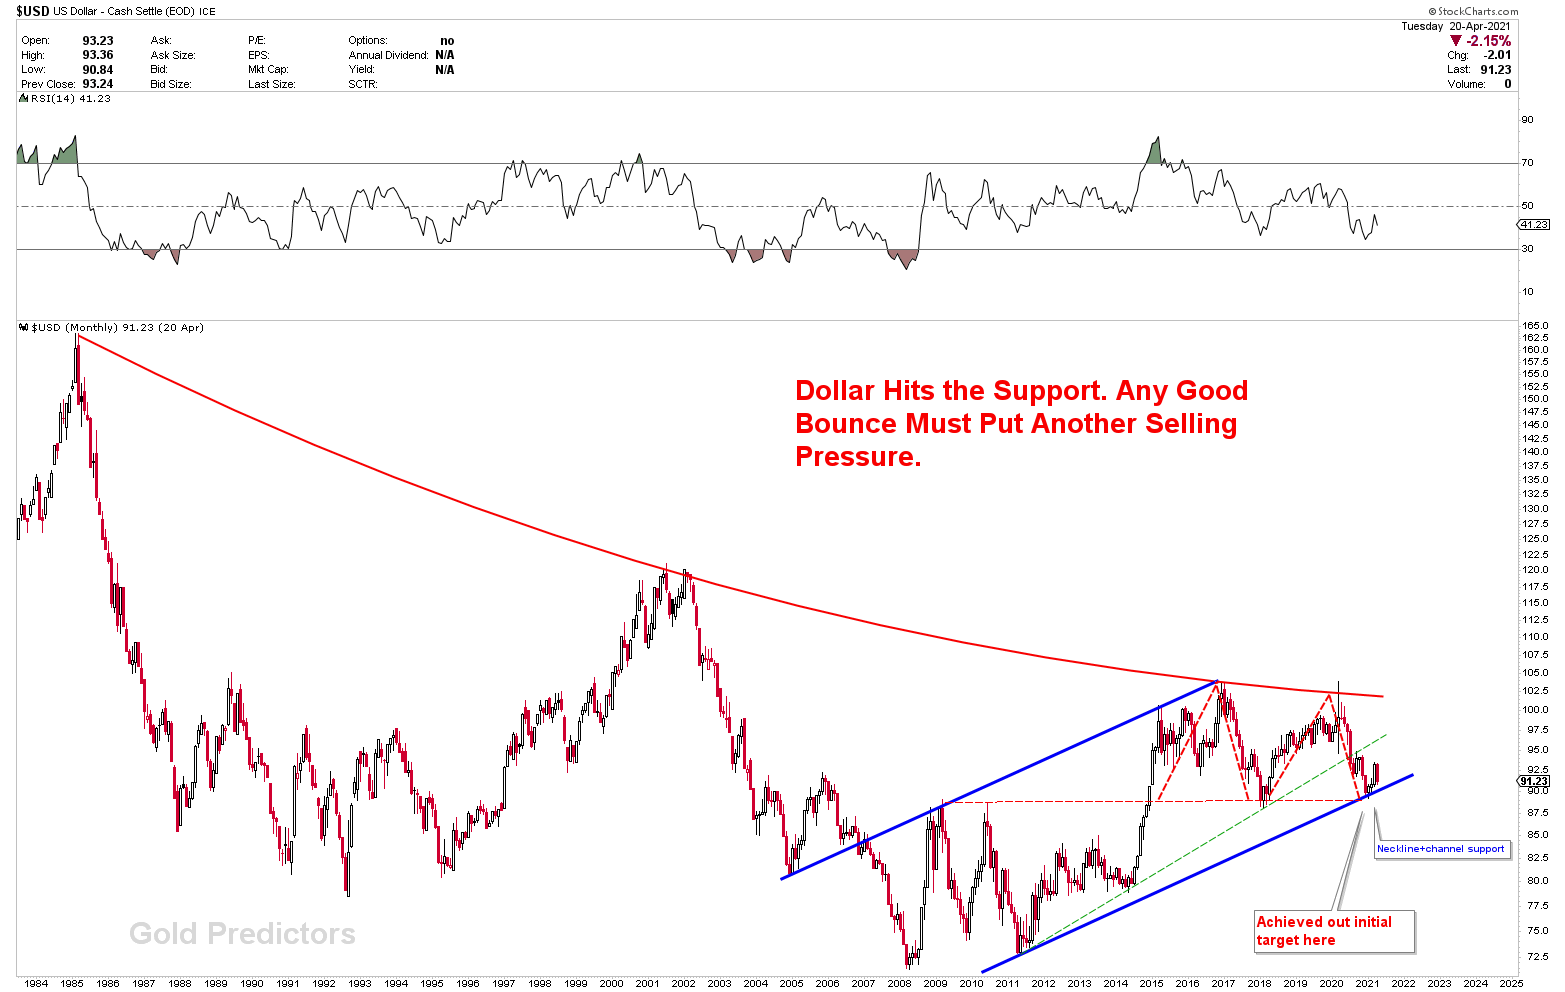
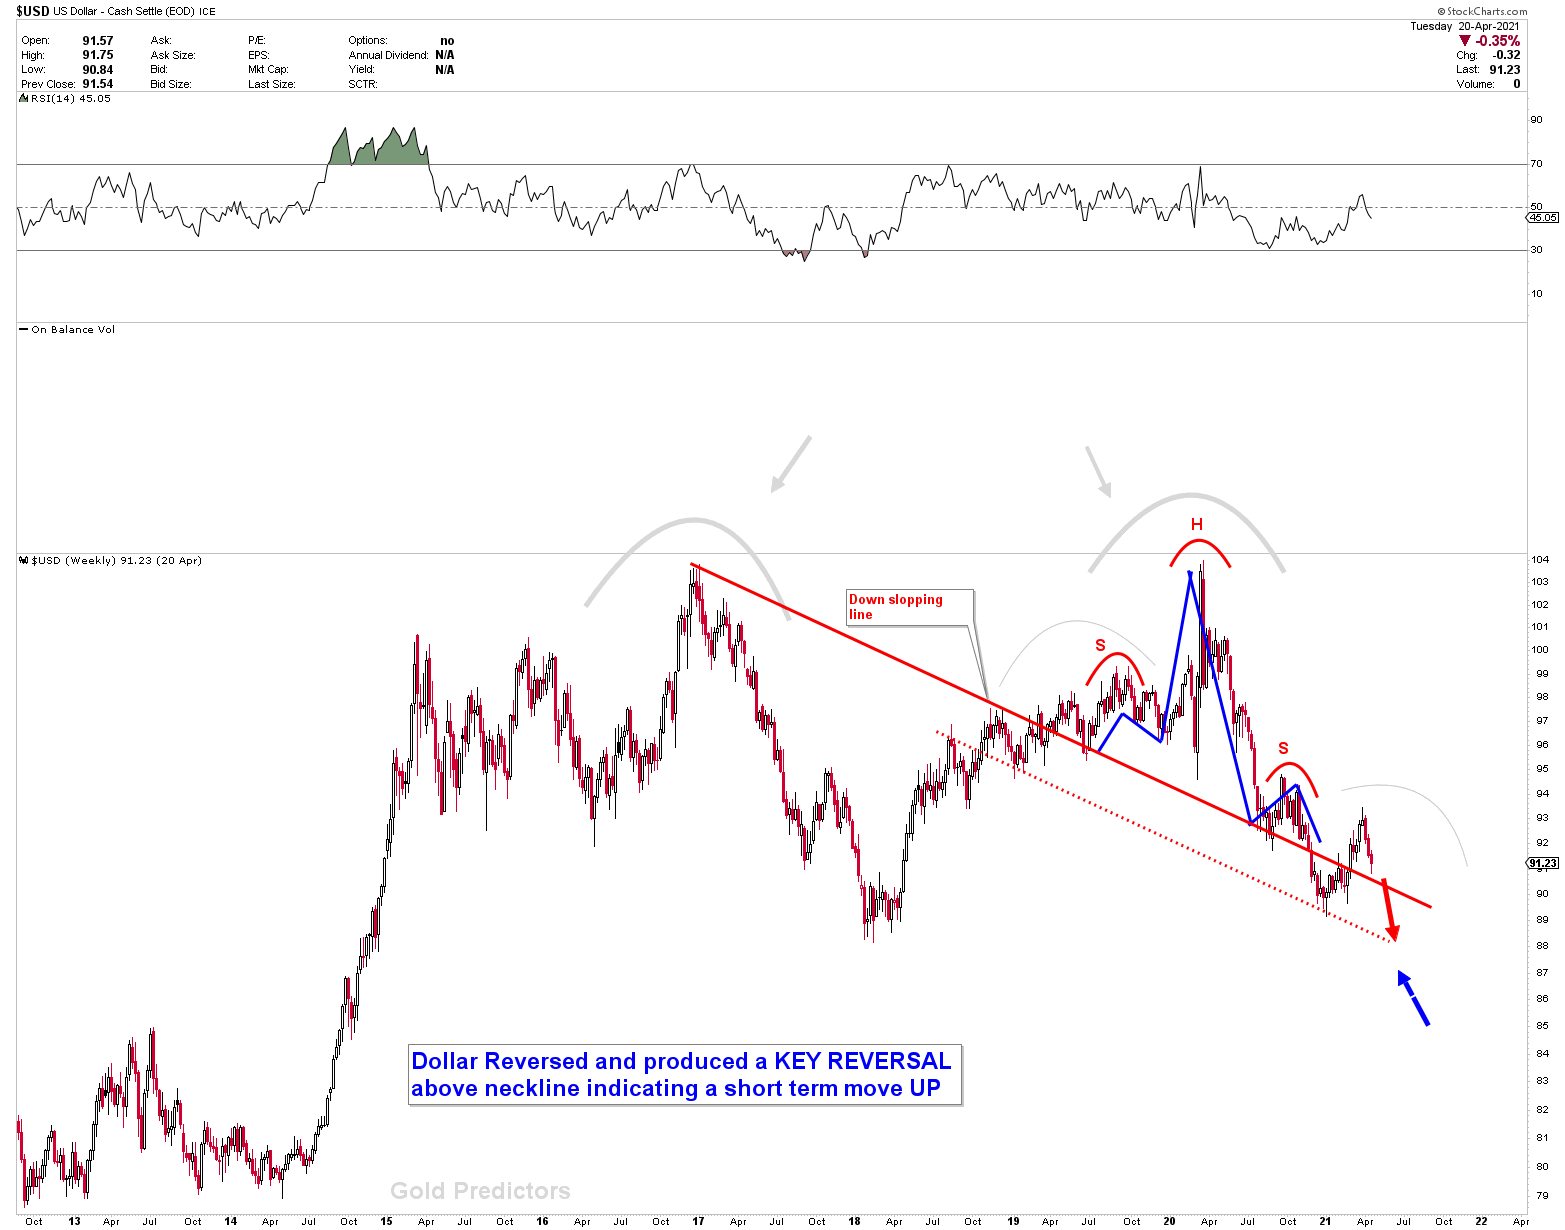
The US dollar is poised to fall as the primary trend remains negative. At the same time, the dollar hit the downward sloping line, and gold hit 1792. Although the dollar and gold are correlated markets, history shows that both can rise at the same time. When the dollar falls, gold and silver prices gain strength with higher velocity. Looking at the monthly chart, it’s clear that price is attempting to break through the channel line, where a breakout would be disastrous for the dollar.
EURUSD Advances as the US Dollar is Weakening
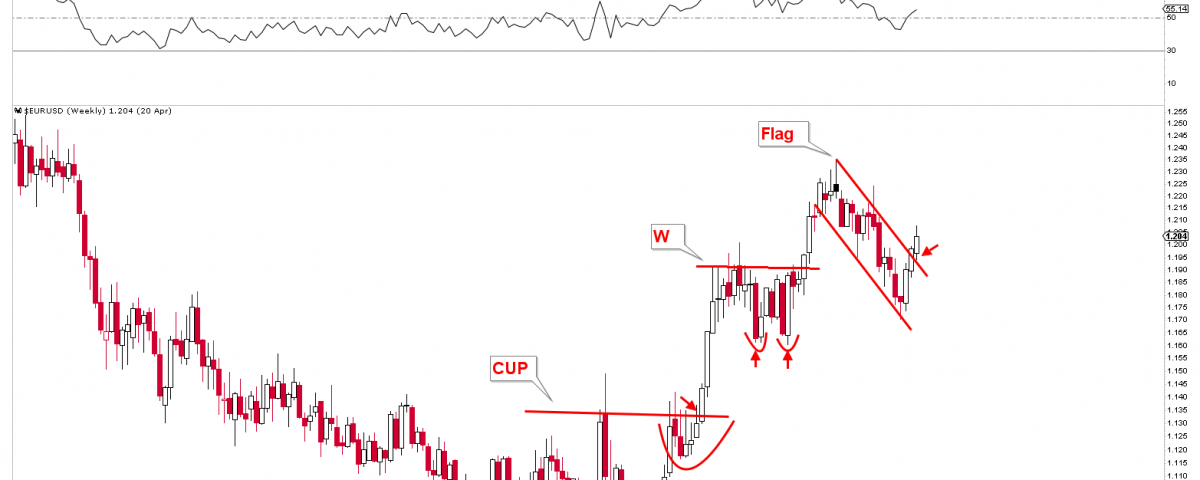
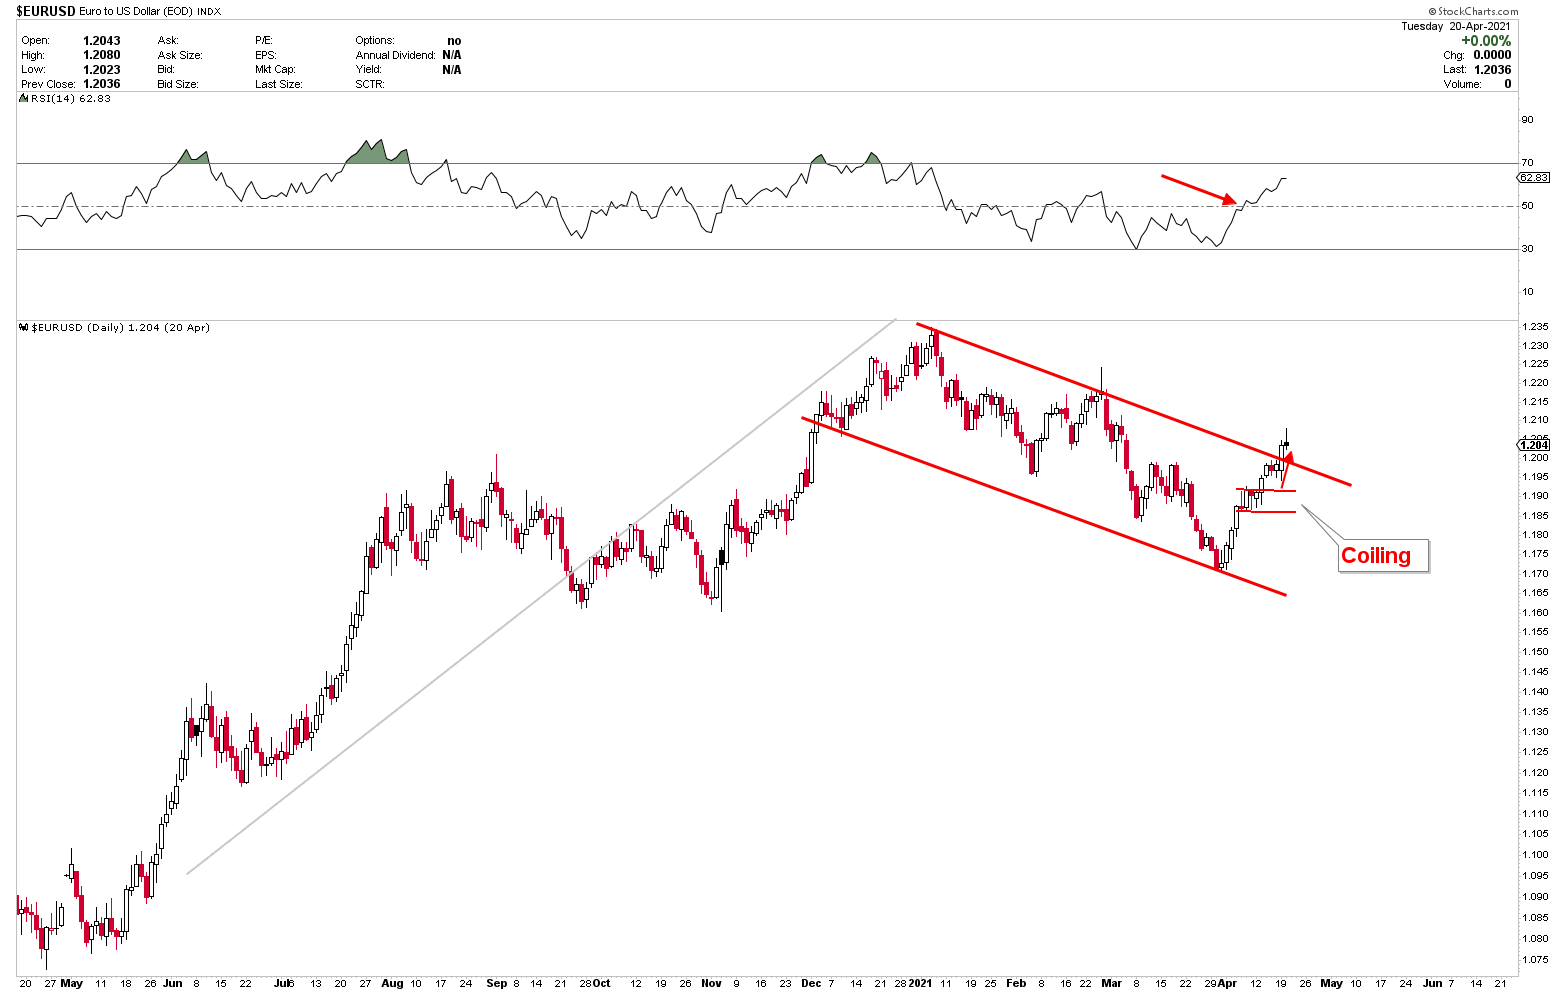
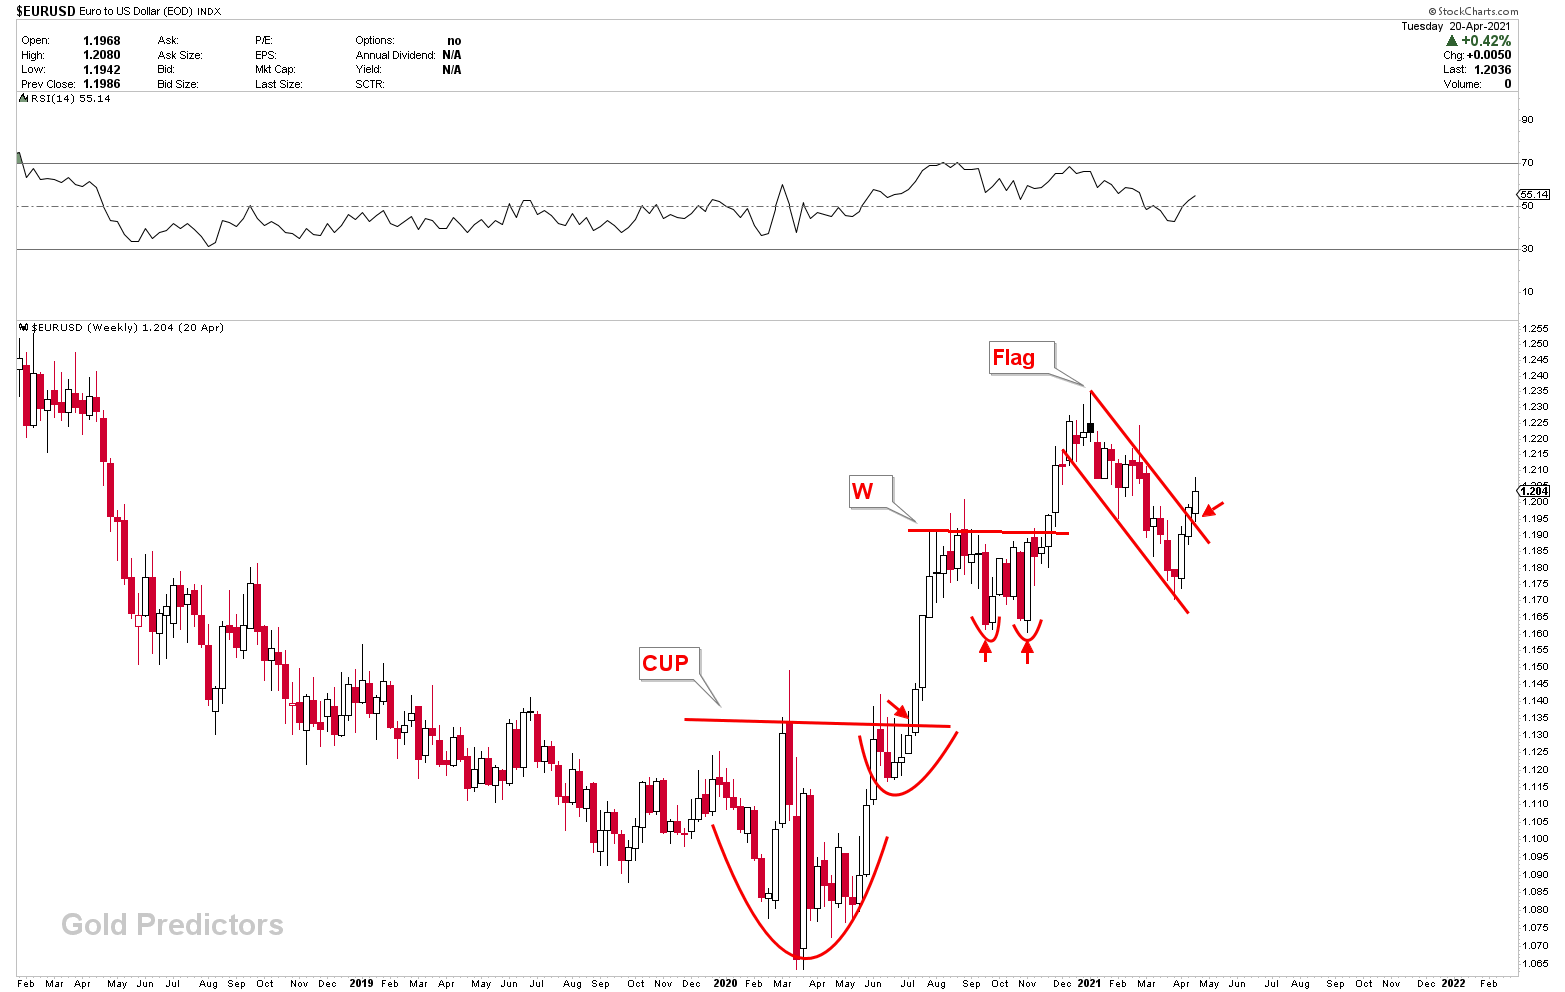
Because the EURUSD is inversely proportional to the US dollar, if the US dollar continues to fall, the EURUSD must rise. The EURUSD chart from last week showed a strong double coining effect, and we predicted that a break of 1.1925 would result in higher prices. Price has now broken through the flag formations and is trending upwards. In this case, the value of the dollar would be negative. The weekly charts of EURUSD also point higher, with the flag poised to break higher. A breakout of Flag, based on CUP and Handle patterns, and then double bottom (W) patterns, indicates that this instrument is about to explode, putting more pressure on the US Dollar and rocket launch of gold.
Effect of US Dollar Weakness on GBPUSD
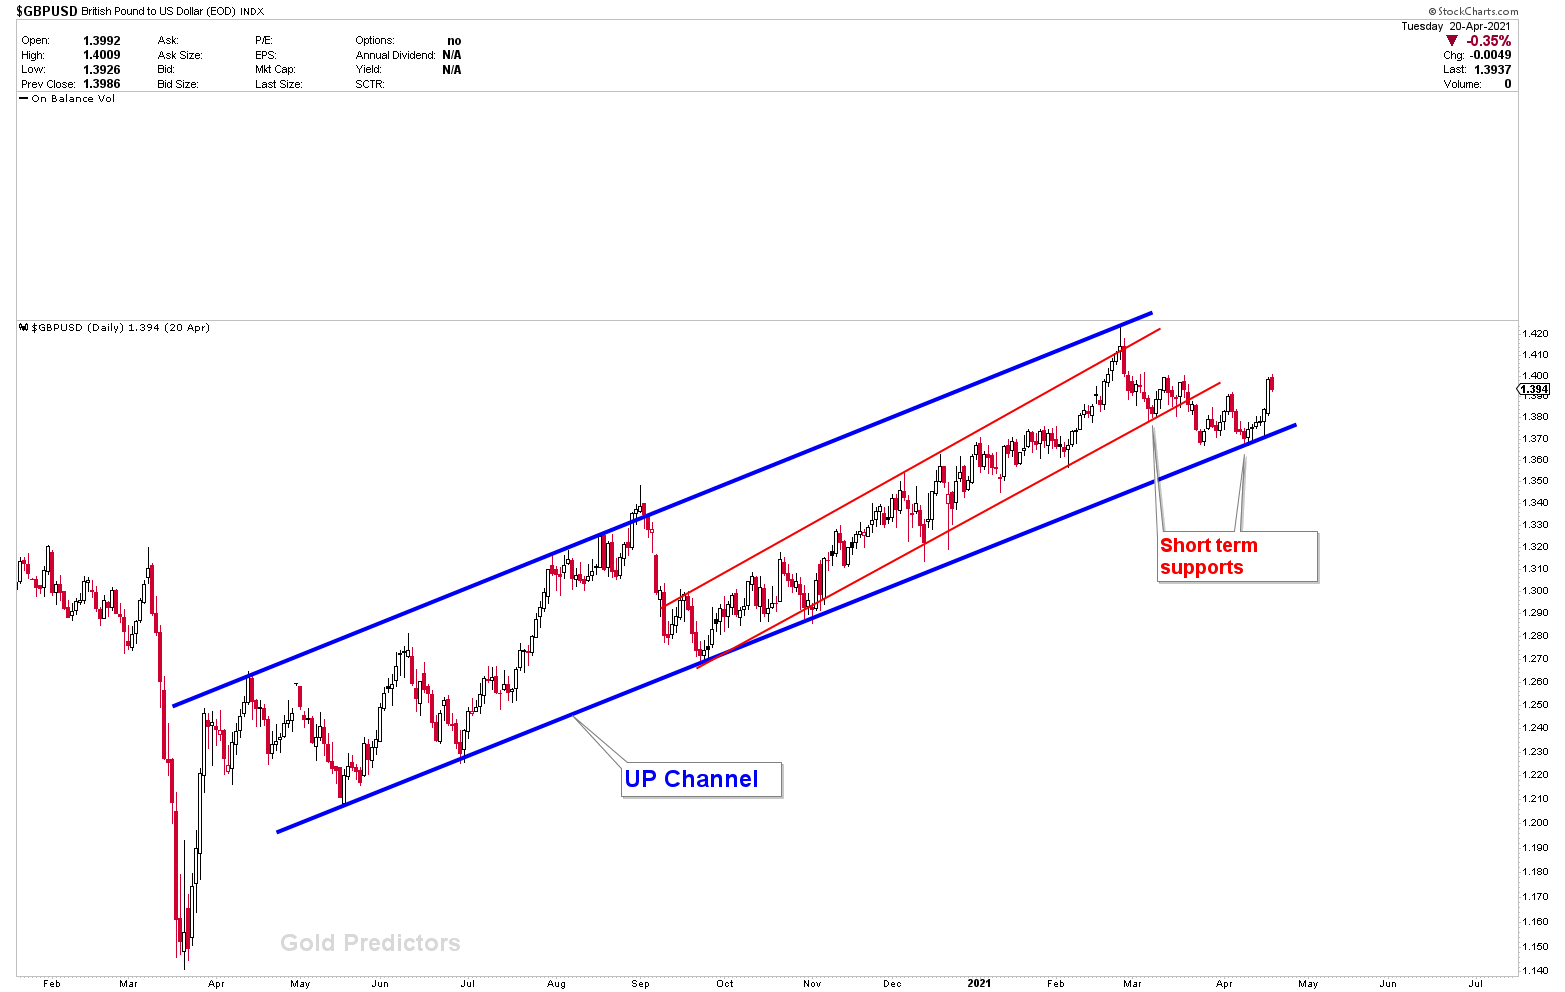
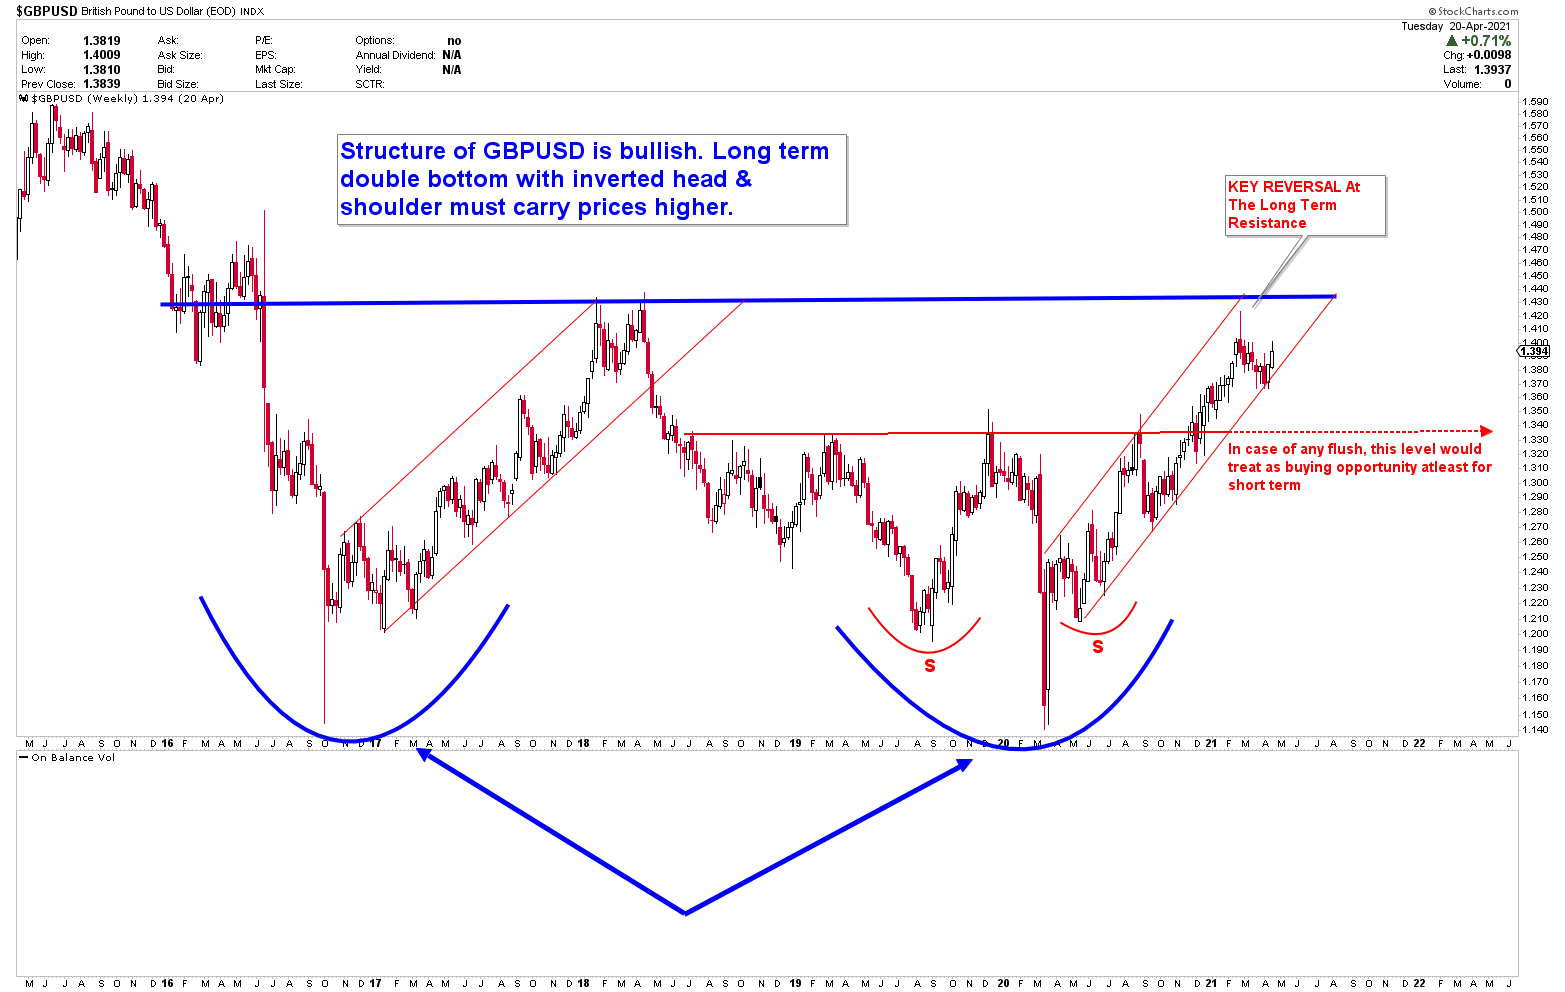
GBPUSD is ready to rise as a result of the US dollar’s weakness. We’ve been sending this chart for over a month and have identified two levels of support. The one set to red, while the one set to blue. Both supports had a lot of bounce. On the weekly chart, it’s clear that the GBPUSD is about to retest the long-term resistance (horizontal blue).
Effect of USD Dollar Weakness on Dollar Majors
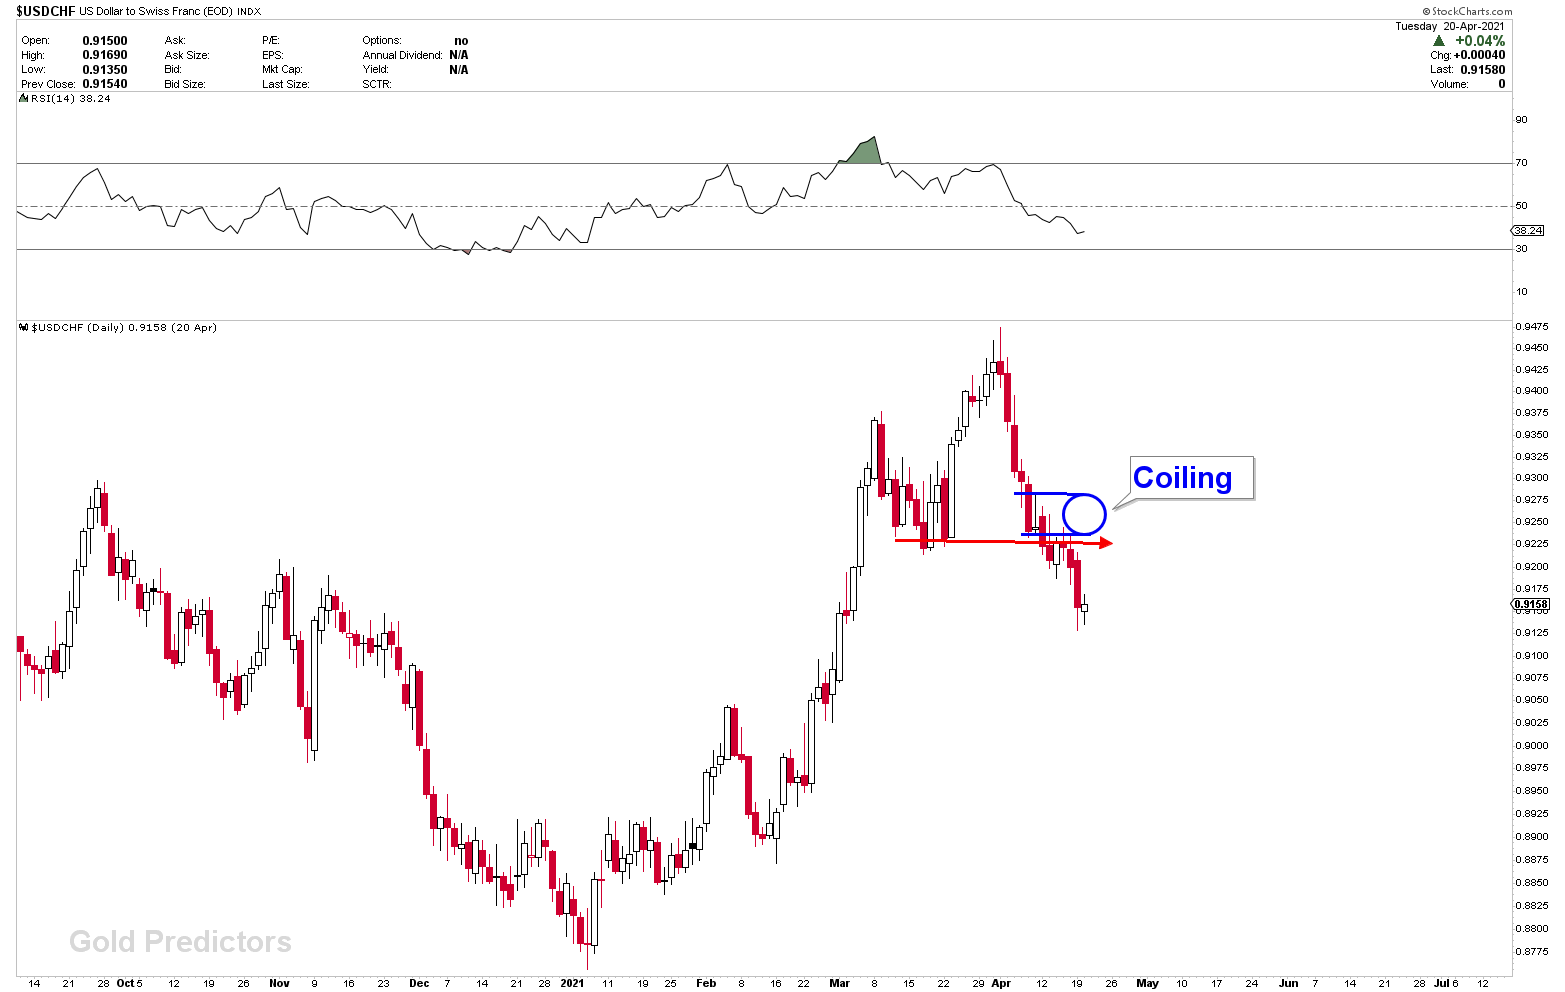
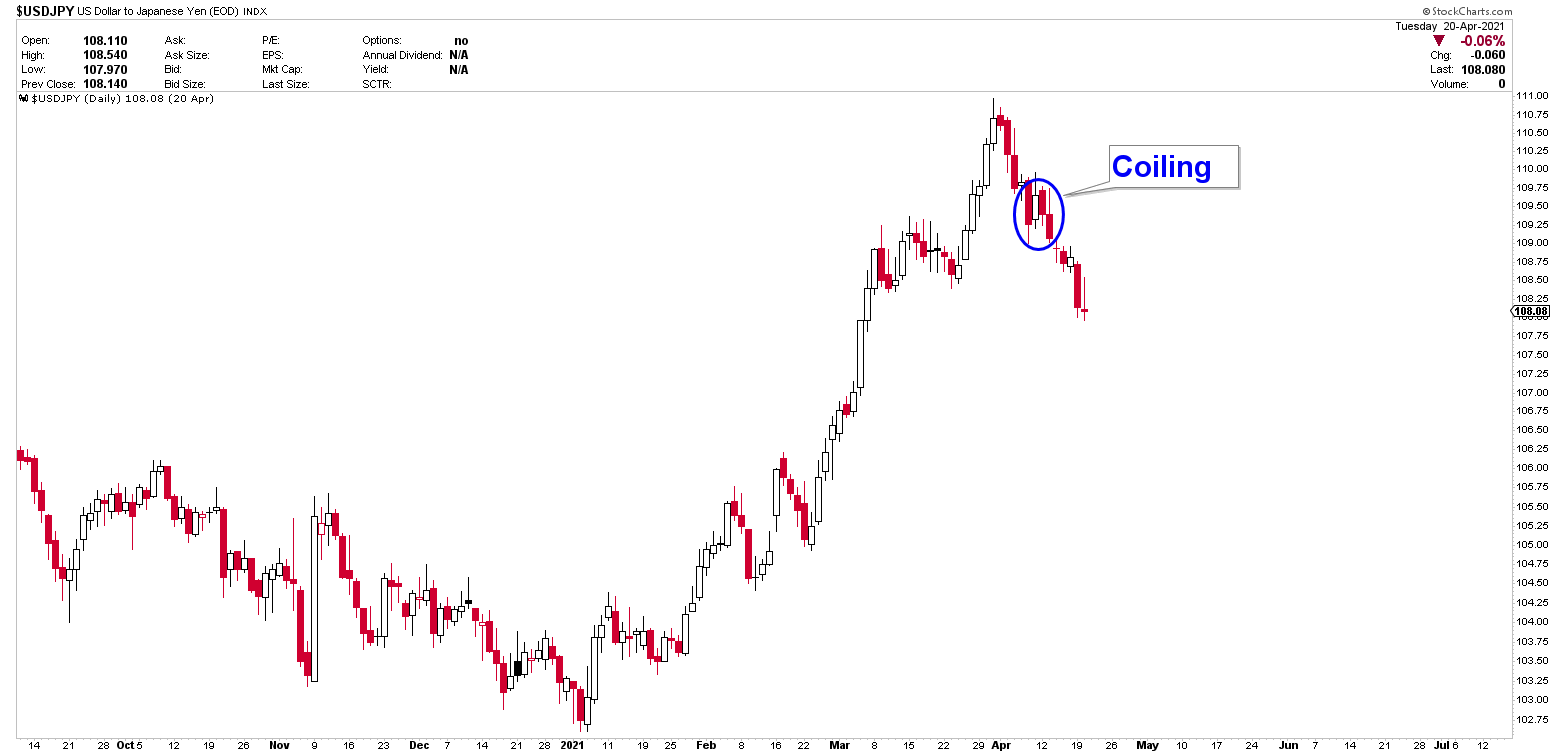
As expected, the chart with the coil from last week was broken, resulting in a strong move in both the USDJPY and USDCHF pairs, which are now pointing lower. The weekly chart of USDJPY was discussed few weeks ago. In addition, the yearly inflection in gold and the USDJPY is acting, and prices are falling. The USDJPY monthly chart shows a resemblance to historical patterns where inflections have occurred. If the USDJPY crashes in April, it will be a good sign for other commodities, especially gold, because of their negative relationship.
Australian Dollar Reaction At Inflection
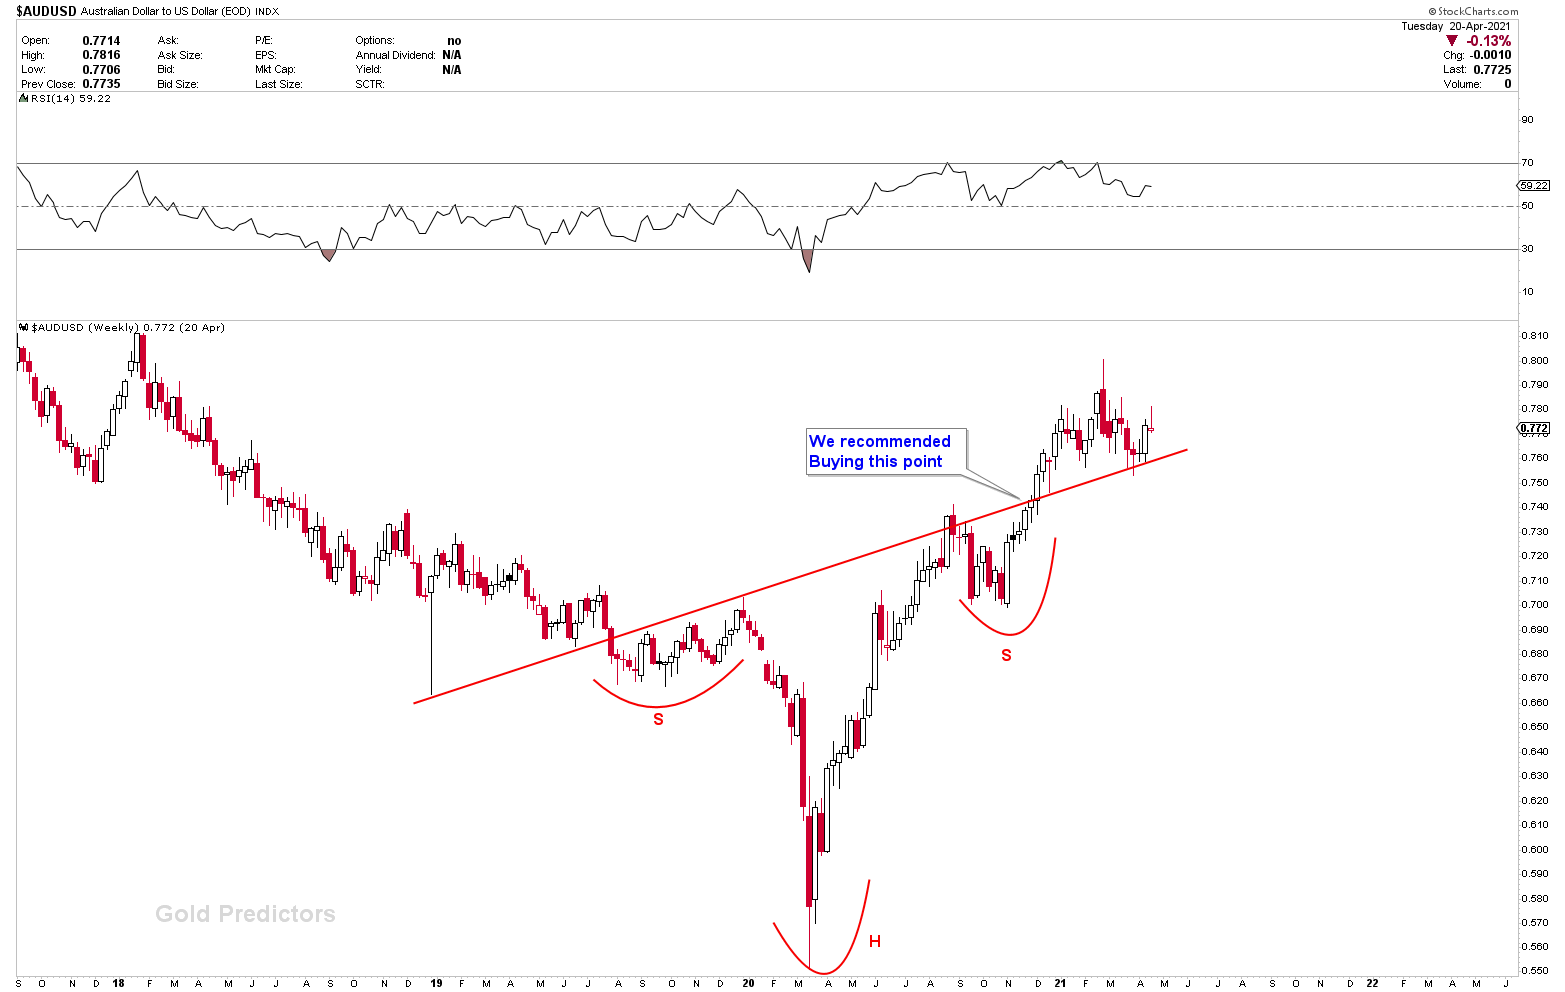
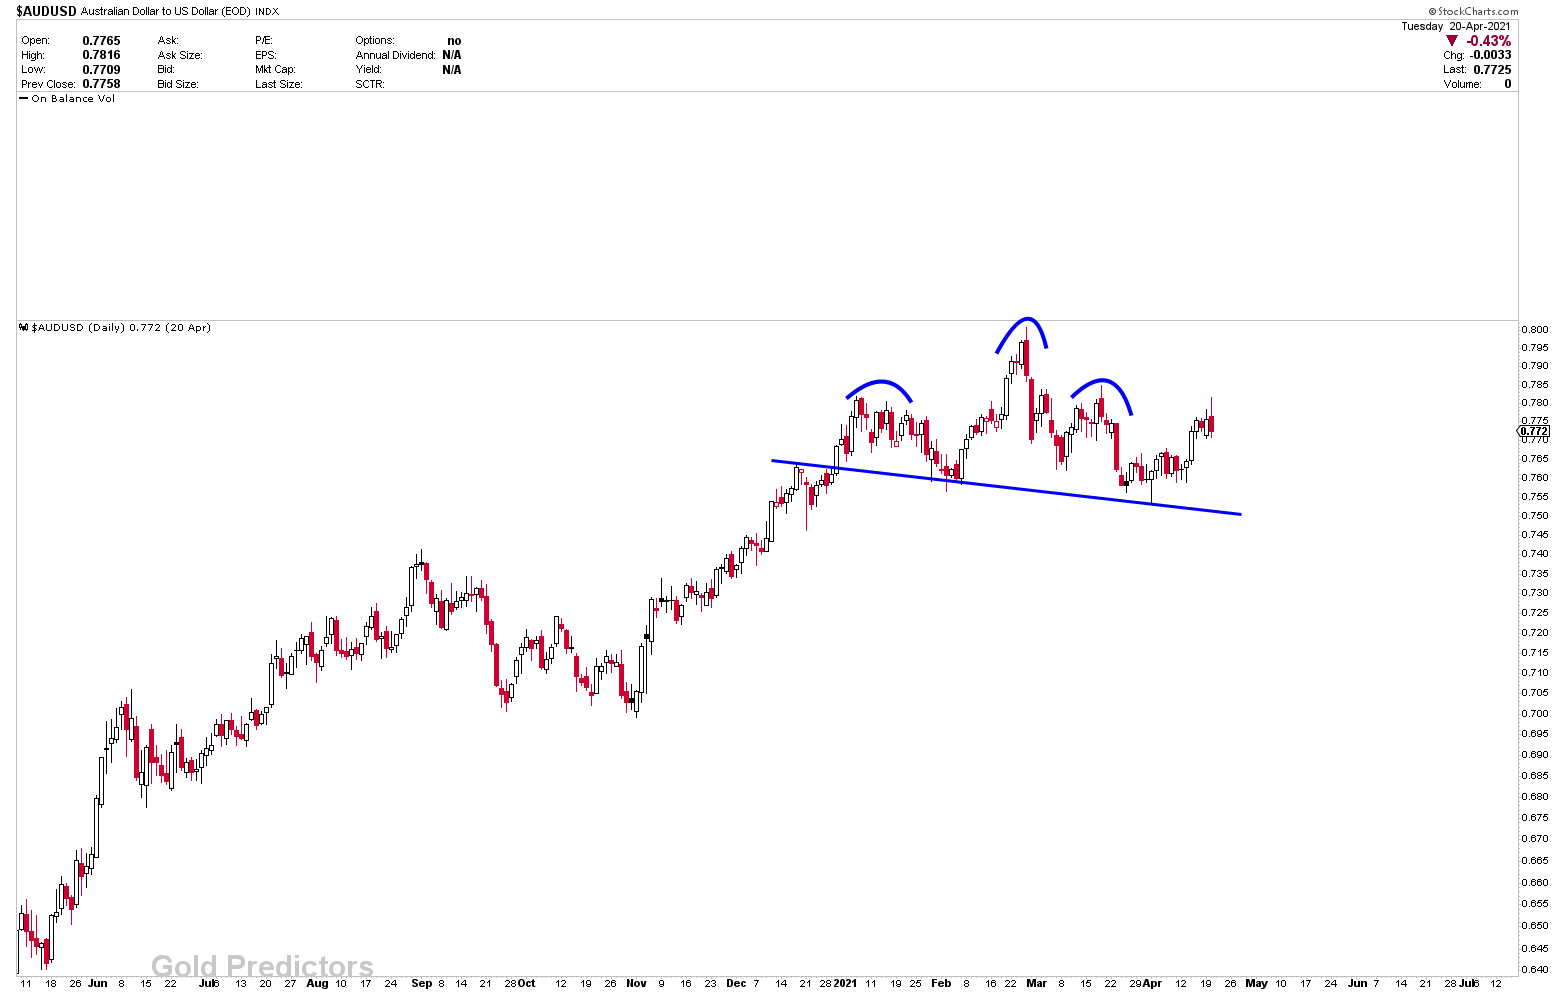
The Australian dollar was discussed in last week’s report. We presented you with the AUDCHF and AUSUSD to show you the Australian outlook. AUDCHF broke strong bullish patterns (Descending Broadening) on last week’s chart, implying a multiple hundreds of pips higher. The initial resistance in the instrument has been overcome, and the AUDCHF pullback should be viewed as a buying opportunity. The AUDUSD, on the other hand, formed a strong rising inverted head and shoulder pattern, indicating a strong move to the upside.
The purpose of the previous discussion of this instrument was to present that the Australian dollar was trading at an important inflection point on a daily and weekly basis, which, if broken, could lead to further weakness. On both daily and weekly charts, however, this inflection was treated as a strong magnet last week, and the currency is advancing exactly from the neckline. The AUDUSD is expected to rise significantly from these levels, but a break of necklines on both weekly and daily charts would suggest further weakness. Based on the strength of gold and the weakness of the dollar, we continue to favor higher prices. Due to the fact that the Australian dollar is a commodity currency.
Final Words about US Dollar Weakness
The dollar is expected to plummet dramatically. USDCHF and USDJPY are both falling sharply. Dollar weakness is implied by the hit of the yearly inflection in USDJPY and Gold. The EURUSD would benefit from the US dollar’s weakness


