Gold Price Nears $4,000 After Historic Breakout and SPX Ratio Reversal
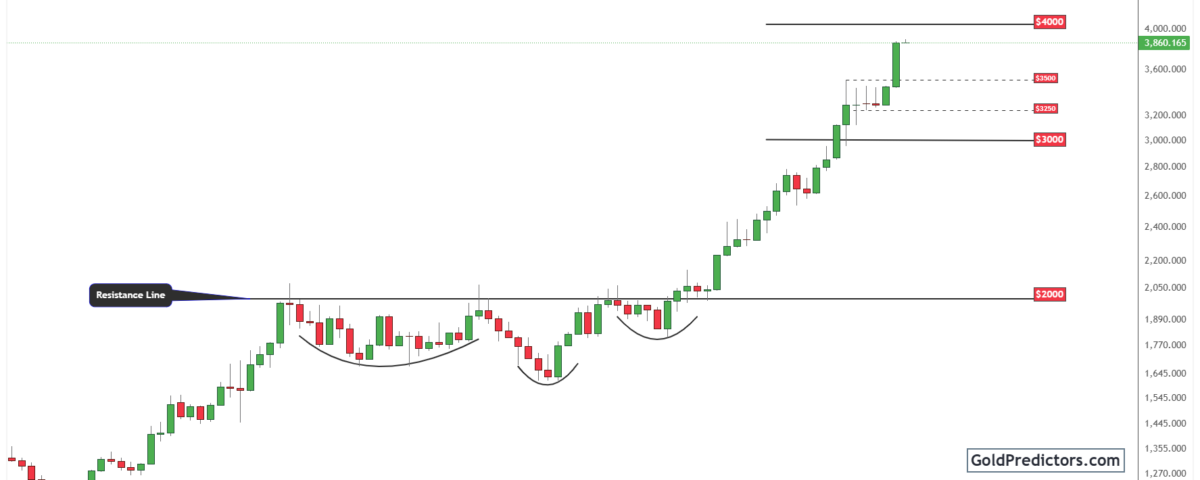
Gold (XAUUSD) has broken through multi-year resistance, signalling a decisive shift in its long-term trend. The breakout above $3,500 transformed old resistance into firm support, pushing prices close to $4,000. The consolidation phase from 2020 to 2024 established a solid foundation that now propels the current rally. Each dip has attracted strong demand, keeping momentum intact and strengthening the bullish case. At the same time, the SPX-to-gold ratio has turned lower, highlighting a structural reversal in market leadership. This shift underscores gold’s growing dominance over equities, adding weight to the bullish outlook. With both technical and relative-strength signals aligned, gold stands at the edge of a new phase, where a sustained move above $4,000 could accelerate gains further.
Gold Surges Past Multi-Year Resistance with $4,000 in Focus
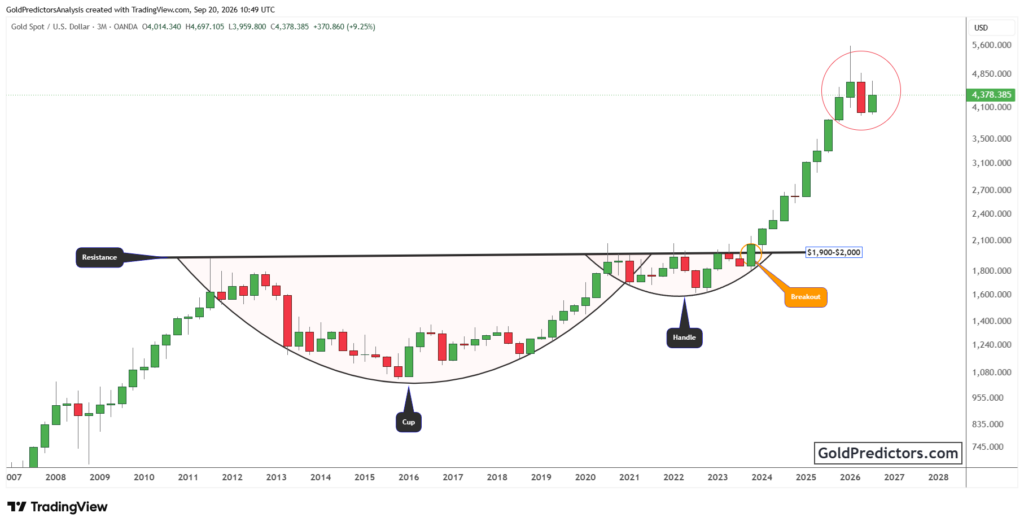
The gold chart below shows a decisive breakout from years of consolidation, marking a structural shift in the long-term trend. For years, the $2,000 level acted as firm resistance, containing price within a prolonged consolidation. From 2020 to 2024, gold established a broad base with several rounded bottoms. Each pullback strengthens the base and sets the stage for the next advance. The breakout in 2024 confirmed this structure and unleashed strong upward momentum.

Gold has climbed close to the $4,000 mark, with the price consolidating near recent highs. The breakout has validated the bullish structure and opened the door to higher price targets. The previous resistance at $3,500 has now become solid support, with $3,250 serving as a secondary base. As long as gold stays above these levels, the bullish case remains intact. A sustained break above $4,000 may trigger the next leg higher, based on the current technical setup.
Furthermore, this move reflects steady confidence among investors, with dips consistently attracting demand and supporting the upward trend. The breakout from a multi-year consolidation is not just a technical event but a signal of structural change. Gold has entered a decisive phase in its long-term bull cycle, with momentum and strong demand aligning to support further gains.
SPX-to-Gold Ratio Drop Presents Gold’s Outperformance Over Equities
The chart below shows the S&P 500 index performance relative to gold, highlighting a clear shift in long-term market leadership. For decades, equities outperformed gold with the ratio trending higher, but an apparent reversal is now underway. The chart highlights multiple triangular patterns that shaped the ratio’s movement over many years. Once the ratio broke below its support trendline, the balance began to shift in favor of gold.

Notably, the SPX-to-gold ratio has dropped to 1.74, marking a steep decline from its previous highs. The recent rejection at the 1.90 level, along with a breach of long-term support, suggests that the ratio faces additional downside risk. This indicates that gold is likely to outperform equities over the coming years. The arrow projection on the chart indicates deeper declines, further strengthening the case for gold’s leadership in the market.
Consequently, the SPX-gold ratio has often acted as an indicator of major economic or policy shifts. The breakdown signals that equities are losing relative strength, while gold is gaining appeal as a safe haven and inflation hedge. This adds weight to the bullish outlook for gold, suggesting that gold is entering a new phase of market leadership.
Conclusion: Gold’s Structural Breakout Confirms Long-Term Strength and Leadership
Gold has broken above decades of resistance and confirmed a decisive long-term breakout. The move above the $3,400–$3,500 zone validated years of consolidation and set a firm base for higher prices. Strong support levels now protect the uptrend, while momentum indicators suggest further acceleration is likely. This structure signals the beginning of a powerful new phase in gold’s upward trend.
Furthermore, the SPX-to-gold ratio confirms this shift by showing a clear breakdown in the relative strength of equities. Historical patterns reveal that these reversals align with significant economic and monetary transitions. The ratio’s decline signals gold’s growing importance as a hedge and a dominant asset.
Overall, these signals indicate that gold has entered a powerful cycle, supported by technical momentum and sustained demand. A confirmed breakout, firm support levels, and a structural reversal in relative strength position gold as the leading asset. A sustained move above $4,000 would confirm this transition and open the way for an extended phase of long-term outperformance.
Gold Predictors Premium Membership
Get exclusive short-term and swing trade ideas with precise entry levels, stop-loss, and target prices, including justification and analysis — all delivered directly via WhatsApp.
Our premium service includes deep technical analysis on gold and silver markets. We cover cycle analysis, price forecasting, and key timing levels.
Members also receive a weekly market letter with detailed analysis, commentary from our Chief Analyst, including actionable insights, trade timing, and direction forecasts for gold and silver.
Stay ahead of the market — join our premium community today.