Gold Breaks Historic Resistance: Real and Nominal Breakouts Signal Long-Term Strength
Gold (XAUUSD) is consistently marking new records each month. This consistent bullish momentum indicates something big is developing. The gold-to-CPI ratio surged to a record high of 12.4, confirming gains in real terms. These developments highlight a structural shift that could define the next phase of gold’s bull market.
Gold Surpasses Key Historical Highs, Sets Stage for Multi-Year Advance
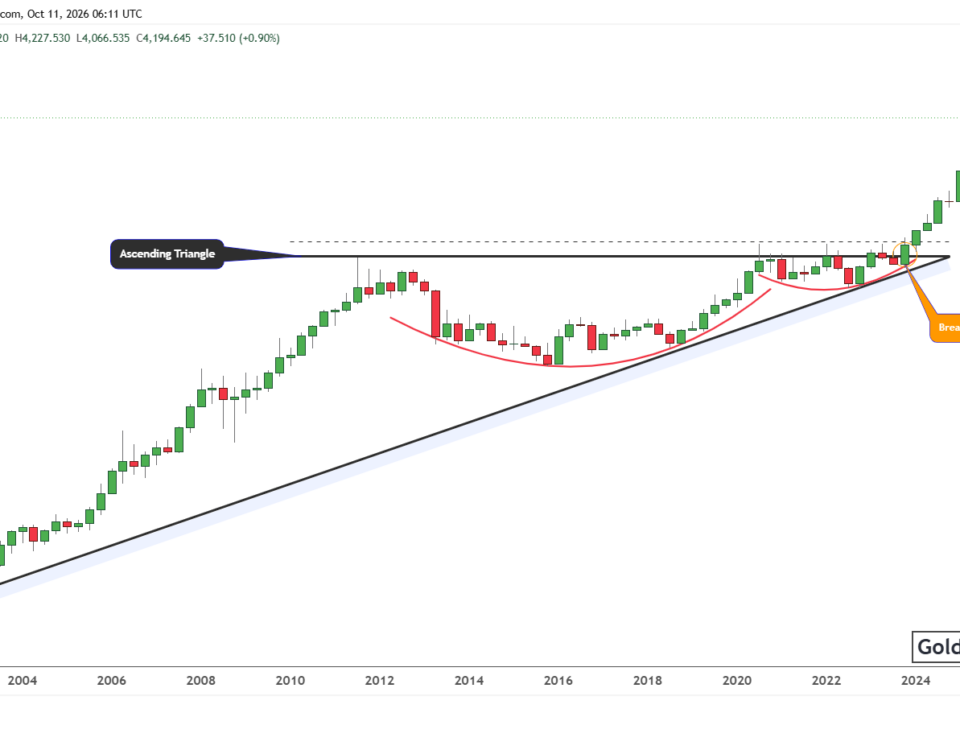
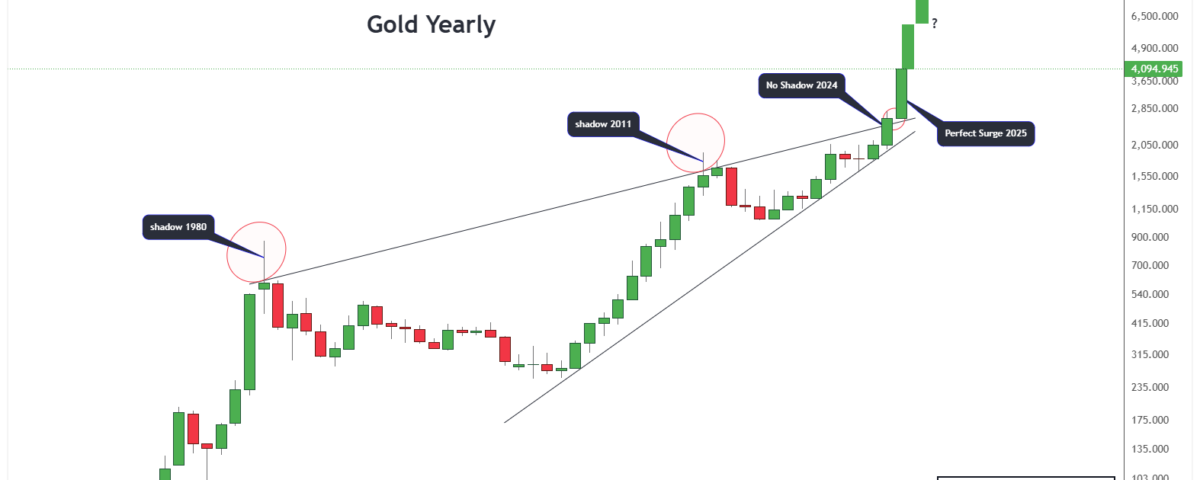
The gold chart below shows multiple breakout attempts at the resistance of the triangle. The 1980 candle showed a firm rejection from the highs, marked by a long upper shadow and unsustainable buying pressure. A similar wick formed in 2011, which also ended in a multi-year pullback. These wicks marked rejection from the same long-term resistance line.
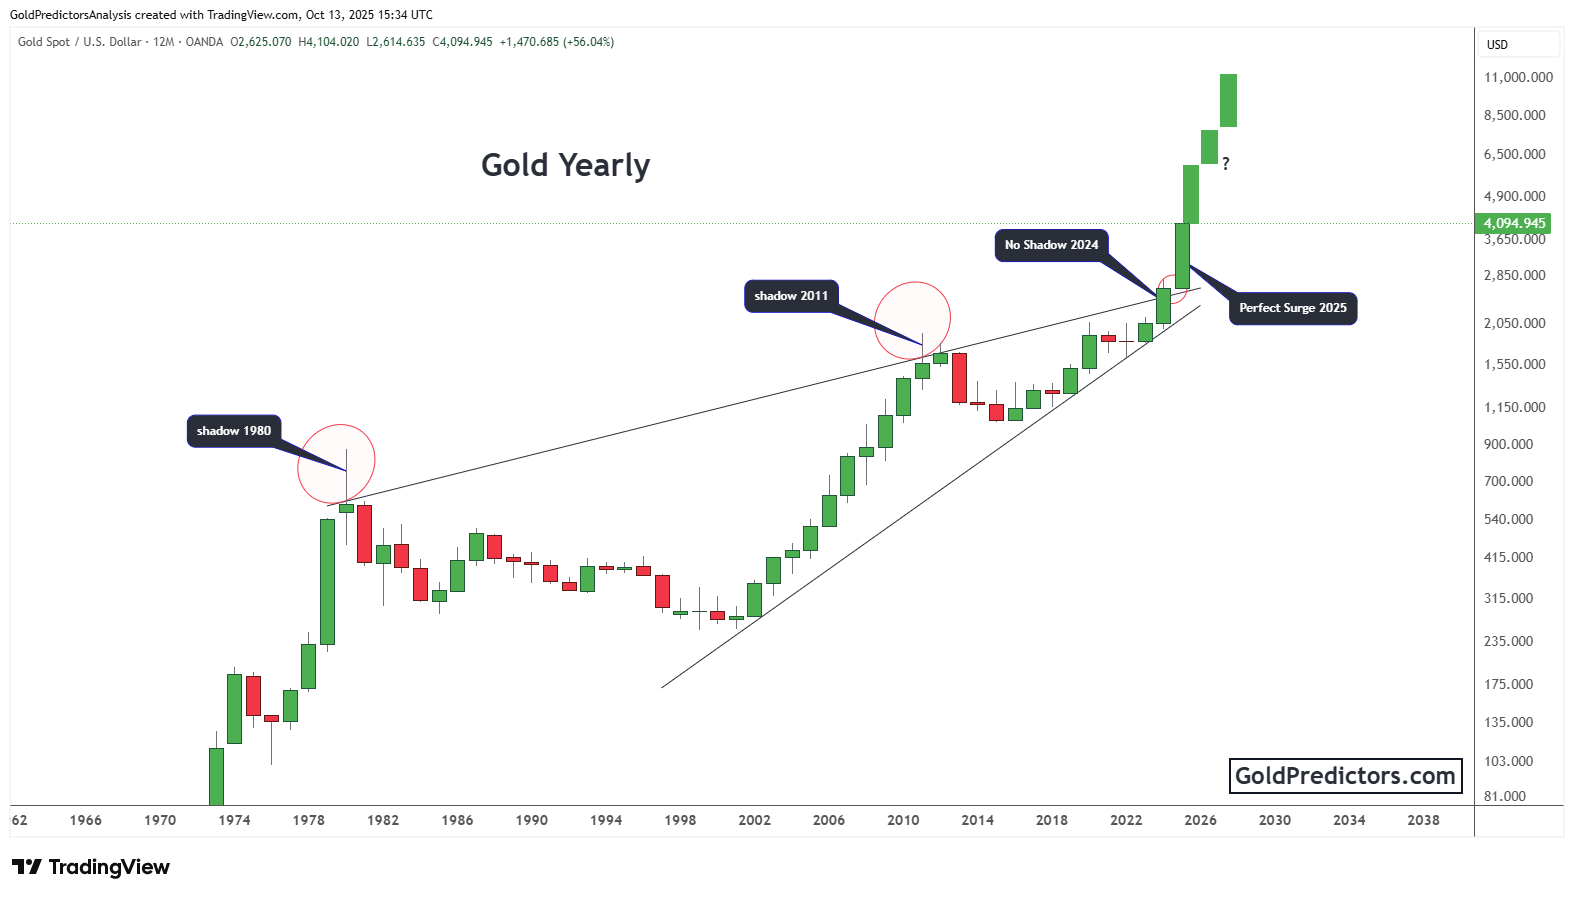
Unlike previous peaks, the 2024 candle closed near its high with no upper shadow, making it the first breakout year without rejection. This closing strength indicates a solid foundation of demand, not just a short-lived surge. The momentum carried into 2025, with gold extending its gains decisively. The 2025 candle extended the breakout with strength and indicates strong gains.
Consequently, the upper boundary of the wedge connecting the 1980 and 2011 peaks has now flipped into support. Gold is no longer fighting against long-term resistance. It is moving above it with momentum. The chart also points to the potential for gold to reach five-digit price levels in the years ahead. Although these are projections, the technical structure supports the bullish outlook.
Gold Outpaces Inflation as Real-Term Breakout Sets New All-Time High
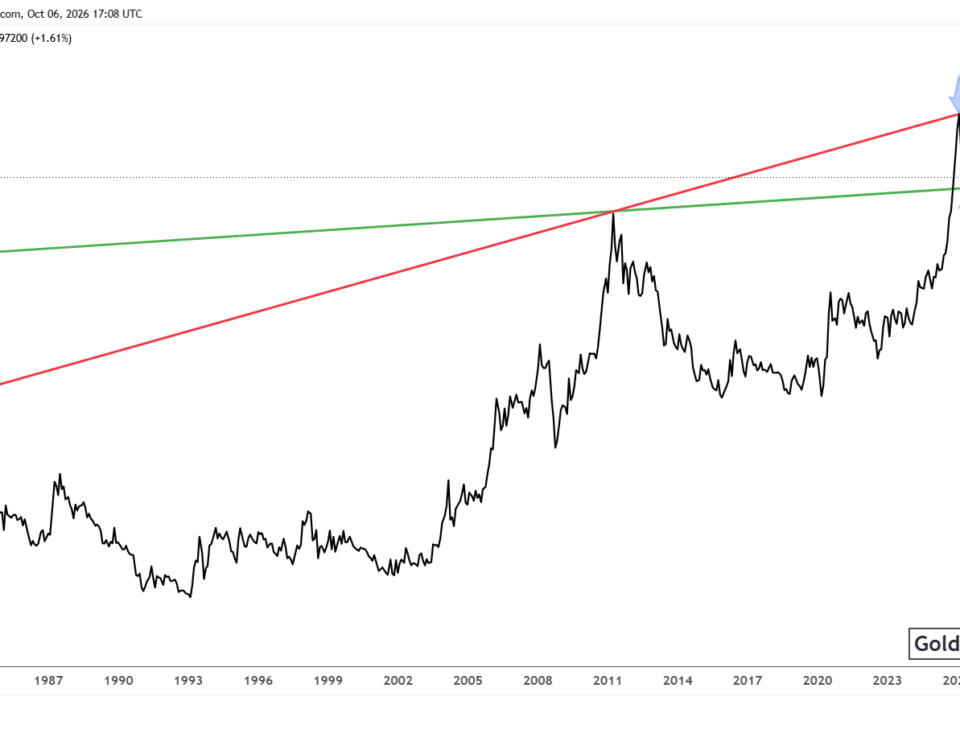
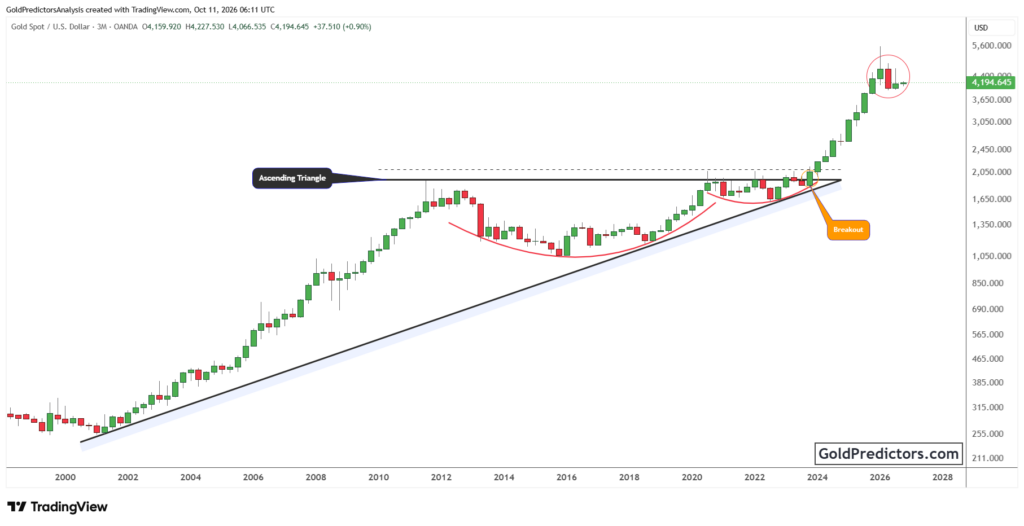
The chart below shows gold’s performance relative to the U.S. Consumer Price Index (CPI), using the XAUUSD/CPIAUCSL ratio to highlight its inflation-adjusted value over time. By adjusting for inflation, the chart offers a clearer view of gold’s true long-term purchasing power. Moreover, the chart shows a clear breakout from a multi-decade triangle formation. After breaking through the triangle’s upper trendline, gold advanced sharply beyond horizontal levels, setting a new real-term peak.

Currently, the ratio stands at 12.4, its highest level on record. This breakout confirms that gold is not keeping up with inflation but is gaining real, inflation-adjusted value. This shift reflects a meaningful change in market behaviour. When gold outperforms CPI by this margin, it reflects a deep loss of confidence in fiat currencies and a growing preference for hard assets.
Furthermore, the chart reveals rounded base formations that provided the structural foundation for gold’s breakout. This structure provided the groundwork for gold’s current breakout. This alignment of structural patterns points to continued strength and a durable upward trend. Historically, these formations often precede multi-year advances with accelerating momentum. With the ratio at its peak, gold’s inflation-adjusted targets point to further meaningful gains.
Conclusion: Gold’s Real and Nominal Strength Confirms Long-Term Bull Market
Gold is now moving through a decisive long-term breakout cycle. After decades of stalled rallies at historic resistance, the metal has finally broken through with conviction. The firm closed in 2024, and decisive follow-through in 2025 confirms that this advance reflects structural strength, not short-term hype. The upper boundary that capped rallies for decades has now turned into support, signalling a lasting shift in market dynamics.
Moreover, this perspective is further supported by the inflation-adjusted chart. In recent years, gold has outpaced inflation, confirming its rise in real purchasing power. The breakout in the gold-to-CPI ratio signals a change in market behaviour, as capital flows away from fiat currencies toward hard assets. This move represents more than a price rally and signals rising confidence in gold as a long-term store of value.
Overall, these charts confirm that gold is not just rallying but is undergoing a major structural shift. The confirmed breakouts in both nominal and real terms indicate that gold is entering a historically significant phase of long-term strength. If historical patterns repeat, this move could mark the beginning of a sustained multi-year trend. This shift positions gold as a central asset in a changing global financial system.
Gold Predictors Premium Membership
Get exclusive short-term and swing trade ideas with precise entry levels, stop-loss, and target prices, including justification and analysis — all delivered directly via WhatsApp.
Our premium service includes deep technical analysis on gold and silver markets. We cover cycle analysis, price forecasting, and key timing levels.
Members also receive a weekly market letter with detailed analysis, commentary from our Chief Analyst, including actionable insights, trade timing, and direction forecasts for gold and silver.
Stay ahead of the market — join our premium community today.