Silver Price Forecast: Is the Cup-and-Handle Breakout Still Intact?
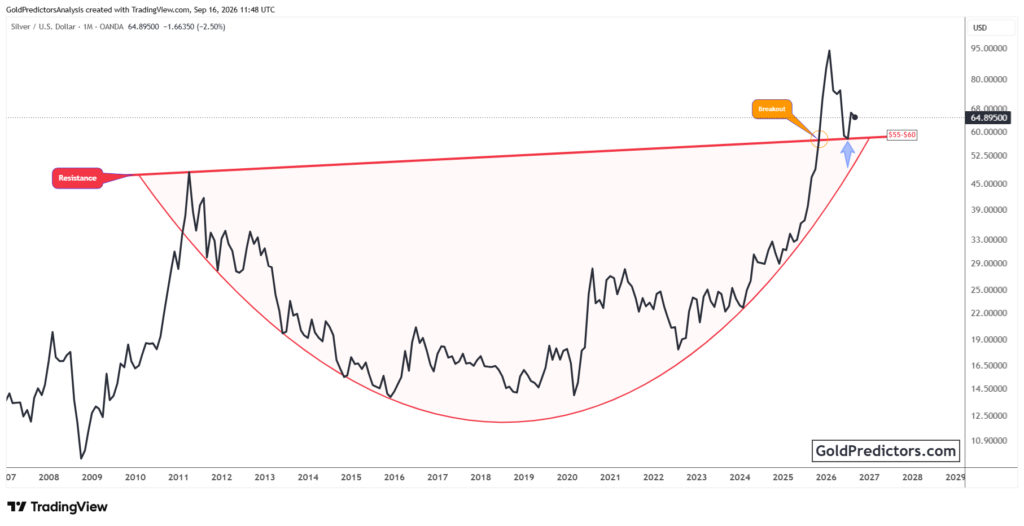
Silver (XAG/USD) continues to consolidate after completing a major long-term cup and handle breakout. The price remains well above the former resistance zone despite the correction from its record peak. This price action keeps the broader structure intact while silver builds support near the mid-$60s. The silver versus gold ratio also remains above its 0.0135 breakout level. These structures show that silver retains long-term strength, but the next move still requires confirmation.
Silver Market Outlook: PCE Inflation and US Jobs Data Keep Fed in Focus
Silver traded near $64.17 per ounce on September 27, with a daily gain of 0.70%. The price moved between $63.24 and $65.22. This stability followed a 3.5% weekly decline in New York silver futures to $64.80. Attention now turns to a busy US economic calendar. The market expects September nonfarm payrolls to increase by about 90,000. The unemployment rate may remain at 4.1%. Personal spending, PCE inflation, job openings, consumer confidence, GDP revisions, and manufacturing data will also shape expectations for the Federal Reserve’s October meeting.
The connection to silver is direct. The strong employment and firmer inflation could support another increase in interest rates and keep Treasury yields elevated. That environment may limit near-term strength because silver produces no income. Softer data could reduce some of that pressure. Geopolitical risks add another layer. The US-Iran standoff and uncertainty surrounding the Strait of Hormuz remain important for crude oil. The increase in energy costs could keep inflation concerns elevated, while diplomatic progress could ease pressure on oil and yields. US 10-year Treasury yields have already reached their highest level since 2007. Silver enters the new week between restrictive rate expectations and continued demand for defensive assets.
Silver Technical Analysis: Cup-and-Handle Breakout Remains Intact
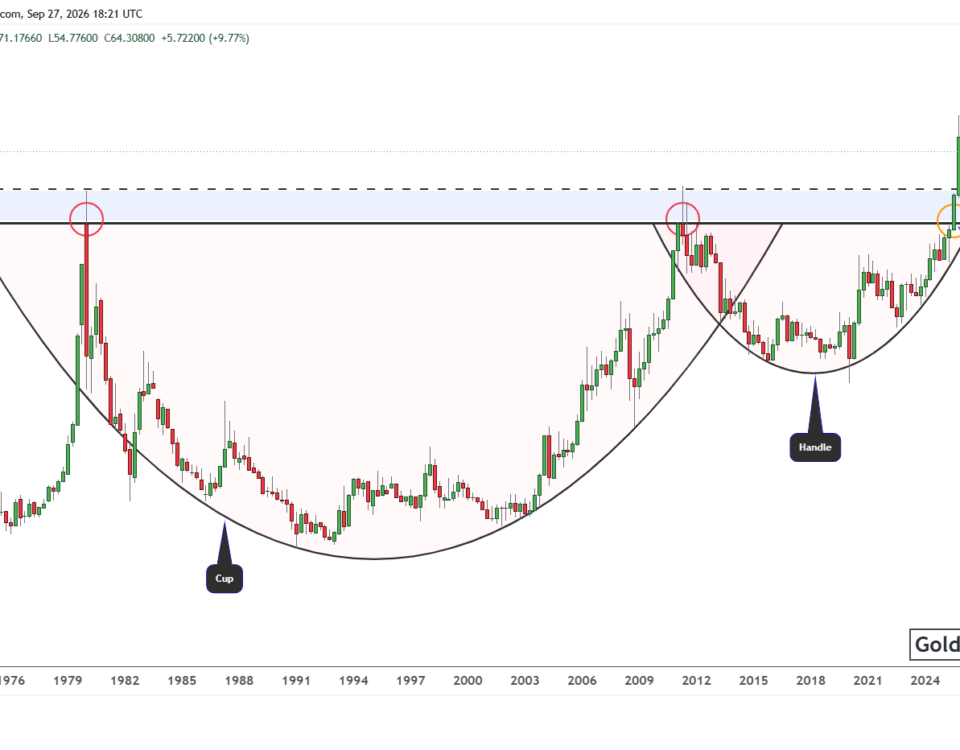
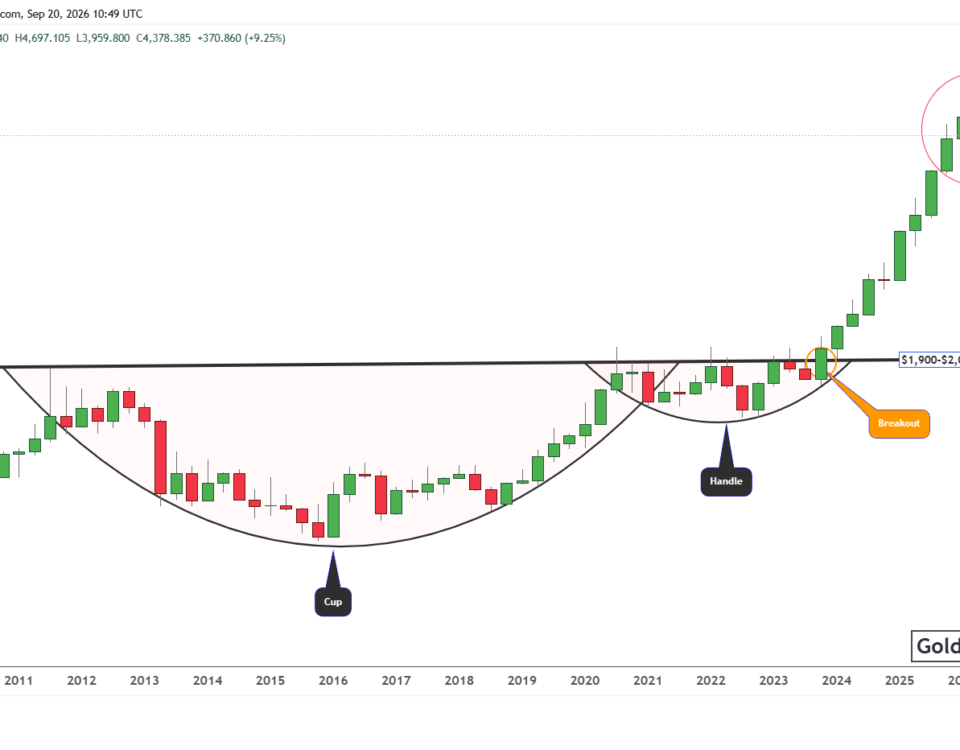
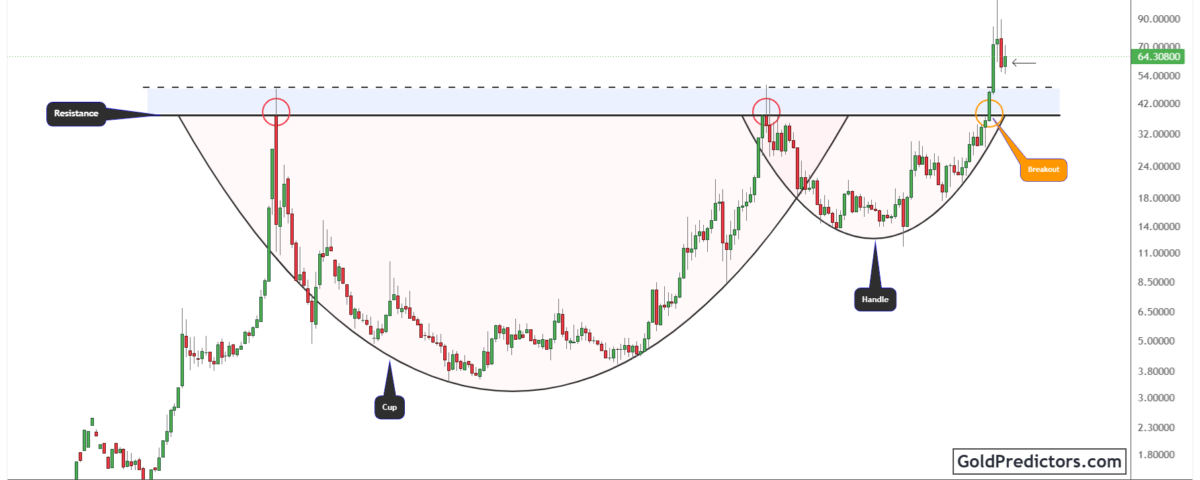
Silver developed a broad cup and handle formation over several decades. The cup began after resistance near the $40 region rejected the metal. The price then formed a rounded base before returning to the same resistance area. Another rejection created the handle. This phase allowed silver to consolidate below resistance while preserving its long-term recovery.
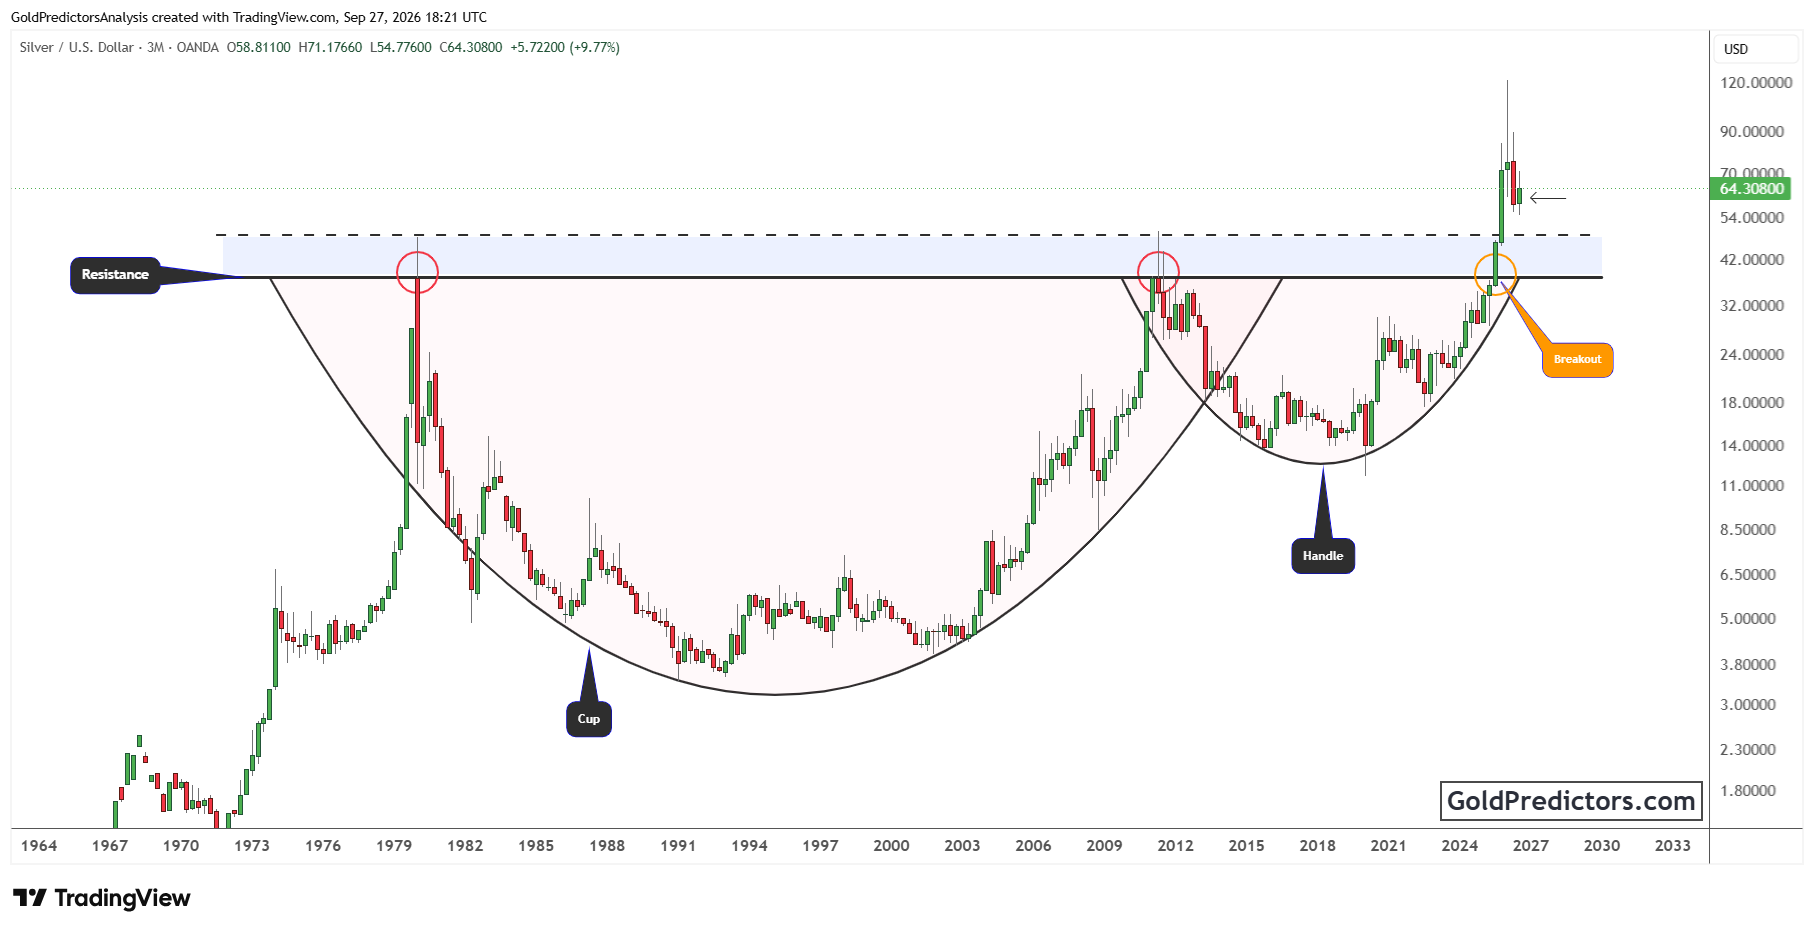
The eventual breakout carried silver through the long-standing resistance zone between roughly $35 and $50. The price then accelerated into record territory before experiencing a sharp correction. Silver is currently trading near $64. This places it comfortably above the former resistance area. The $55 to $60 region now provides the nearest support. The broader zone between $44 and $50 remains the main structural support for the cup and handle breakout.
The recent high near $71 represents the first important level on the upside. A sustained move above the $70 to $72 region could strengthen momentum and bring the $80 area into focus. Continued strength beyond that point could eventually shift attention toward the previous peak. But a move below $55 would increase the chance of a deeper retest toward the $50 to $44 area. The long-term structure remains positive while silver holds above its former breakout zone.
Silver-to-Gold Ratio Stabilizes Above Key Technical Support
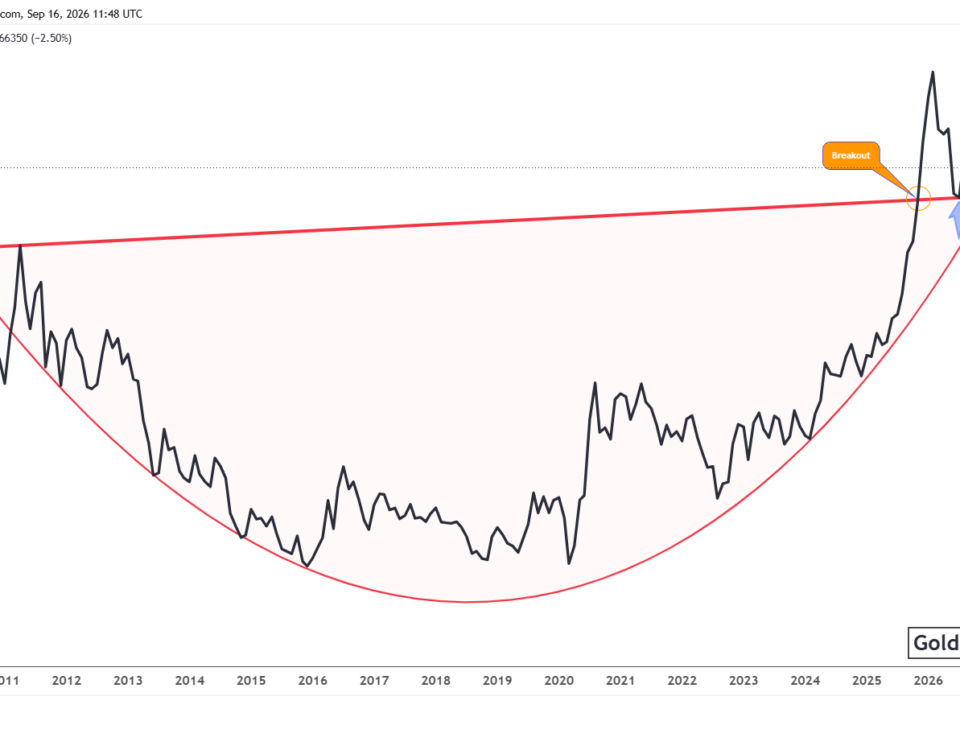
The silver versus gold ratio recently moved above the important 0.0135 resistance level. This area had limited the ratio several times. The breakout carried it toward 0.018 before a correction developed. The ratio then returned toward 0.014 but remained above its former resistance. It is now trading near 0.01501.
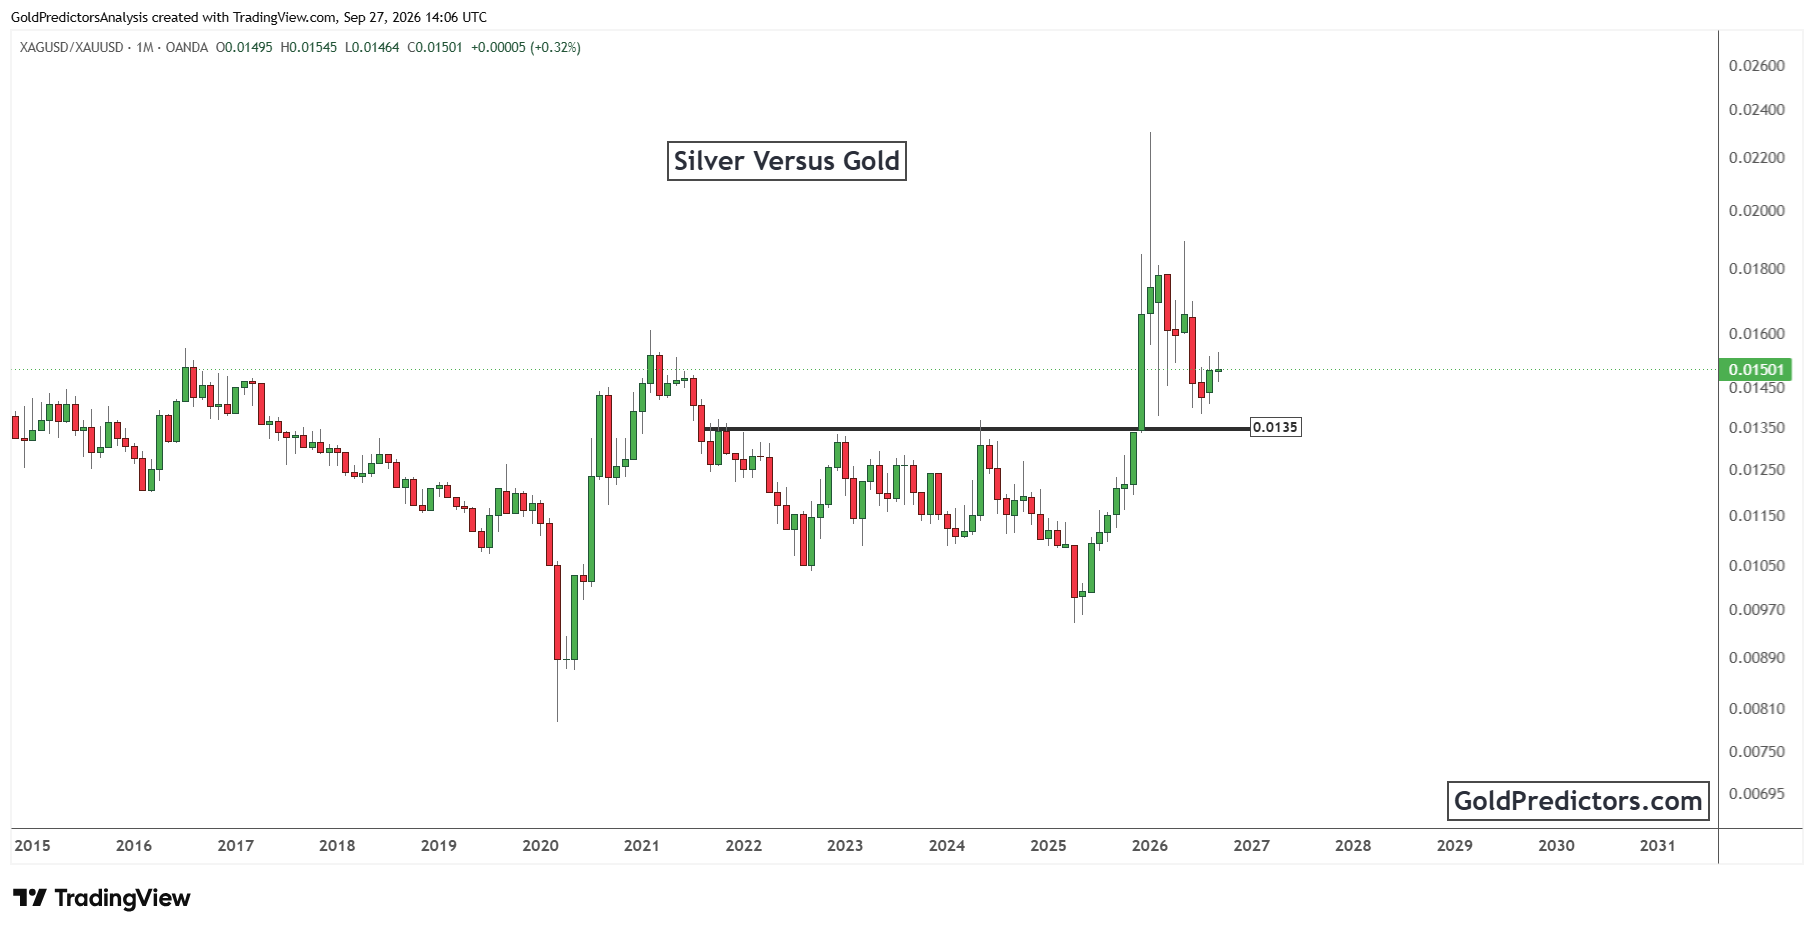
A rising ratio means silver is performing better than gold. Its position above 0.0135 suggests that the relative strength of silver remains intact despite the recent correction. A sustained move above the 0.0155 to 0.0160 region could improve the structure and bring 0.018 back into focus. In contrast, a monthly move below 0.0135 would weaken the breakout and indicate that gold is regaining relative strength.
Confirmation from both structures would provide a clearer signal. If silver moves above $70 to $72 while the ratio also strengthens, the move would reflect improving silver performance rather than strength across precious metals alone. If silver rises while the ratio weakens, the move may depend more heavily on gold. Watching both structures helps separate broad precious-metal strength from silver-specific momentum.
Silver Price Outlook: Long-Term Breakout and Ratio Remain Intact
Silver’s long-term cup and handle breakout remains intact while price holds above the former resistance zone. The $55 to $60 area provides the nearest support, while $70 to $72 remains the key region for renewed strength. The silver versus gold ratio also supports the broader outlook as long as it stays above 0.0135. US employment data, inflation readings, Treasury yields, and oil prices may create short-term volatility. A confirmed move above recent resistance could bring the $80 area into focus, while a decline below $55 could lead to a wider retest of the long-term breakout zone.
Gold Predictors Premium Membership
Get exclusive short-term and swing trade ideas with precise entry levels, stop-loss, and target prices, including justification and analysis — all delivered directly via WhatsApp.
Our premium service includes deep technical analysis on gold and silver markets. We cover cycle analysis, price forecasting, and key timing levels.
Members also receive a weekly market letter with detailed analysis, commentary from our Chief Analyst, including actionable insights, trade timing, and direction forecasts for gold and silver.
Stay ahead of the market — join our premium community today.