


Gold Price Soars Above Key Resistance with Bull Flags Supporting the Rally
Gold (XAUUSD) is showing renewed strength as it breaks above multi-year resistance and confirms a decisive technical breakout. This breakout follows a long period of consolidation and has been supported by strong continuation patterns, including bull flags.
At the same time, gold has also outperformed inflation when measured against producer price data, reinforcing its real value strength. Together, these signals confirm a strong and durable uptrend backed by technical momentum and real-value strength.
Gold Breaks Multi-Year Resistance with Bull Flag Patterns Reinforcing Uptrend
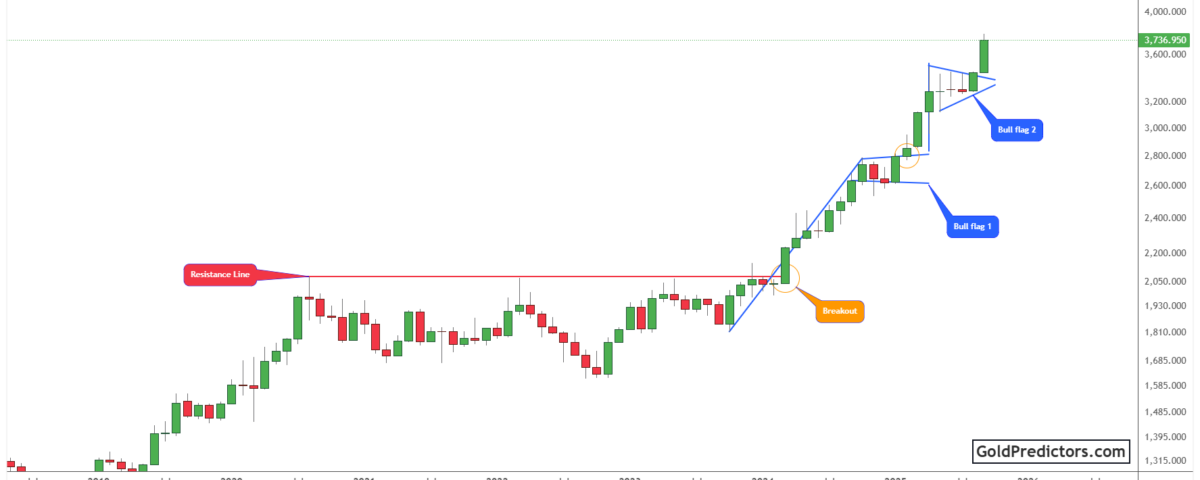
The gold chart below shows a prolonged consolidation phase that ultimately led to a decisive breakout. During this period, price action remained capped beneath a horizontal resistance zone that had held firm since mid-2020. Despite several failed attempts to breach this level, gold eventually broke above it in early 2024. The breakout sparked a sharp rally, signalling the start of a sustained bullish phase and an apparent change in long-term market outlook.
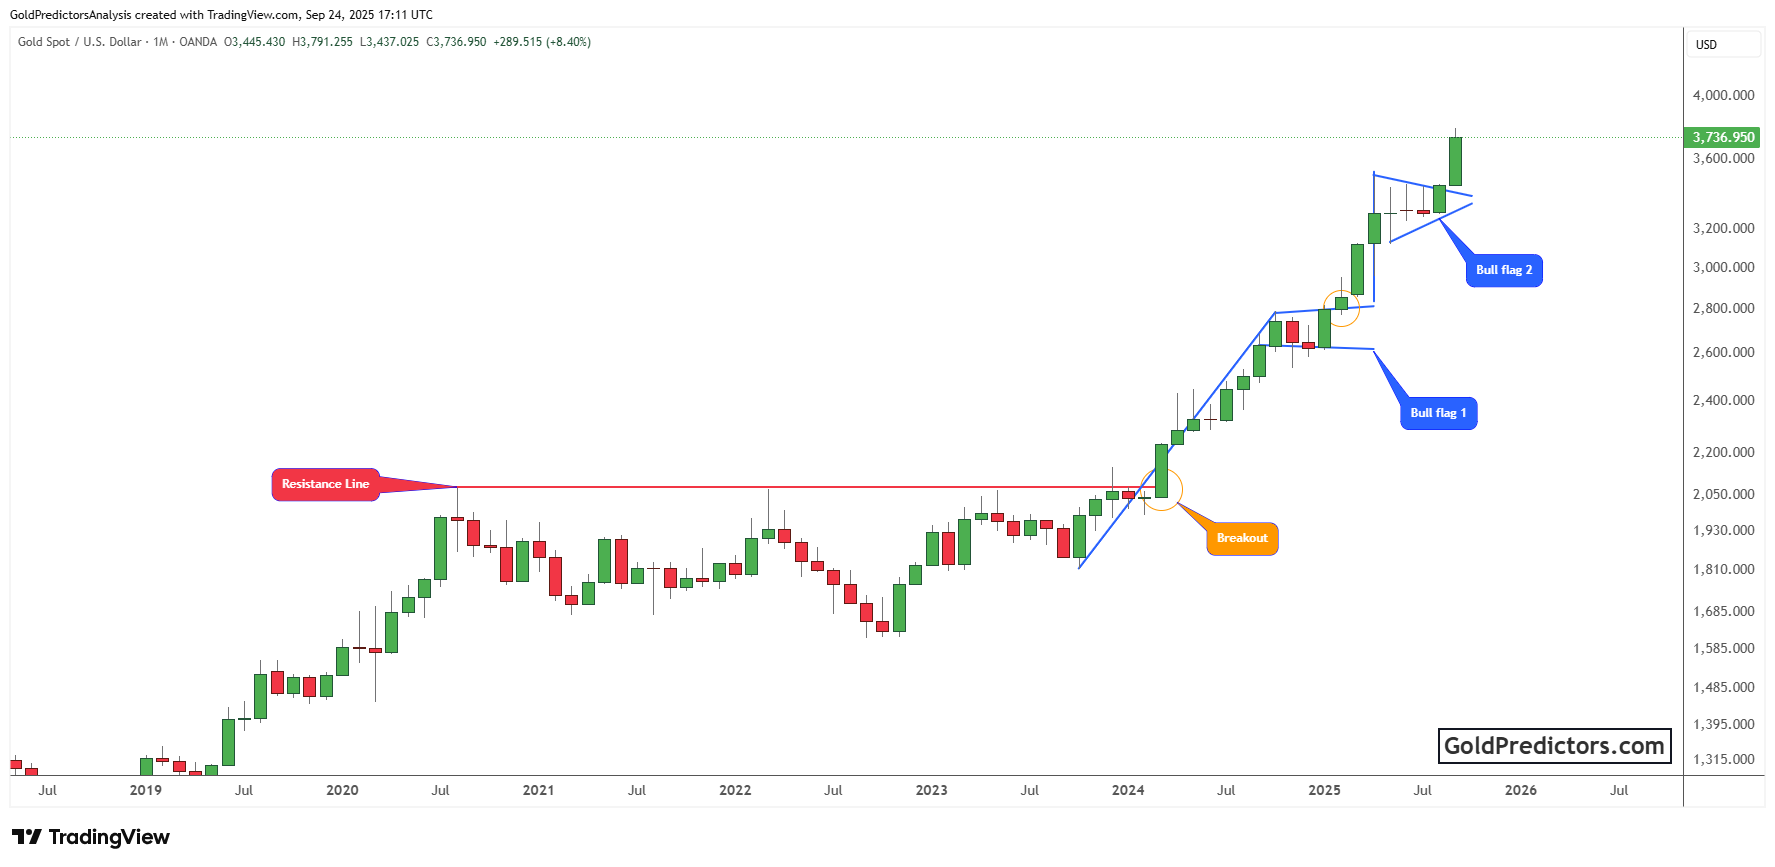
Following this breakout, gold formed two classic bull flag patterns. Specifically, the first flag appeared in mid-2024 and acted as a temporary consolidation before the next move higher. Afterwards, the price continued its upward trajectory.
Later in 2025, a second bull flag developed, reflecting ongoing strength in the trend. This structure also served as a consolidation phase. The most recent monthly candle shows a sharp upward breakout from the pattern, signalling the start of a new impulsive leg.
Consequently, these bull flag formations represent classic continuation patterns that reflect strong underlying demand. In each case, the rally has been followed by orderly consolidation, indicating strong market structure and sustained buying interest.
The repeated sequence of breakout and consolidation has steadily built a stronger bullish structure. Most recently, the latest monthly candle gained 8%, adding strength to the ongoing bullish momentum. Taken together, these signals point to a well-supported trend with potential for further upside.
Gold’s Inflation-Adjusted Breakout Signals Strong Outperformance vs. Producer Prices
The chart below shows gold’s performance relative to producer price inflation (XAUUSD/PPIACO), offering a clear view of its real purchasing power over time. This ratio serves as a reliable long-term indicator of gold’s true strength, particularly during periods of rising input costs.
Historically, the ratio has highlighted periods when gold outperformed inflation, delivering absolute returns. This highlights gold’s true economic strength, despite short-term fluctuations.
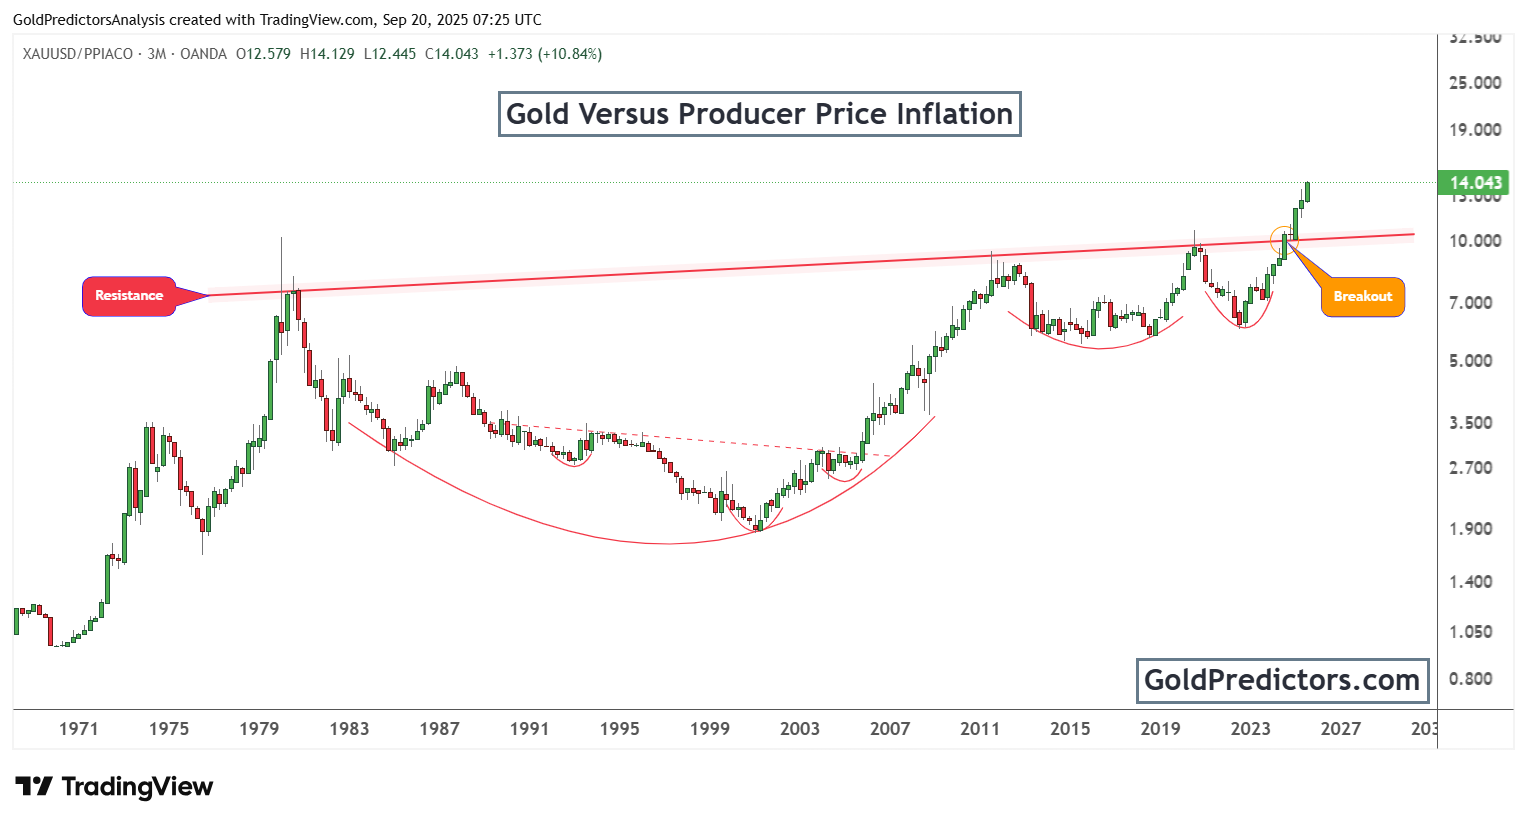
Recently, a major breakout has emerged in the gold-to-PPI ratio, marking a critical technical shift. A long-standing resistance line that had repeatedly capped major rallies was finally breached in a decisive breakout. This decisive move above multi-decade resistance signals a significant change in gold’s inflation-adjusted strength. It also points to the beginning of a renewed long-term uptrend.
Additionally, the chart reveals a massive cup-and-handle formation spanning multiple decades, supported by several smaller rounded bottoms at its base. This classic bullish structure is recognised for generating strong upward moves once the neckline is breached. With the breakout now confirmed, gold appears poised to continue outperforming inflation at an accelerated pace. This reinforces gold’s role as a long-term store of wealth, especially in inflationary and uncertain economic environments.
Gold Outlook: Technical Breakout and Real Value Growth Support Sustained Bull Run
Gold has confirmed a major structural breakout, both in nominal and inflation-adjusted terms. Specifically, price action shows a clean move above multi-year resistance, followed by strong continuation patterns, such as bull flags. These developments signal clear bullish momentum and rising investor confidence in gold’s long-term trajectory. This combination of breakout strength and technical follow-through sets the stage for a sustained upward cycle.
At the same time, the breakout in the gold-to-PPI ratio highlights real value growth. Notably, gold is not only rising in price but also outperforming inflation, making it more than just a hedge against inflation. In particular, it highlights gold’s real purchasing power growth, reinforced by a multi-decade cup-and-handle breakout. This reinforces gold’s role as a strategic asset for long-term wealth preservation in inflationary environments.
Consequently, the alignment of technical momentum and inflation-adjusted gains suggests a robust and sustained uptrend for gold. The metal remains well-positioned to perform in a climate defined by elevated inflation, weak central bank response, and broader economic uncertainty. These conditions continue to support long-term demand for gold as both a growth asset and a store of real value.
Gold Predictors Premium Membership
Get exclusive short-term and swing trade ideas with precise entry levels, stop-loss, and target prices, including justification and analysis — all delivered directly via WhatsApp.
Our premium service includes deep technical analysis on gold and silver markets. We cover cycle analysis, price forecasting, and key timing levels.
Members also receive a weekly market letter with detailed analysis, commentary from our Chief Analyst, including actionable insights, trade timing, and direction forecasts for gold and silver.
Stay ahead of the market — join our premium community today.


