


Gold (XAUUSD) Enters Bullish Supercycle After Historic Breakout Against US Equities
Gold (XAUUSD) is showing strong momentum as it breaks out of decades-long resistance levels. This breakout signals the start of a powerful bullish trend. Historical and technical data support a long-term parabolic move. At the same time, gold is gaining strength against US equities. These shifts reflect growing investor demand for safe-haven assets amid inflation and global uncertainty. This article analyses the key charts and technical patterns that signal gold’s entry into a potential long-term supercycle.
Historic Gold (XAUUSD) Breakout Points to Multi-Decade Bullish Supercycle
The gold chart below shows a multi-decade view of gold’s price movement since 1949. Historical price action highlights key consolidation phases, followed by periods of rapid growth. Most notably, gold has decisively broken above a long-term resistance line drawn from previous peaks. This breakout is not a short-term event, but rather part of a massive parabolic structure that has been forming over several decades.
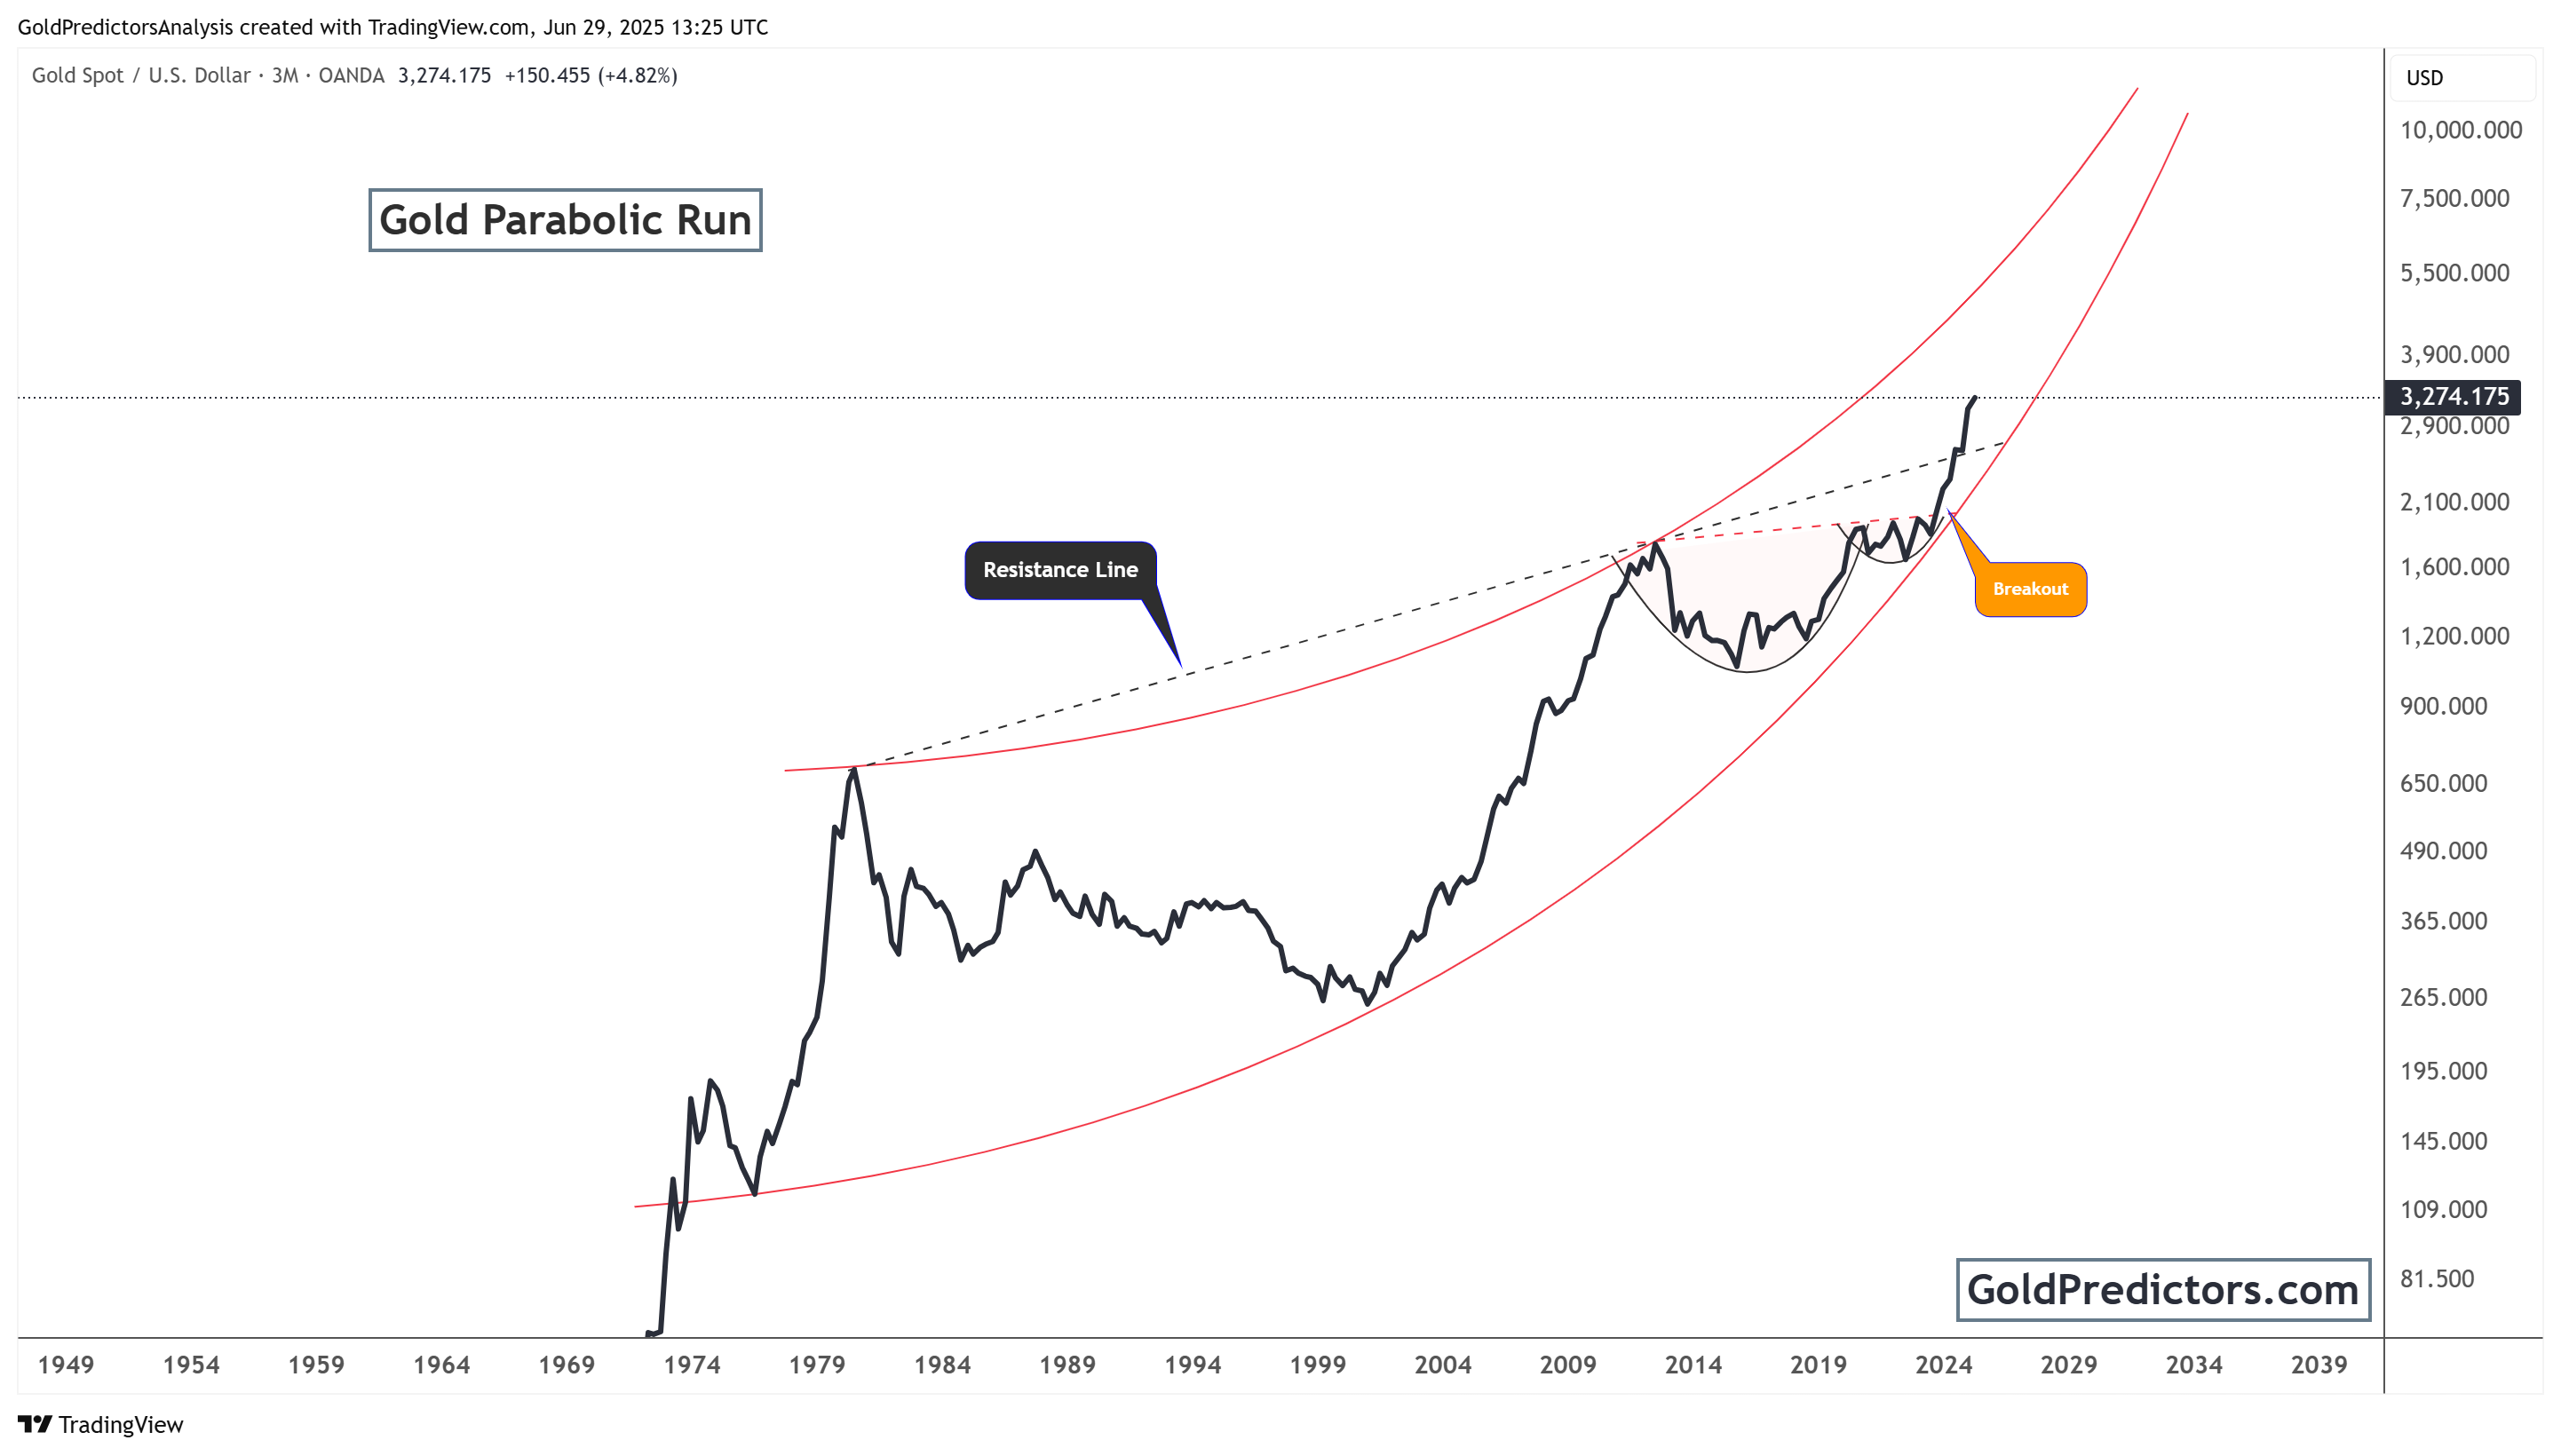
The parabolic arc drawn in red shows the long-term acceleration in gold’s price. The breakout occurred after a prolonged consolidation between 2011 and 2023, which formed a large cup pattern. This pattern often precedes massive bullish breakouts. Currently, gold is trading around $3,274, up over 4.8%, which confirms intense buying pressure and a new bullish phase.
Technical projections using the parabola suggest that gold could reach much higher levels in the next few years. Potential targets range between $6,000 and $8,000, depending on the intensity of the current bull run. The broader economic environment, characterised by high inflation, weakening fiat currencies, and escalating geopolitical tensions, supports this technical setup.
Gold-to-Equities Ratio Forms Bullish Pattern, Signals Outperformance Ahead
The chart below compares gold’s performance against the S&P 500, illustrated by the XAUUSD/SPX ratio. This chart indicates a significant shift in investor behaviour. Since the late 1990s, gold has lagged behind the stock market. However, the ratio has formed a large, rounded bottom or “cup” over the last decade.
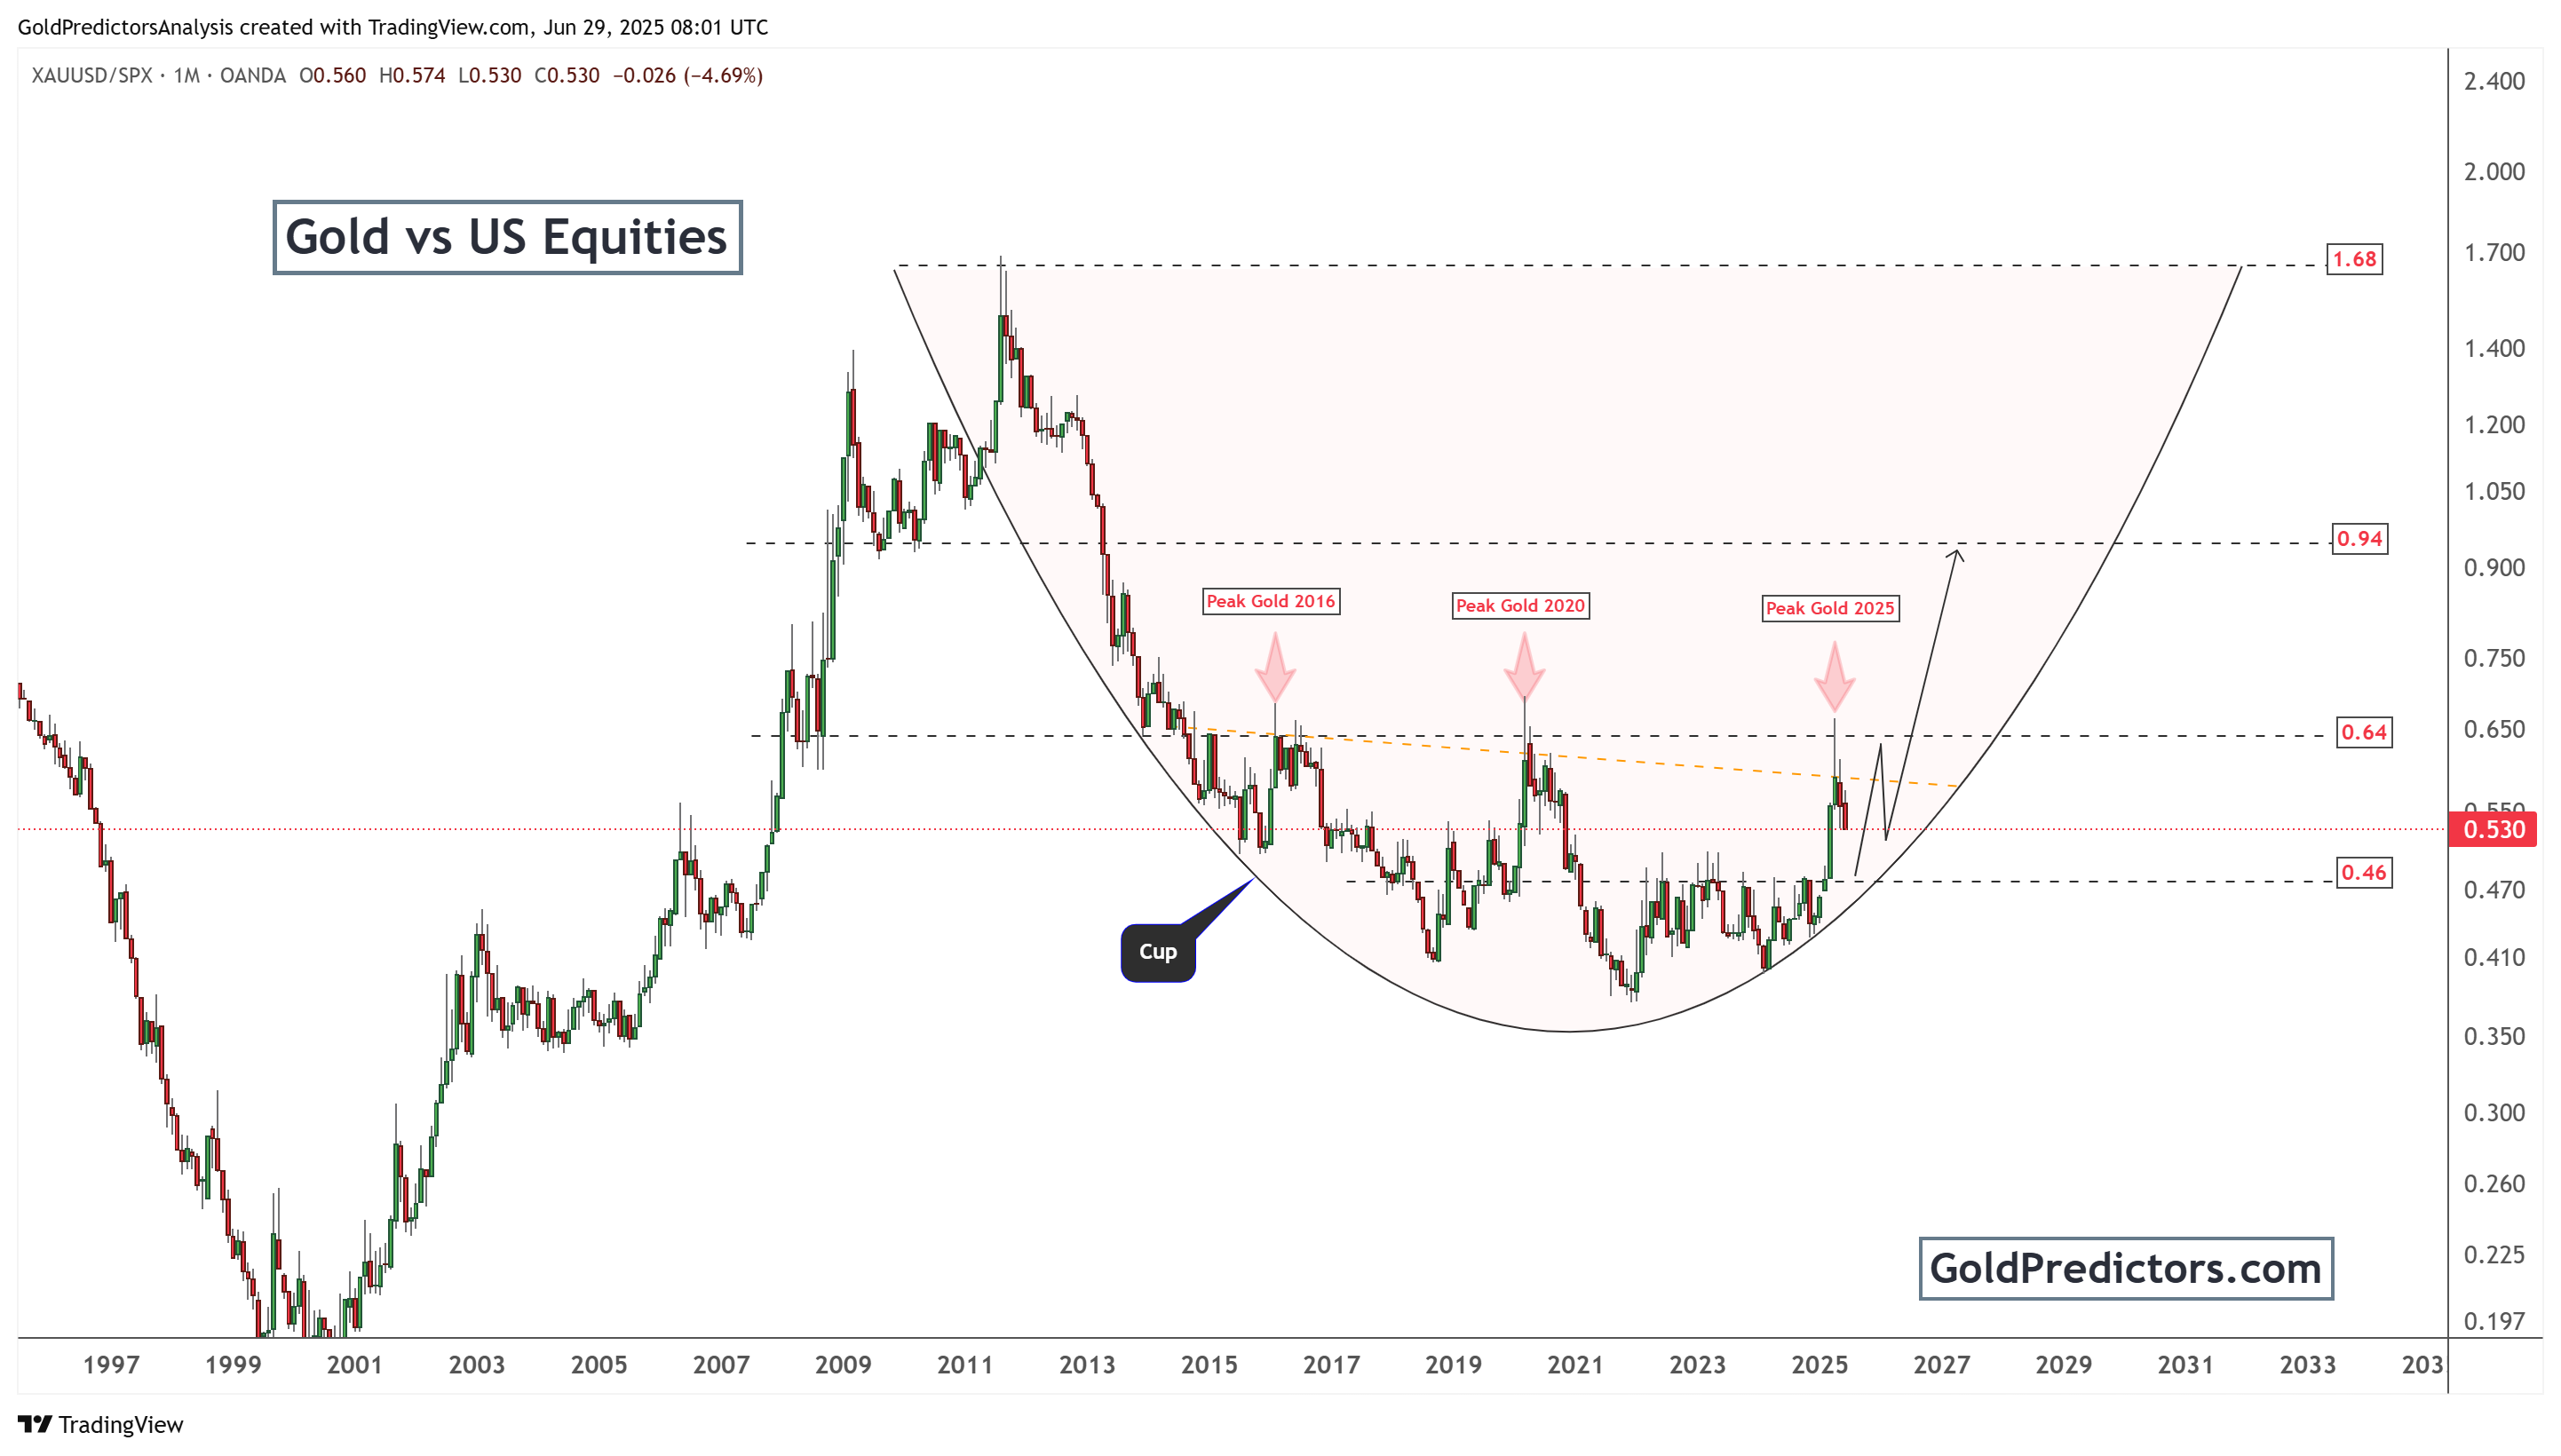
This formation reflects a period of consolidation and value accumulation in gold relative to US equities. Marked peaks in 2016 and 2020 created interim highs, but the recent 2025 breakout attempt marks a shift. While gold’s relative strength has pulled back slightly, the pattern suggests the next leg up could take the ratio as high as 0.94 or even 1.68 in the long term.
Such a movement would imply that gold is outperforming stocks at an accelerating rate. It typically occurs during periods of declining real yields, rising inflation, or increased risk aversion. The chart indicates that investors are gradually shifting from overvalued equities to undervalued hard assets, such as gold. If this trend continues, it would mark a once-in-a-generation shift in capital allocation.
Conclusion: Why Gold Could Lead in the Next Global Investment Cycle?
Gold has reasserted itself as a dominant force in global markets. Its breakout from long-term resistance levels and the formation of a multi-decade parabolic structure signal a powerful bullish supercycle. This move is not driven by short-term speculation but by deep-rooted shifts in economic fundamentals, investor sentiment, and historical momentum.
The ratio chart comparing gold to US equities strengthens this bullish narrative. A long-term cup formation in the gold-to-S&P 500 ratio reflects gold’s rising appeal as investors reevaluate risk and value. As this pattern unfolds, it suggests a potential surge in gold’s relative performance, particularly during periods of monetary instability and geopolitical tension.
Together, these technical and fundamental signals suggest that gold is entering a new era. Investors are responding to inflation, currency debasement, and equity overvaluation by rotating into hard assets. If the current trends continue, gold could not only outperform equities but also reshape global asset allocation strategies for years to come.
Gold Predictors Premium Membership
Get exclusive short-term and swing trade ideas with precise entry levels, stop-loss, and target prices, including justification and analysis — all delivered directly via WhatsApp.
Our premium service includes deep technical analysis on gold and silver markets. We cover cycle analysis, price forecasting, and key timing levels.
Members also receive a weekly market letter with detailed analysis, commentary from our Chief Analyst, including actionable insights, trade timing, and direction forecasts for gold and silver.
Stay ahead of the market — join our premium community today.


