


Silver Price Breaks Decade-Long Resistance as Silver-to-Palladium Ratio Reverses Higher
Silver (XAGUSD) has entered a decisive new phase after breaking above a long-standing resistance zone. Price cleared the $50 barrier that capped advances for more than a decade. This breakout confirms the completion of a massive base formation and signals a structural shift into a higher range. At the same time, the silver-to-palladium ratio shows silver beginning to outperform after years of relative underperformance. This combination of structural breakout and improving relative strength frames silver as a leading asset within the current precious metals cycle.
Silver Breaks above Long-Term Resistance after Massive Base Formation
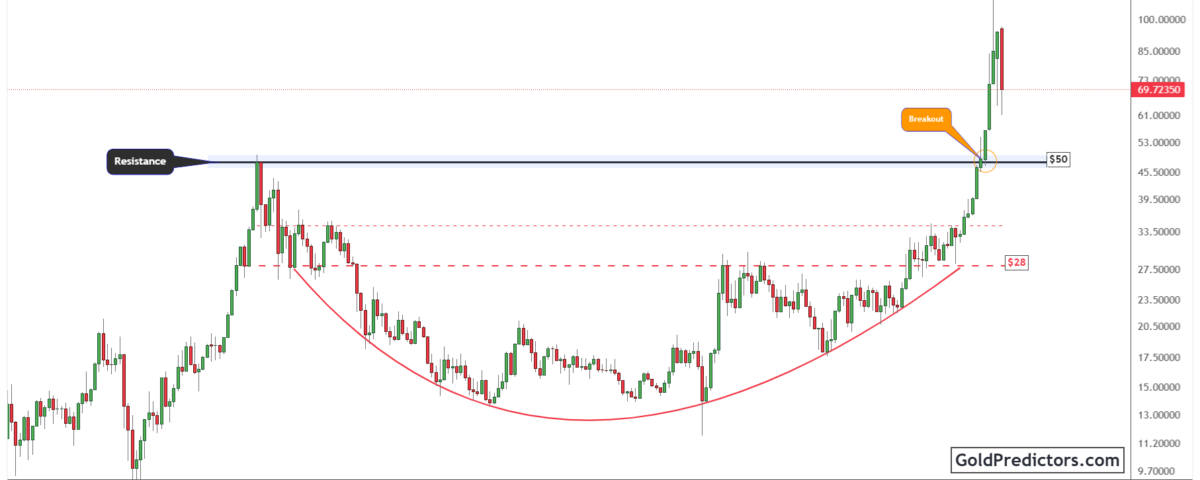
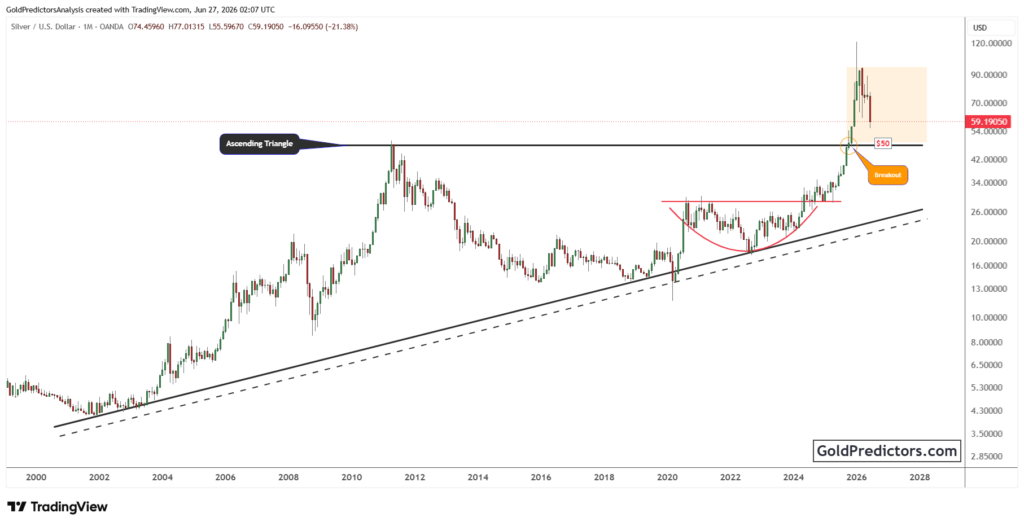
The silver chart below shows a broad long-term cup formation that developed over more than a decade. Price approached the $50 region in 2011 before entering a prolonged corrective phase. Between 2012 and 2025, price gradually stabilized and formed the rounded base of the cup. This structure reflects sustained accumulation and the steady absorption of supply. As the base developed, price established a stable foundation that prepared the market for the next expansion phase.
After stabilizing near the lower end of the base, silver began forming higher lows. The $28 zone acted as interim resistance for several years. Price consolidated beneath this level before breaking higher. Momentum accelerated as silver cleared successive resistance zones and built a constructive advance. Pullbacks remained shallow and found support at progressively higher levels, signaling firm acceptance of elevated prices.
The clear breakout above the $50 barrier signals a significant structural shift. Price advanced sharply after overcoming this multi-year ceiling before experiencing a brief pullback. The former resistance zone now acts as support, helping stabilize price during the recent retracement. This behavior keeps the broader structure constructive and suggests that the market is establishing a base above the breakout area. As long as the price holds above the $50 region, the structure points to the early stage of a new expansion phase. This shift suggests that silver has moved from prolonged consolidation into a sustained long-term uptrend.
Silver Outperforms Palladium as Ratio Breaks Long-Term Downtrend
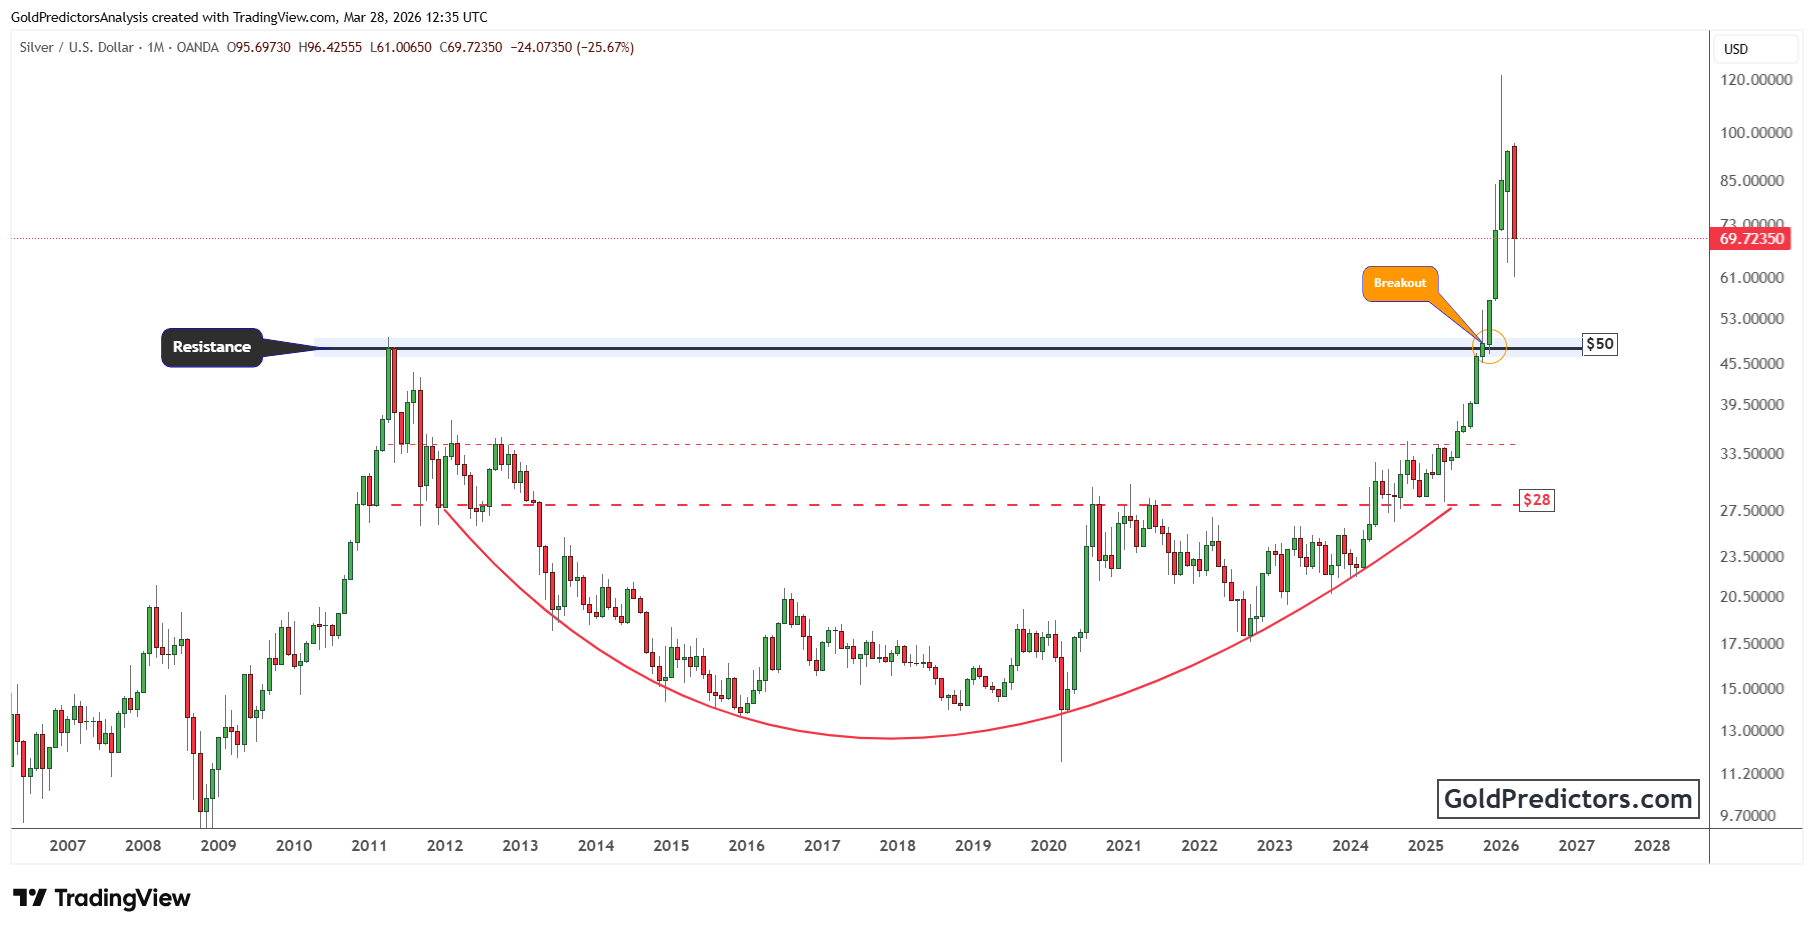
The chart below shows the silver versus palladium ratio on the monthly timeframe, highlighting the shifting relative strength between the two metals. For more than a decade, the ratio traded within a descending broadening wedge, defined by a sequence of lower highs and lower lows. This structure reflected sustained relative weakness in silver, as palladium outperformed throughout that period.
Over time, the ratio began to stabilize near the lower boundary of the wedge. Price then formed a series of higher lows, signaling strengthening relative momentum. A consolidation phase developed before the advance, indicating accumulation as pressure built beneath descending resistance. The decisive break above this level marked a clear structural transition and confirmed that silver had begun to outperform palladium.
Following the breakout, the price developed a wedge consolidation just above former descending resistance. This pattern reflected bullish compression rather than weakness. Once price cleared the wedge boundary, momentum expanded again. The latest surge confirms sustained relative strength. When a ratio transitions from extended underperformance into expansion, it typically coincides with strong absolute gains in the leading asset.
Silver Outlook: Structural Breakout and Relative Strength Support Higher Levels
Silver has cleared a multi-decade resistance zone and stabilized at higher levels. The breakout above $50 confirms the completion of a long-term accumulation cycle that began after the 2011 peak. A subsequent pullback has held above former resistance, signaling acceptance of higher prices. As long as silver holds above $50, the broader trend favors continuation rather than reversal.
At the same time, the silver-to-palladium ratio has broken a prolonged downtrend and entered a new expansion phase. This shift signals improving intermarket positioning and highlights silver’s strengthening role within the precious metals complex. As long as the ratio trends higher, it strengthens the case for continued upside in silver.
This alignment between structural breakout and relative outperformance strengthens the long-term outlook. Short-term pauses or consolidations may occur after a sharp advance, yet the broader technical framework remains constructive. Silver has shifted into a higher growth phase, and the current setup supports continued upside as long as key breakout levels remain intact.
Gold Predictors Premium Membership
Get exclusive short-term and swing trade ideas with precise entry levels, stop-loss, and target prices, including justification and analysis — all delivered directly via WhatsApp.
Our premium service includes deep technical analysis on gold and silver markets. We cover cycle analysis, price forecasting, and key timing levels.
Members also receive a weekly market letter with detailed analysis, commentary from our Chief Analyst, including actionable insights, trade timing, and direction forecasts for gold and silver.
Stay ahead of the market — join our premium community today.

