


Silver Breaks Long-Term Compression as Dollar-to-Silver Ratio Turns Lower
Silver (XAGUSD) has exited a prolonged period of compression after breaking decisively above a series of symmetrical triangle formations. Price has pushed above former resistance and shifted into a higher range. The breakout marks a clear change in behavior after years of contraction. At the same time, the U.S. Dollar versus silver ratio has turned lower after breaking a long-term rising structure. These developments signal a structural transition, with the broader long-term setup favoring continued expansion despite possible short-term pauses.
Silver Resolves Multi-Decade Triangle Patterns with Confirmed Breakout
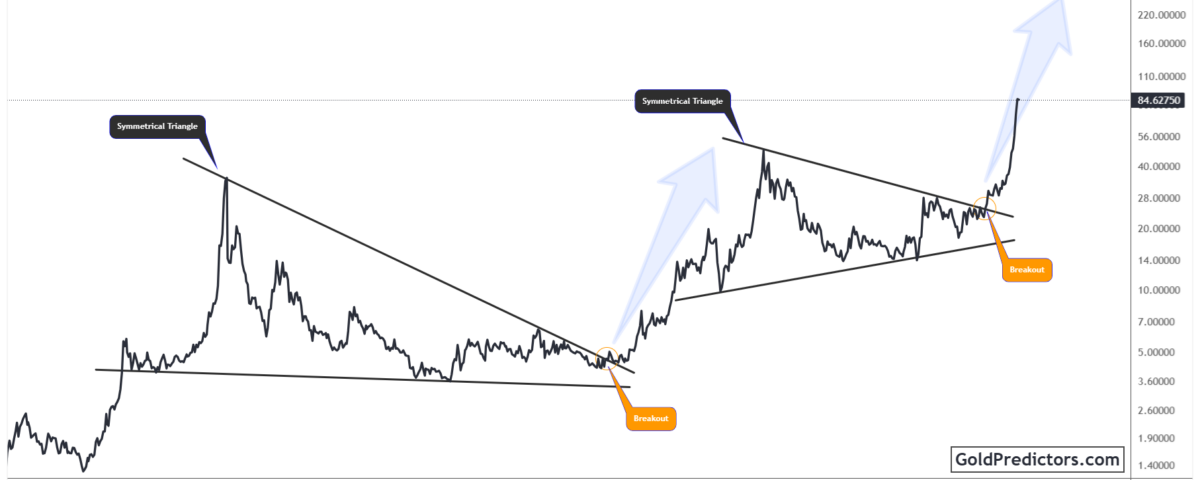
The silver chart below shows a series of symmetrical triangle formations across multiple cycles. A major triangle formed after the 1980 peak and compressed the price for two decades. That structure resolved to the upside in the early 2000s, marking an exit from prolonged contraction. The breakout launched a new secular phase that carried silver into a sustained multi-year advance.
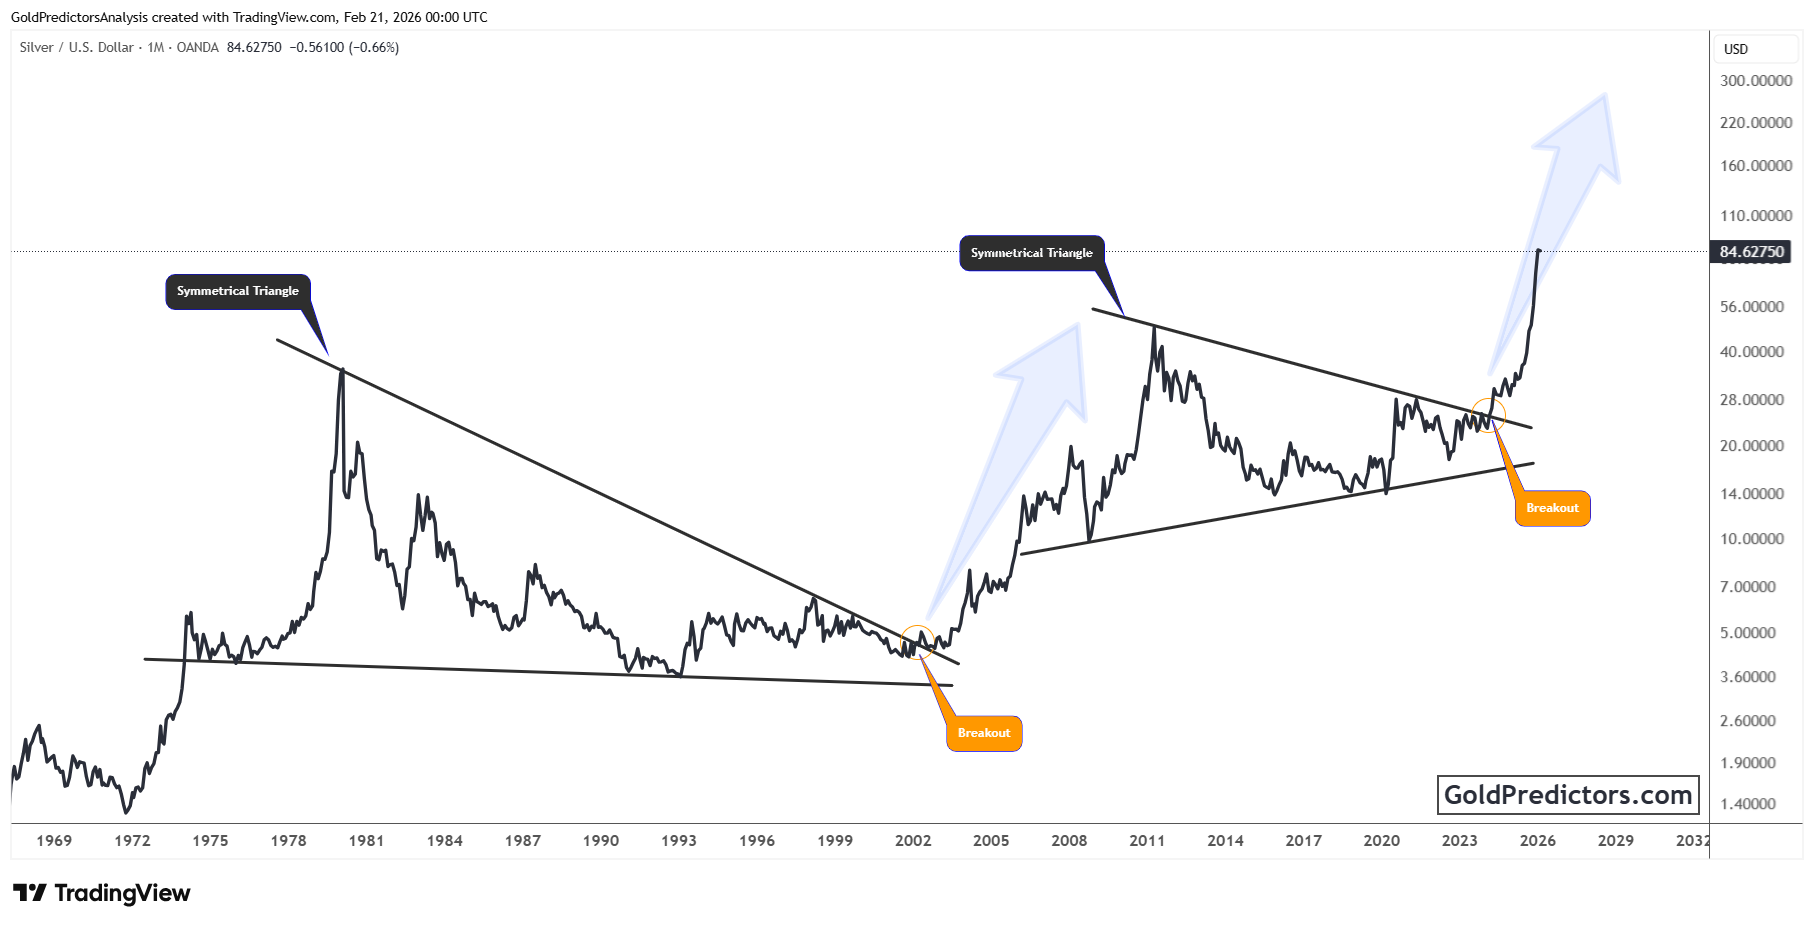
Following that move, silver entered another extended consolidation phase within a symmetrical triangle. Price formed higher lows and lower highs for more than a decade, reflecting tightening conditions beneath resistance. In 2025, silver broke decisively above this structure, signaling an end to long-term compression. This breakout marked a transition away from long-term consolidation and into sustained price expansion.
Since the breakout, silver has accelerated sharply and pushed well beyond earlier resistance levels. Price action shows clear trend continuity, with limited overlap between successive swings. Short-term pauses or pullbacks remain possible after the steep move. Even so, the broader structure continues to favor higher levels. As long as the price holds above former triangle resistance, the long-term setup remains constructive.
Silver Outperforms as Dollar Ratio Holds Near Historic Lows
The chart below shows a long-term downtrend in the U.S. Dollar versus silver ratio, defined by repeated topping formations. Each major upswing formed a rounded distribution pattern before turning lower. These structures formed above the rising trendline, near the upper boundary of the long-term structure. This recurring behavior points to sustained relative weakness in the Dollar against silver.
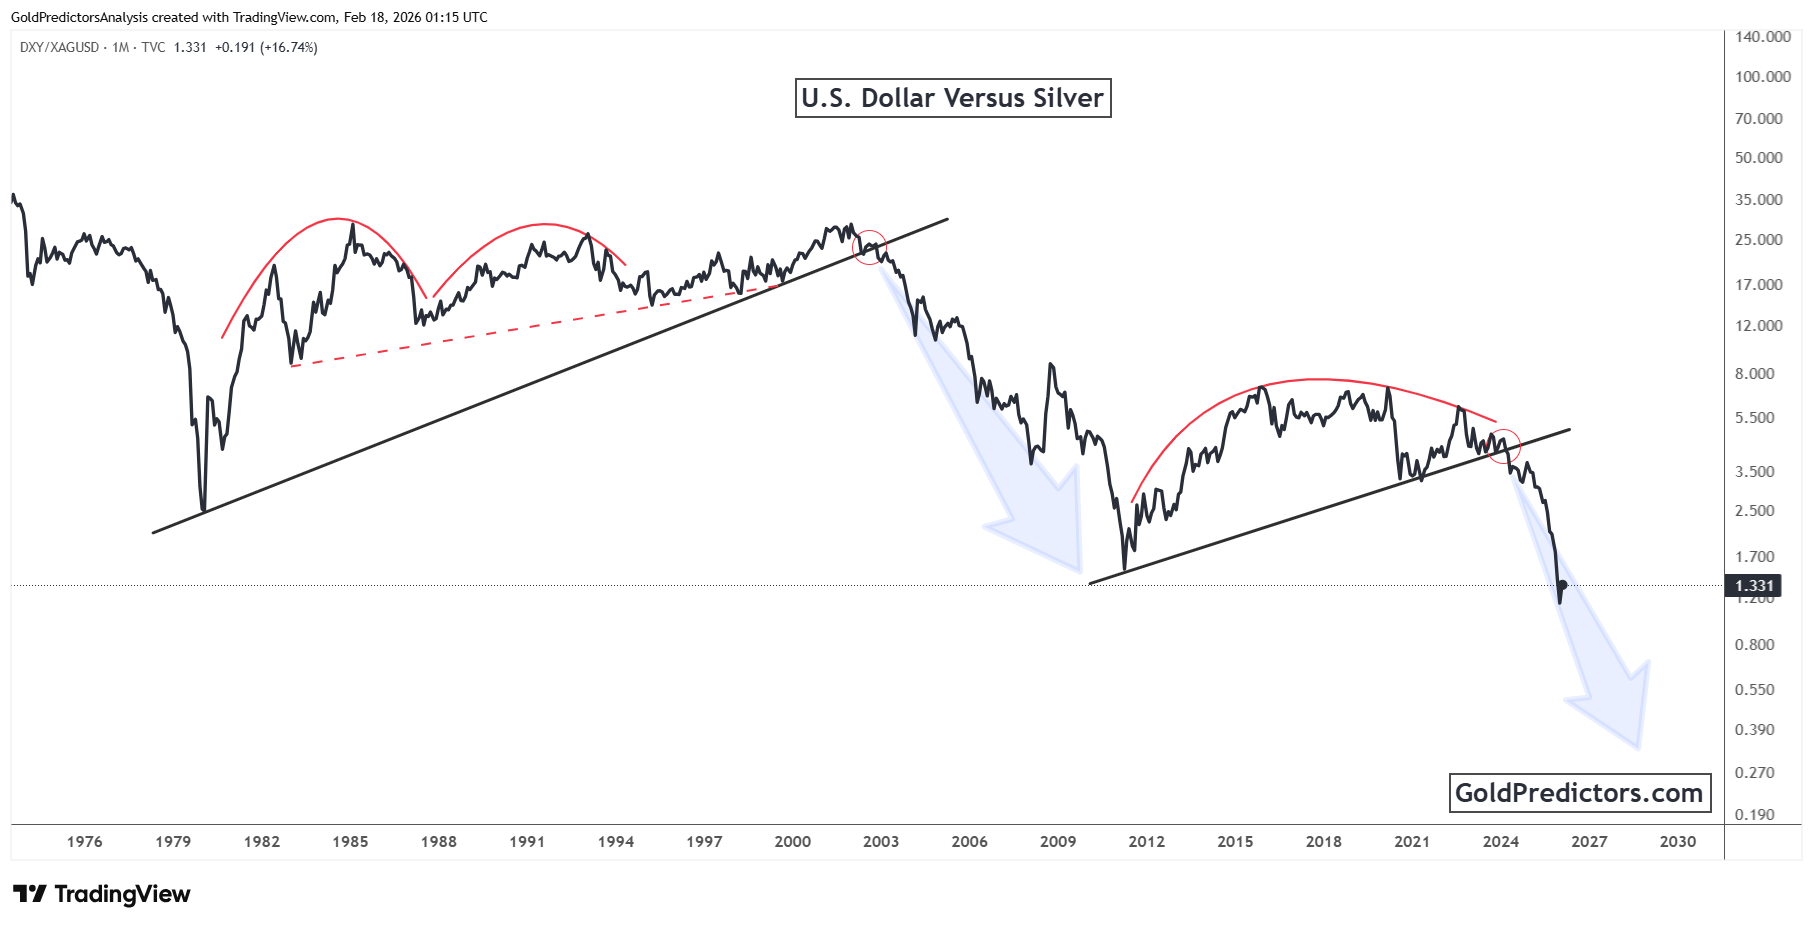
In past cycles, including the early 2000s phase, the ratio failed near rising trendline support before moving lower. The most recent cycle followed the same sequence. Price attempted to stabilize along a rising base but broke decisively below support. The breakdown triggered another accelerated decline, mirroring prior long-term moves.
The ratio now trades near historic lows, with momentum still tilted lower. A durable base has yet to form. As long as rallies fail to reclaim former support, the broader setup continues to favor silver outperformance. This structure aligns with an ongoing shift toward hard assets over fiat exposure. Unless that dynamic changes, the ratio remains biased to the downside.
Silver Outlook: Expansion Phase Persists as Intermarket Signals Align
Silver has moved beyond multi-decade compression patterns. The resolution of successive long-term triangles marks a clear shift in behavior. Price acceptance above former resistance signals a change in structure rather than a temporary surge. Pullbacks may occur along the way, yet the broader structure now reflects acceptance of higher levels after years of compression.
At the same time, the U.S. Dollar versus silver ratio continues to press lower after breaking its long-standing rising structure. The failure to rebuild a durable base continues to favor silver on a relative basis. Past cycles show that similar breakdowns aligned with extended periods of silver outperformance. As long as the ratio remains below former support, relative conditions stay favorable.
These developments highlight a broad structural transition across both price and relative measures. Silver has shifted from contraction into expansion, while intermarket signals align with that change. Near-term fluctuations remain possible, especially after a steep move. Even so, the longer-term setup now reflects acceptance of higher ranges rather than a return to compression.
Gold Predictors Premium Membership
Get exclusive short-term and swing trade ideas with precise entry levels, stop-loss, and target prices, including justification and analysis — all delivered directly via WhatsApp.
Our premium service includes deep technical analysis on gold and silver markets. We cover cycle analysis, price forecasting, and key timing levels.
Members also receive a weekly market letter with detailed analysis, commentary from our Chief Analyst, including actionable insights, trade timing, and direction forecasts for gold and silver.
Stay ahead of the market — join our premium community today.


