


Gold and Silver Set for Major Bull Run After Historic Breakout and Ratio Breakdown
Gold (XAUUSD) has broken out of a decades-long resistance channel, marking a major technical shift. This move comes after years of consolidation and failed attempts. Since the early 2000s, gold has traded within an ascending channel, respecting its key levels. The breakout between 2024 and 2025 signals renewed strength and rising momentum. With support now established above $2,200 and $3,000, gold targets higher ranges between $4,000 and $6,000. A bullish inverse head-and-shoulders pattern confirms the breakout. Meanwhile, a breakdown in the gold/silver ratio indicates growing momentum for silver. Together, these trends set the stage for a significant period in gold and silver markets.
Gold Breaks Multi-Decade Resistance Channel, Targets Long-Term Upside
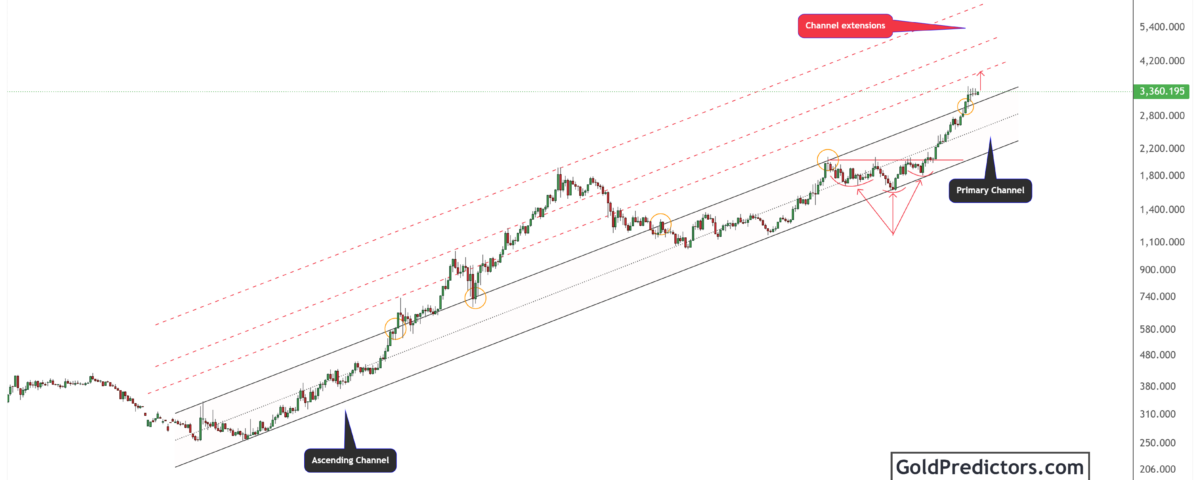
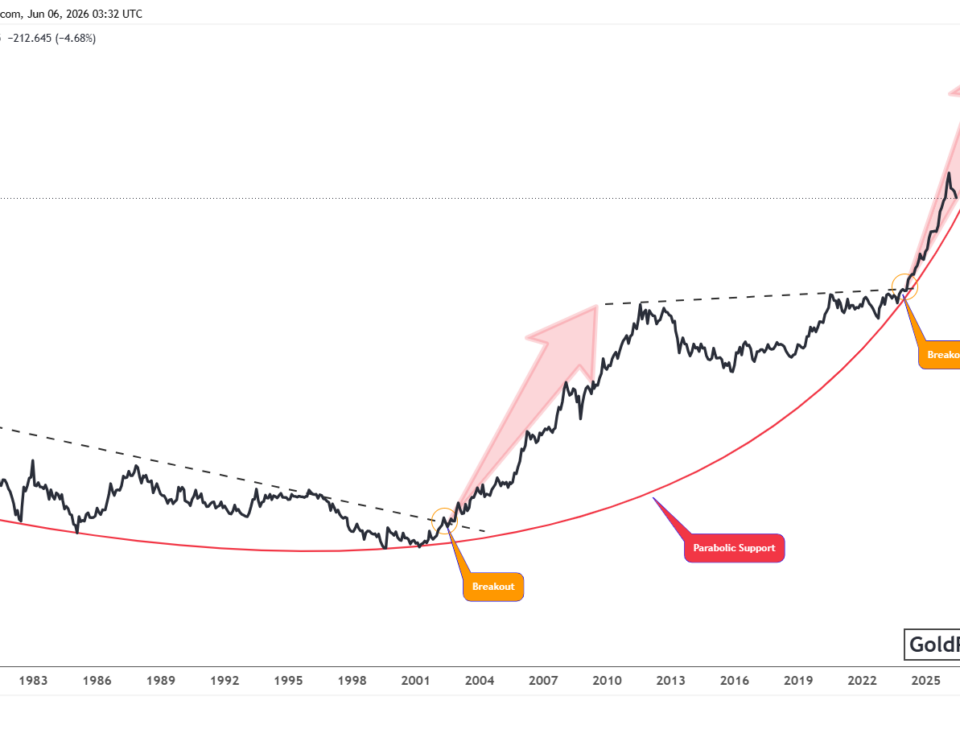
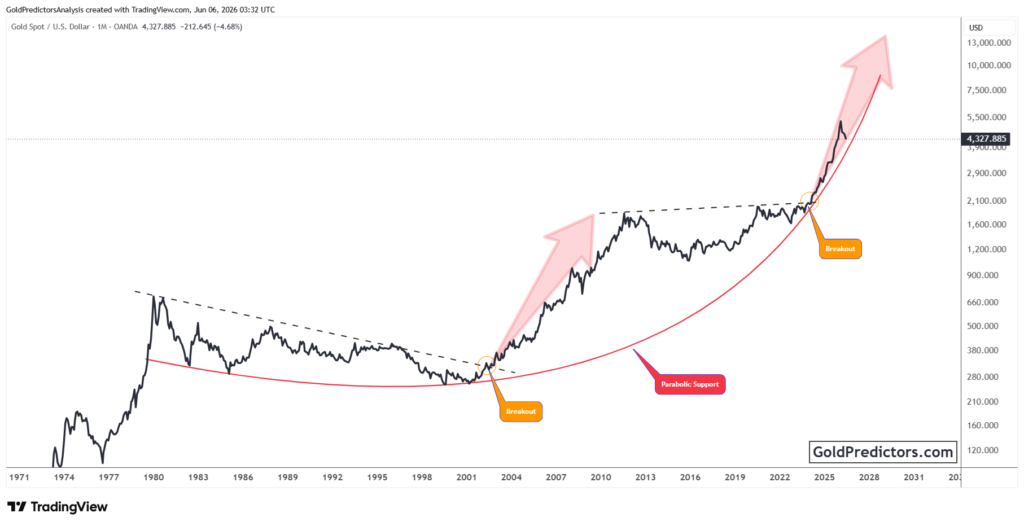
The gold chart below shows a powerful bullish trend that has developed over the past three decades. Gold has been trading within a well-defined ascending channel since the early 2000s, consistently respecting its support and resistance levels. After a prolonged consolidation phase between 2011 and 2018, the metal resumed its upward momentum. It established a strong base within the primary channel structure.
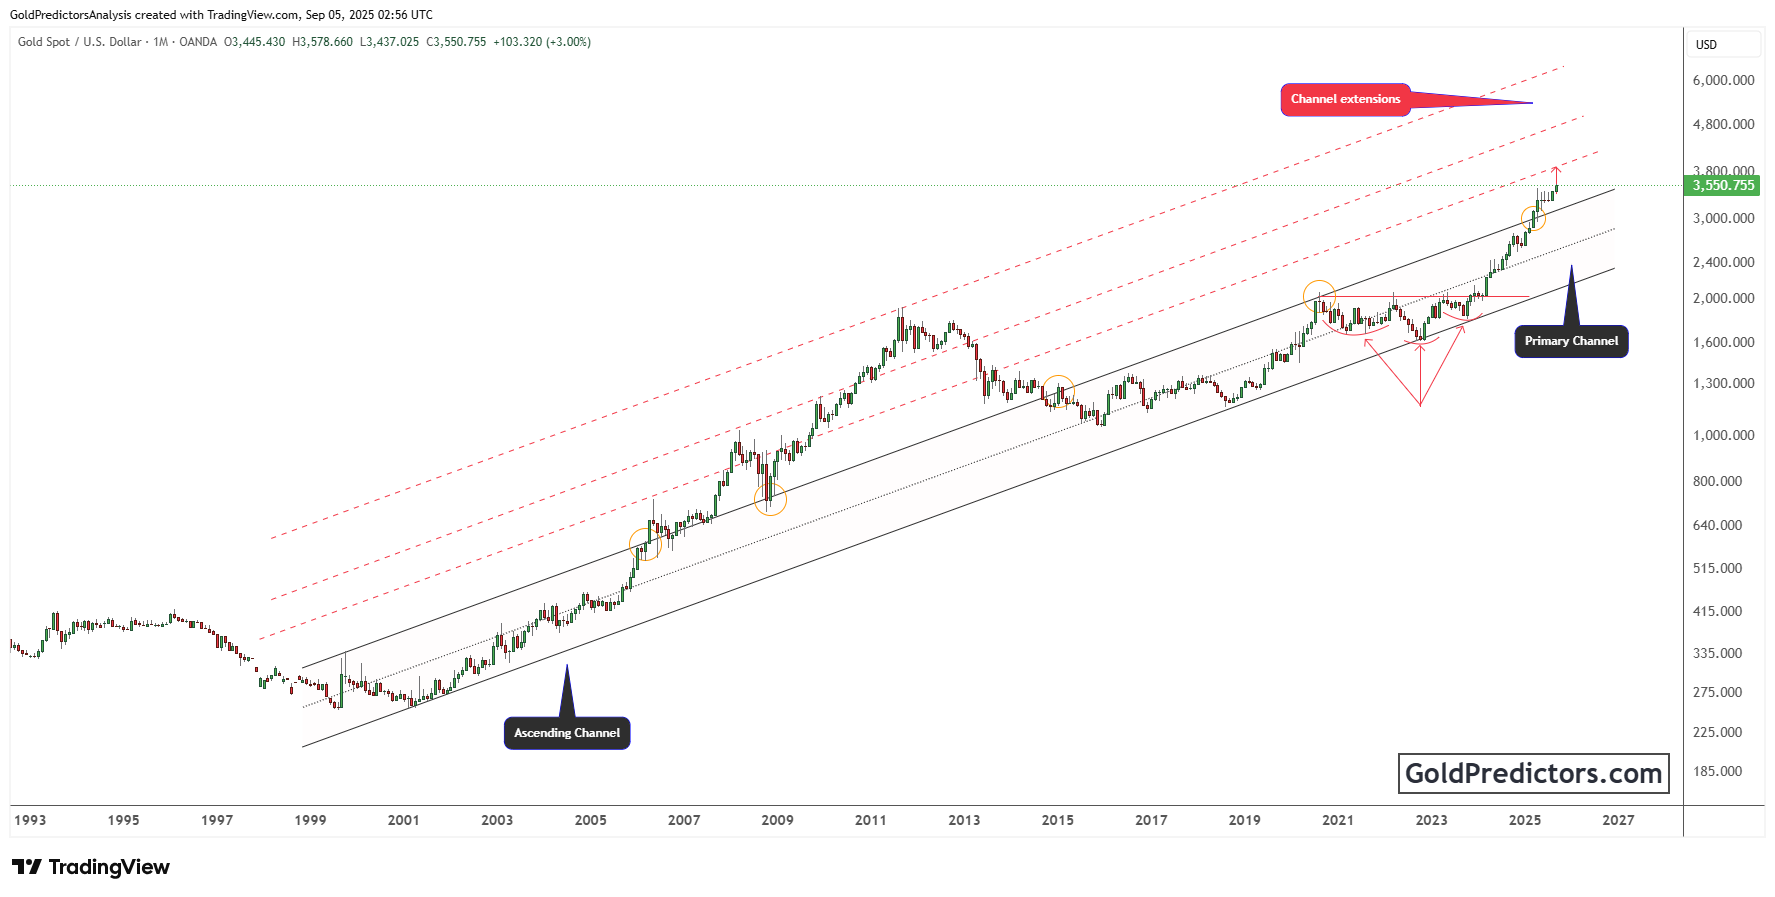
A major breakout occurred between 2024 and 2025 as gold prices surged beyond the upper limit of the primary channel. This breakout holds strong technical significance after years of consolidation and multiple failed attempts. The zone between $2,200 and $2,400, which acted as resistance for years, now serves as a long-term support level. Based on the extended channel projections, gold is now targeting the $4,000 to $6,000 range. This potential move is marked by the upper red-dotted lines on the chart.
Further adding to the bullish case, a well-formed inverse head-and-shoulders pattern confirms the strength of the breakout. Gold has maintained its bullish structure, marked by rising lows and persistent momentum despite external market pressures. Only minor pullbacks have occurred since 2018, with buyers stepping in around critical support zones. With upward momentum gaining strength, gold is poised for a breakout. This move may signal the start of its third and most aggressive wave in the broader cycle.
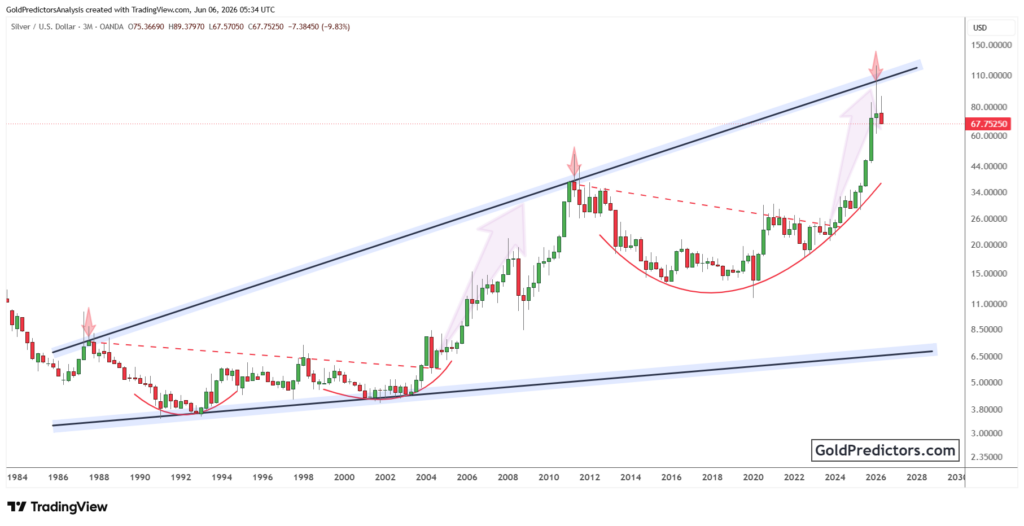
Gold/Silver Ratio Breakdown Signals Silver’s Potential Outperformance
The chart below shows a distinct view of the gold/silver ratio, which strengthens the technical outlook for gold. As gold extends to new highs, the gold/silver ratio is forming a bear flag after rejecting resistance at the top of its long-term ascending channel. After a historical surge above 120, the ratio once again tested the channel’s resistance in 2024 and faced a strong rejection. Multiple rejections from the same level confirm strong resistance and strengthen the case for further downside. The sharp pullback in 2025 adds weight to the bearish outlook and suggests a potential reversal in trend.
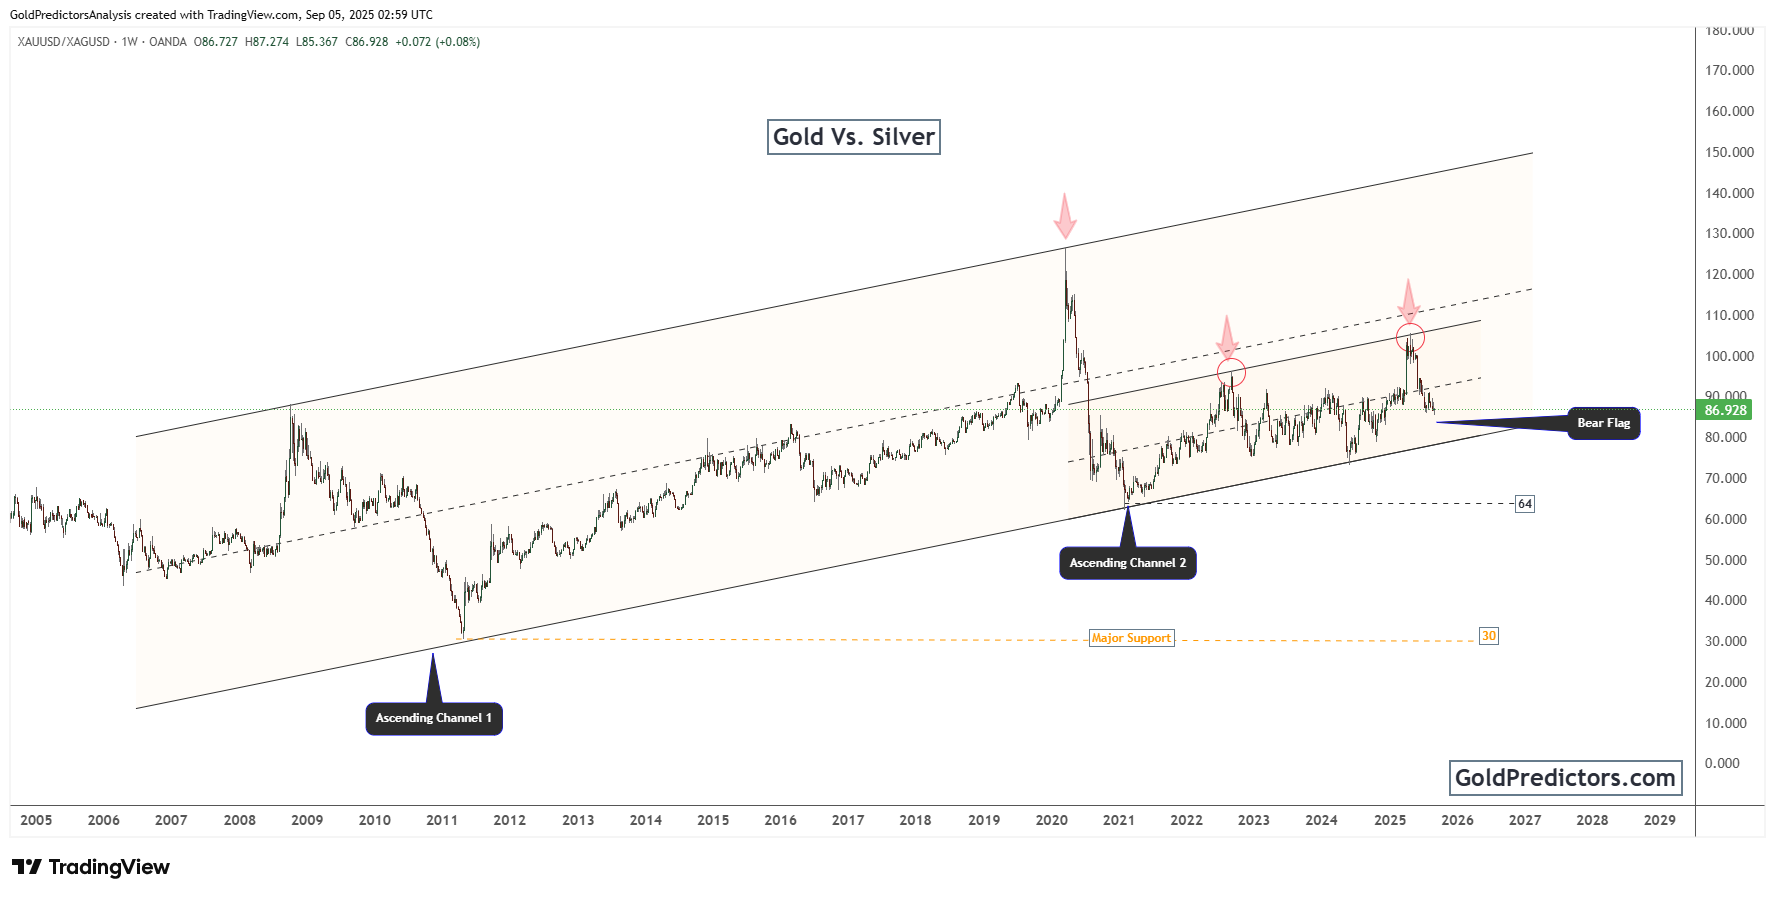
Currently, the bear flag is developing near the midline support of the ascending channel. If this pattern breaks down, the ratio could fall toward the 64 level, a key horizontal support last seen in 2011. Such a decline would suggest a period in which silver outperforms gold. Previous drops in the ratio have often aligned with stronger silver rallies. This technical setup suggests that while gold continues to perform well, silver may offer even greater upside potential in the coming phase.
Momentum indicators also reinforce this bearish structure. A series of lower highs and ongoing bearish formations suggests the ratio is losing strength. Similar formations in past cycles have led to strong moves in favour of silver. During the 2010–2011 period, silver significantly outperformed gold following the peak in the ratio. Present market conditions resemble the earlier phase, hinting at a potential period of silver outperformance ahead.
Conclusion: Gold’s Breakout and Silver’s Momentum Signal Major Shift
Gold has confirmed a historic breakout by pushing beyond a decades-long resistance channel. This move signals a significant shift in its long-term trajectory. With a strong technical foundation and rising momentum, gold appears poised for further gains in the coming years. The breakout above $2,400 has turned past resistance into solid support, setting the stage for price targets between $4,000 and $6,000. It strengthens the case for a renewed and extended bullish cycle.
At the same time, the gold/silver ratio highlights a different but supportive market signal. A bearish continuation pattern is forming, supported by multiple rejections from key resistance. If the bear flag breaks down, the ratio could slide toward the 64 level. Historically, such setups have led to periods where silver outperforms gold. The current structure suggests that while gold remains bullish, silver may offer even stronger relative performance in the next leg of the rally.
Together, these technical formations support the case for a sustained rally in gold and silver. Gold shows strength through a confirmed breakout, while the gold/silver ratio points to silver’s potential leadership. The alignment of these technical factors suggests a significant shift developing in the gold and silver market. Shifting economic conditions and rising global instability could drive gold and silver into a period of historic volatility and potential gains.
Gold Predictors Premium Membership
Get exclusive short-term and swing trade ideas with precise entry levels, stop-loss, and target prices, including justification and analysis — all delivered directly via WhatsApp.
Our premium service includes deep technical analysis on gold and silver markets. We cover cycle analysis, price forecasting, and key timing levels.
Members also receive a weekly market letter with detailed analysis, commentary from our Chief Analyst, including actionable insights, trade timing, and direction forecasts for gold and silver.
Stay ahead of the market — join our premium community today.
