


Gold vs. Dollar: Multi-Decade Breakout Suggests Bull Market Ahead
Gold (XAUUSD) continues to follow a strong uptrend within a well-established ascending channel that has shaped its price movement since 2014. Recent breakouts and bullish formations support this momentum. The gold-to-dollar ratio has also broken out of a multi-decade triangle, signalling a shift in macroeconomic dynamics. Both technical and macro indicators now point toward higher long-term targets. Investors are watching closely as gold approaches key resistance levels, with potential for further gains.
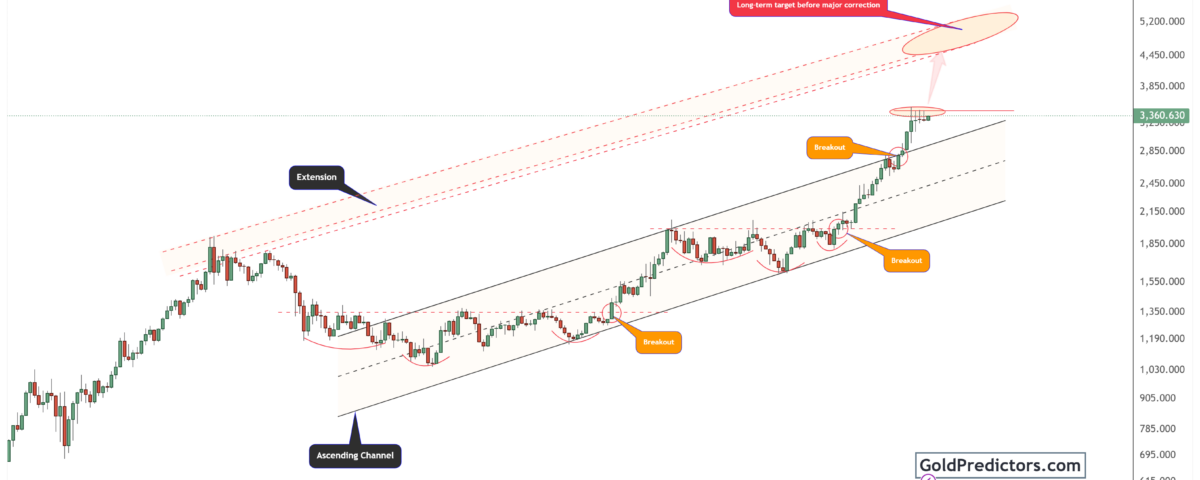
Gold Maintains Uptrend within Long-Term Ascending Channel
The gold chart below shows a well-defined ascending channel that has guided price movement since 2014. Numerous breakouts within the channel confirm the strength and persistence of bullish momentum. Notably, in 2019 and 2023, gold prices broke out from consolidation phases and moved toward the upper edge of the channel. These breakout points were accompanied by rounded bottom formations, which are traditionally bullish reversal patterns.
Every breakout has sparked strong buying activity, driving the price upward. The latest monthly candle shows gold trading at approximately $3,360, continuing its strong uptrend. The price is approaching the upper boundary of an extended channel. If this trajectory holds, the chart indicates a long-term target zone between $5,000 and $6,000 before any significant correction.
This red-dashed extension marks a resistance level that traces back to gold’s 2011 high. This extended trend acts as a magnet, pulling price action toward it. A breakout above this extension could trigger a quick rally, followed by a possible correction. Historically, each breakout beyond the channel’s resistance has led to accelerated gains, followed by steep corrections. This suggests the $5,000+ zone could mark a speculative peak in the current cycle.
Gold-to-Dollar Ratio Breakout Signals Major Shift in Market Dynamics
The chart below shows a historical perspective of the gold-to-US dollar ratio across multiple cycles. It highlights key historical consolidation phases. It also marks primary breakout levels that have influenced gold’s macroeconomic performance over the decades. This perspective is crucial for understanding gold’s behaviour in relation to the strength of the dollar across various economic cycles.
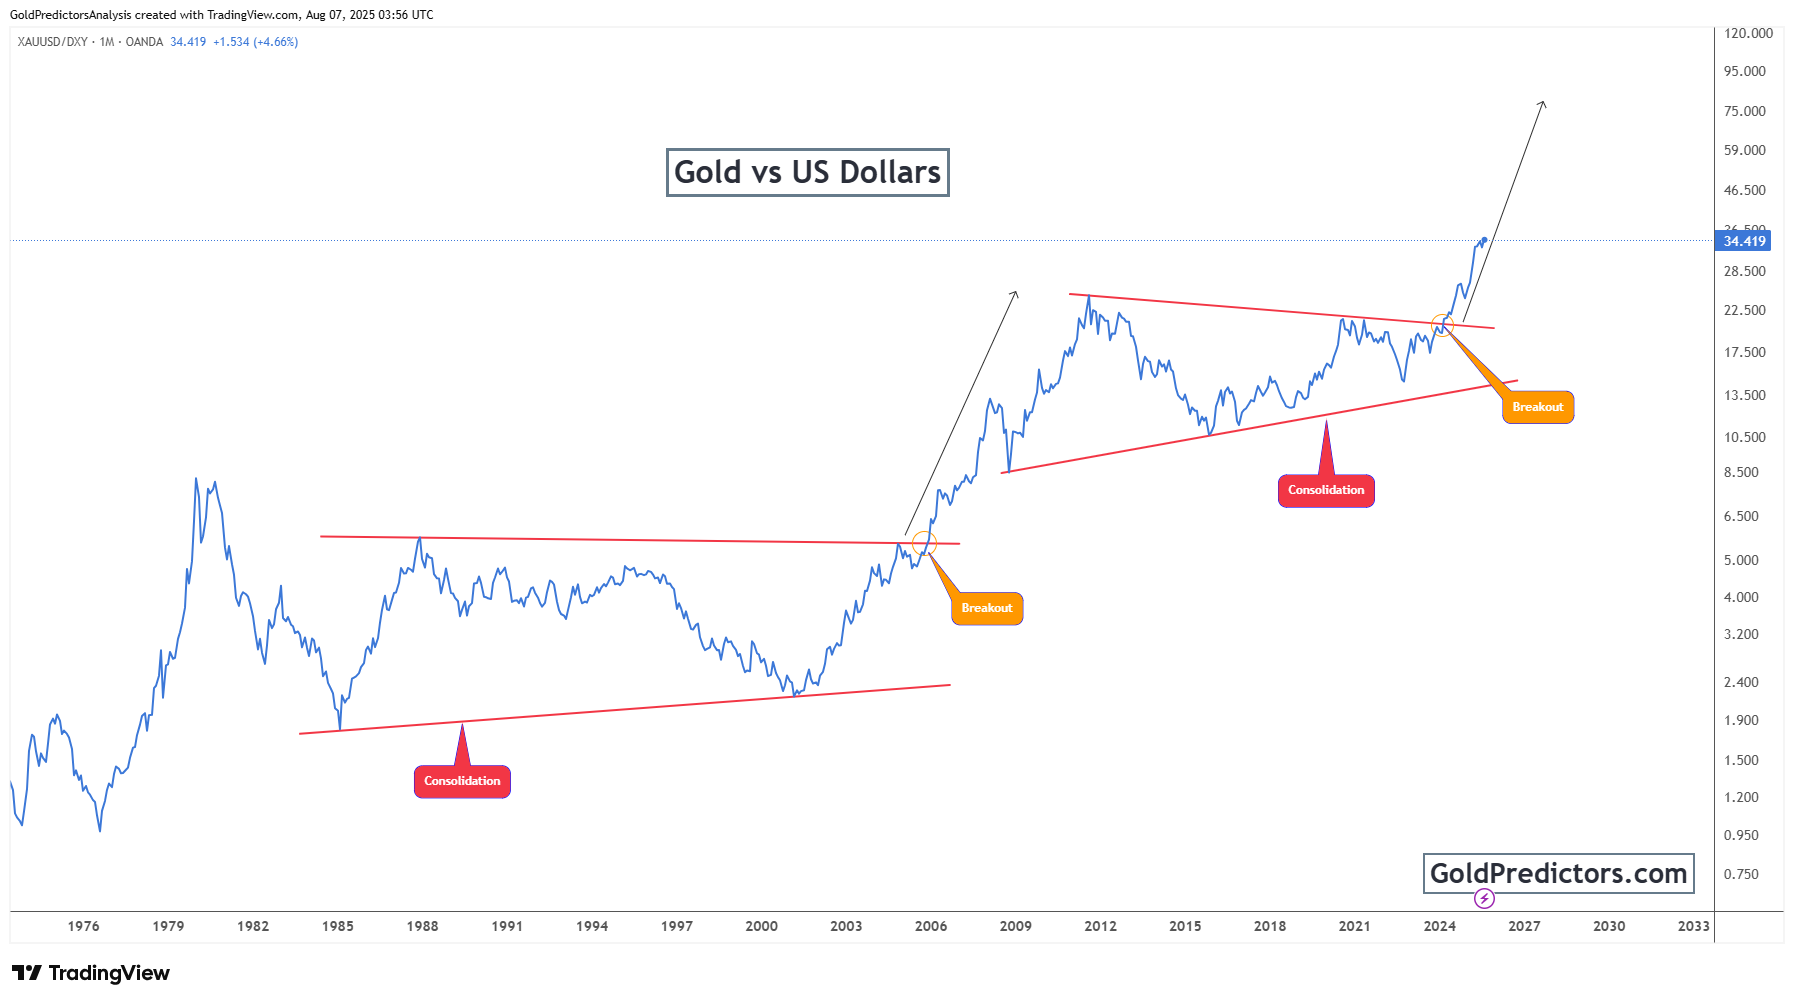
Two significant consolidation periods are evident in this long-term chart. The first consolidation phase occurred between 1983 and 2004, and the second emerged between 2012 and 2023. Both phases showed lengthy consolidation, indicating periods of uncertainty or balanced market conditions. Each of these phases eventually led to significant breakouts. The 2005 breakout sparked a multi-year uptrend in the gold market; initial indications from the 2024 breakout point suggest a potential repeat of that pattern.
Currently, the gold-to-dollar ratio has broken out of a long-term triangle, indicating further upside potential. Rising momentum is driving this breakout, with the ratio approaching the 60–75 range. This suggests that gold is quickly strengthening against the US dollar. If past trends repeat, this breakout could unfold into a multi-year rally, possibly including periodic corrections, before reaching a significant peak.
Conclusion: Gold’s Bullish Outlook Supported by Technical and Macro Indicators
Gold’s technical setup remains strongly bullish. The ascending channel that has guided price action since 2014 remains intact. Each breakout from this setup has triggered notable gains, and the most recent move has brought gold near the top of the channel. If momentum persists, long-term targets between $5,000 and $6,000 remain in focus, though temporary corrections may occur along the way.
From a macro perspective, the gold-to-dollar ratio provides additional support for the bullish thesis. The breakout from a multi-decade triangle suggests a shift in gold’s relative strength against the US dollar. Such breakouts have historically marked the beginning of prolonged rallies, and gold’s current behaviour appears to align with that pattern. Momentum remains strong as the ratio approaches the 60–75 level, indicating ongoing strength.
The combination of technical patterns and macro trends suggests a favourable long-term trajectory for gold. Investors should watch for sustained momentum and any sharp reversals near key resistance zones. While short-term volatility is possible, the broader trend remains upward, supported by chart structures and macroeconomic forces.
Gold Predictors Premium Membership
Get exclusive short-term and swing trade ideas with precise entry levels, stop-loss, and target prices, including justification and analysis — all delivered directly via WhatsApp.
Our premium service includes deep technical analysis on gold and silver markets. We cover cycle analysis, price forecasting, and key timing levels.
Members also receive a weekly market letter with detailed analysis, commentary from our Chief Analyst, including actionable insights, trade timing, and direction forecasts for gold and silver.
Stay ahead of the market — join our premium community today.


