Gold Dropped As Expected & Rebound in Progress | Gold Predictors - Forecasting Gold Prices

New York

London

Sydney

Tokyo

Log In

  • Register
  • Lost your password?
gold predictorsgold predictorsgold predictorsgold predictors
  • HOME
  • ABOUT US
    • About Us
    • Social Networks
    • Industry Links
    • Testimonials
  • RESEARCH
    • Scientific Trade Strategies
    • Gold Hub
    • Gold Importance
    • Silver Importance
  • GOLD HUB
  • GOLD ANALYSIS
    • Gold Analysis
    • Technical Analysis
      • Trend Identification
      • Phase Identification
      • Important Levels
      • Volatility Measurement
    • Gold Cycle
      • Short Term Cycles
      • Medium Term Cycles
      • Long Term Cycles
    • Price Action Analysis
      • Phase Identification
      • Historical Pattern Identification
      • Candlestick Pattern Identification
    • Fundamental Analysis of Gold
    • Gold Related Markets Analysis
    • Gold Seasonal
  • TRADING METHODOLOGY
    • Gold Analysis
      • Technical Analysis
      • Gold Cycle
      • Price Action Strategy
      • Fundamental Analysis
      • Gold Related Markets Analysis
      • Gold Seasonal
    • Measure Signal Strength
      • Weak Signal
      • Strong Signal
      • Confirmed Signal
    • Trading Decision
    • Trading Rules
      • Basic Trading Rules
      • Gold Predictors Trading Rules
    • Trade Examples
    • Performance
  • LIVE CHARTS
  • MEMBERSHIPS
    • Free Membership
    • Premium Membership
    • SignUp
  • MEMBERS AREA
    • Free Article
    • Premium Article
    • Trading Signals
    • Long Term Signals
    • Forex Reports
    • Crypto Reports
  • FOREX REPORTS
  • HELP
    • FAQ
    • Contact Us
Login / Register

Gold Dropped As Expected & Rebound in Progress

0
Published by admin at May 26, 2022
Categories
  • Premium Articles
Tags

Gold prices rebounded from a strong support level of $1,790, which many traders used as a stop loss. So far, the bounce has encountered strong initial resistance in the $1,860-$1,870 region, as discussed in the weekly letter. According to the FOMC meeting minutes, most participants thought a 50 basis point rate increase would be appropriate in June and July. On the other hand, while global reserve currency had impacted gold demand, there are other factors to consider when measuring gold dynamics. Prospects for more aggressive monetary policy by major central banks, combined with Russia-Ukraine conflicts, have fueled recession fears and continued to weigh on investor sentiment. Market participants are looking ahead to the US economic calendar, which includes preliminary Q1 GDP, jobless claims, and home sales. The publication of these events will provide additional direction to the gold market.

Gold Technical Outlook

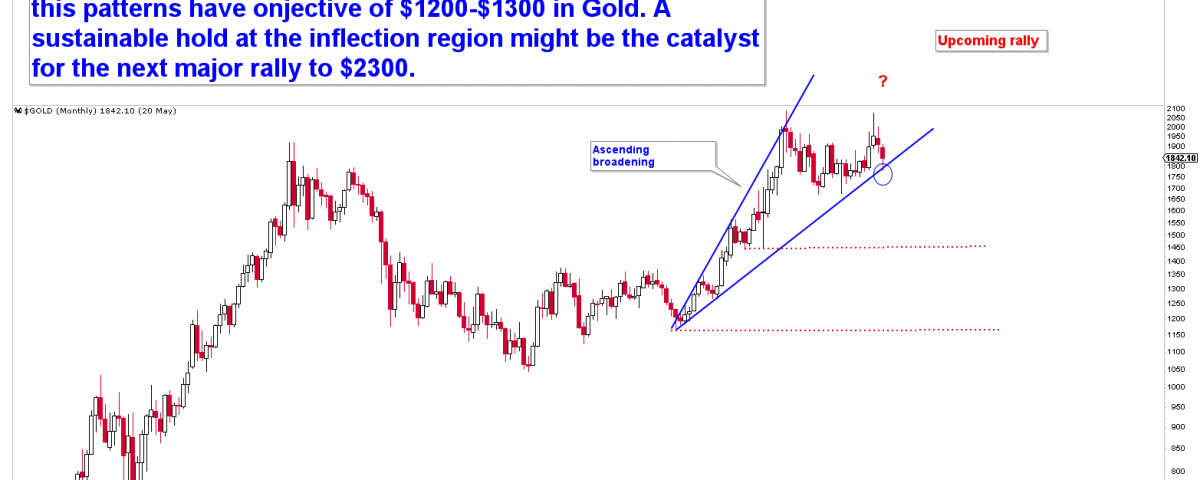
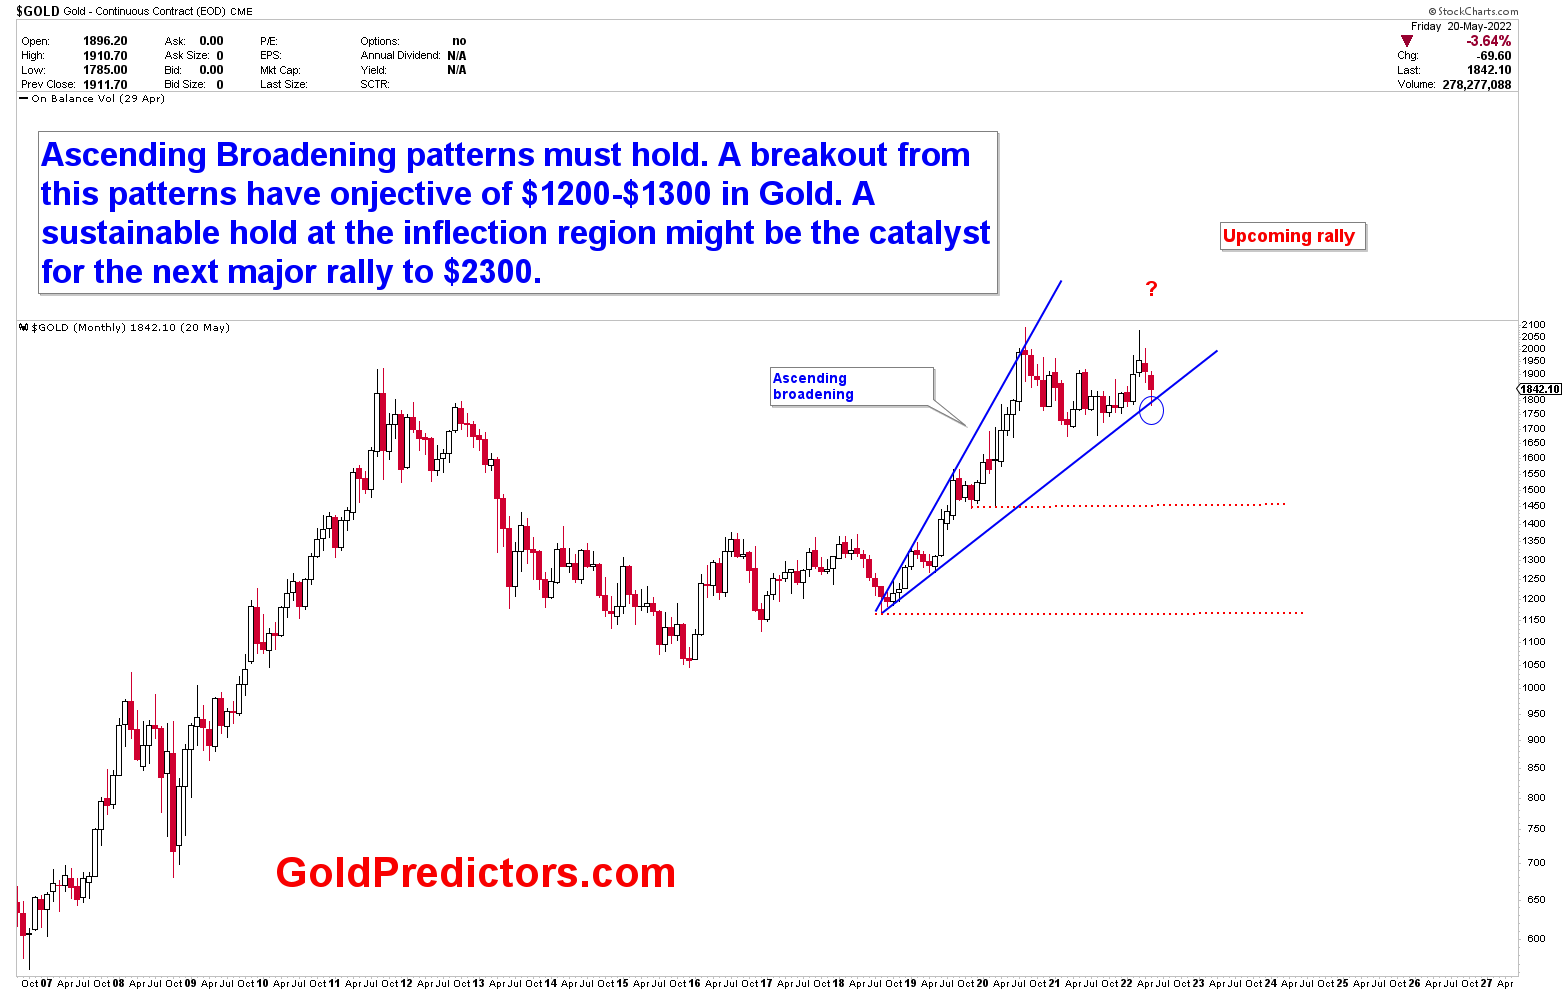
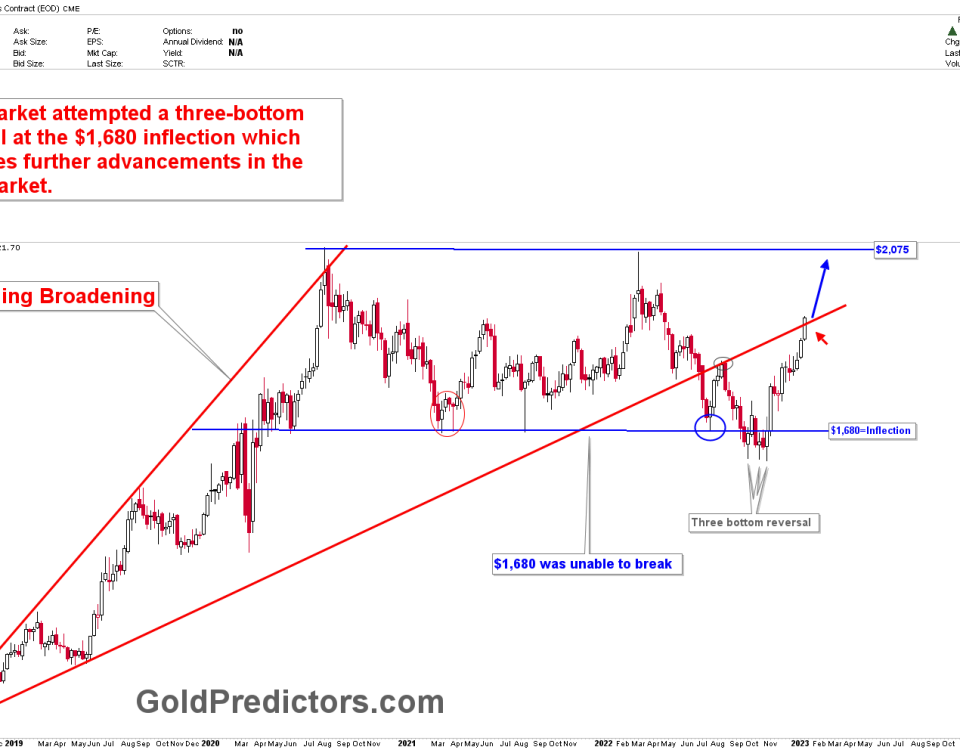
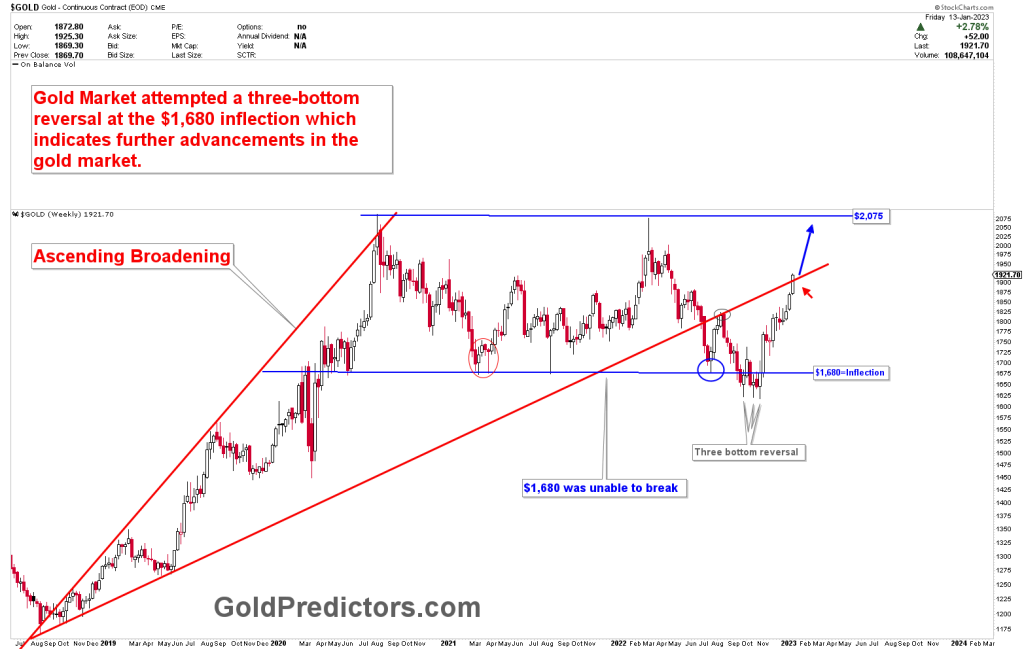
The monthly gold chart depicts the evolution of ascending broadening patterns, which were first identified in the year 2020. The patterns performed admirably throughout the year, and the price has been trading within patterns for a long time. The major inflection of the gold market was identified as $1,680 to be tested in March 2021, which was used as the catalyst for the next rally in spot gold based on the study of the cycles. The pivot point of $1,680 was reached in March 2021, and the price has since risen to levels above $2,000. At $1,800, the chat presents another test of inflection point at ascending broadening patterns.

Gold Dropped As Expected

On weekly timeframes, it is very clear that the development of a descending broadening was identified and broken with clear formation. According to the trading signals, the recent drop occurred at the strong pivotal point of $1,790, which was considered the stop loss for many traders. The strength of the pivot was increased by combining the support of the descending and ascending broadening lines. The recent drop was discussed in the premium sections as one of the reasons for the technical formations below the $2,075 yearly pivot. Once again, $2,075 was identified as the yearly pivot, and the price has dropped by nearly $250/ounce from the $2,075.

Gold Dropped As Expected

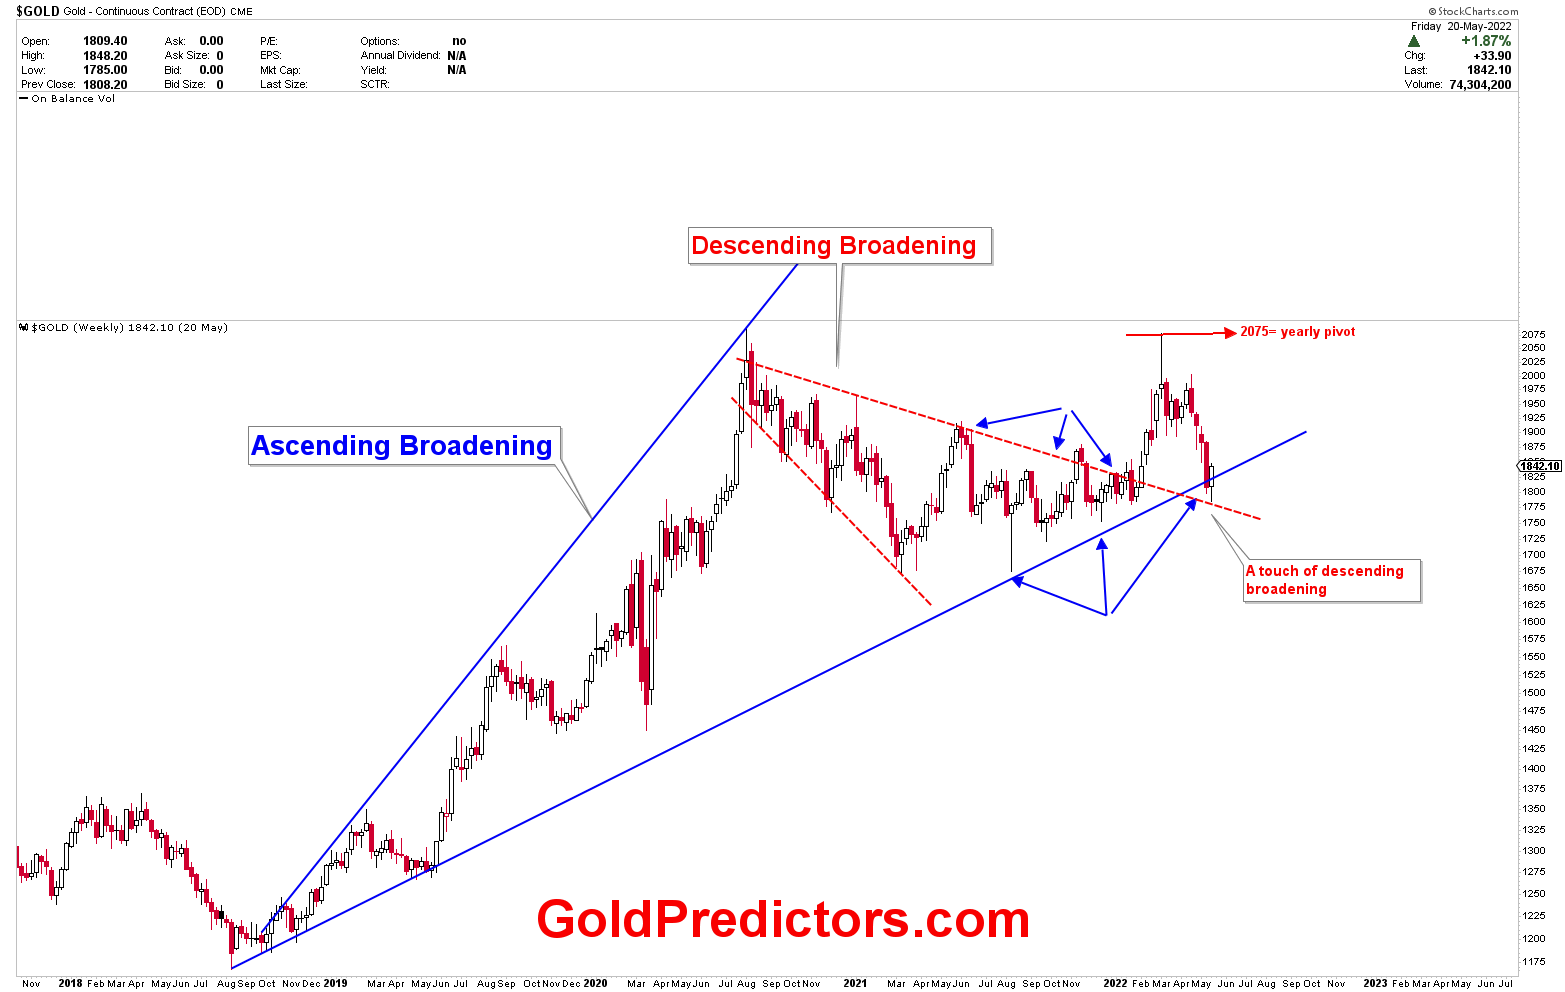
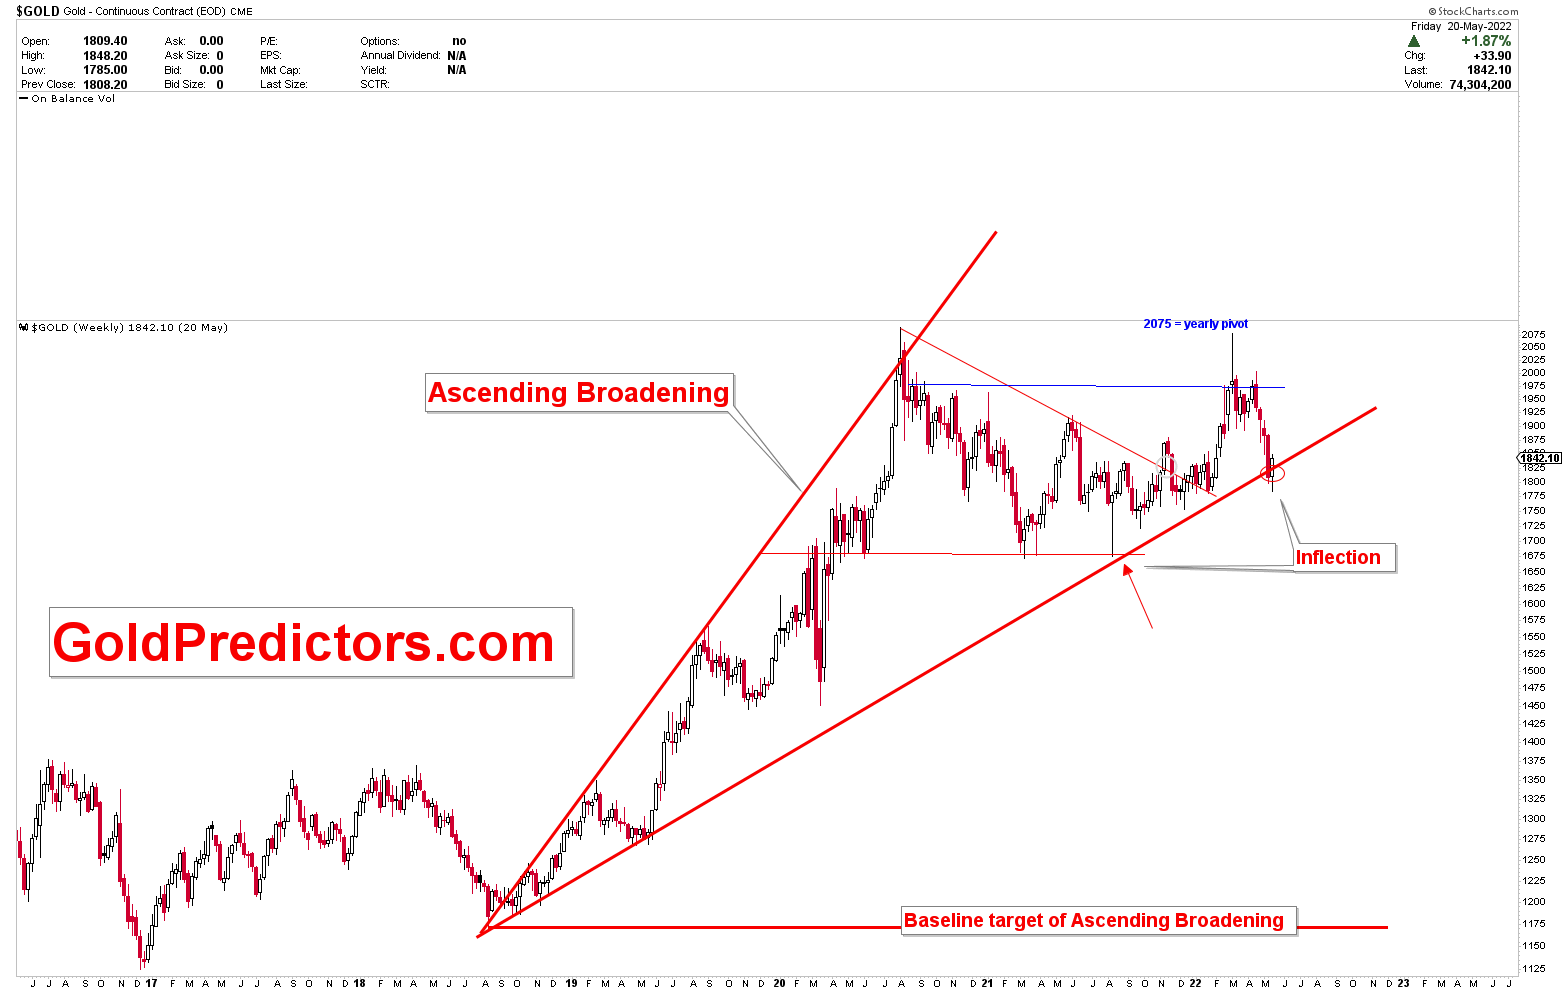
Let’s take a look at another chart that shows strong support at the intersection of an ascending and descending broadening with a weekly reversal. However, price patterns have become weak at this point, and any failure of this inflection region will be interpreted as a significant drop in the gold market to much lower levels.

Gold Dropped As Expected

Gold Predictors Celebrates 6th Anniversary! Huge Discount on Yearly Memberships

Please login to read full article!

Please subscribe to the link below to receive free updates.

Free Membership

This content is locked

Login To Unlock The Content!

Username:
Password:

Related posts

January 29, 2023

Premium Updates Are Mostly Delivered Using Emails


Read more
recession
January 28, 2023

Gold – A Recession Warning


Read more
gold ascending broadening
January 15, 2023

Gold: Bullish Short-Term Structure


Read more

Comments are closed.

ABOUT US

  • About Us
  • Social Networks
  • Industry Links
  • Testimonials
  • Terms & Conditions

TECHNICAL ANALYSIS

  • Technical Analysis
  • Trend Identification
  • Phase Identification
  • Important Levels
  • Volatility Measurement

CYCLE ANALYSIS

  • Gold Cycle
  • Short Term Cycles
  • Medium Term Cycles
  • Long Term Cycles

PRICE ACTION ANALYSIS

  • Price Action Analysis
  • Phase Identification
  • Historical Pattern Identification
  • Candlestick Pattern Identification
© 2017 Gold Predictors. All Rights Reserved.
  • Remember Me
    Lost your password?
    Dont have an account?Sign Up