


Technical Analysis for GBPNZD
The New Zealand dollar is following in the footsteps of the risk-sensitive currencies that were pounded on Tuesday. The growing fears that China’s coronavirus epidemic and zero-covid policy would create a cocktail that threatens to disrupt the supply chain, to drive the cost. These concerns impacted market sentiment, causing the yen to rise further. Furthermore, confrontations between Ukraine and Russia continue to increase. According to Reuters, Gazprom has suspended gas supply to Bulgaria, while Polish PGNIG has said that Russia would suspend gas deliveries beginning April 27th. Meanwhile, the Reserve Bank of New Zealand is still projected to increase interest rates. Given the RBNZ’s aggressive tone and rising inflation, another rate rise of 50 basis points is predicted in May.
Technical Prediction for GBPNZD for 2021
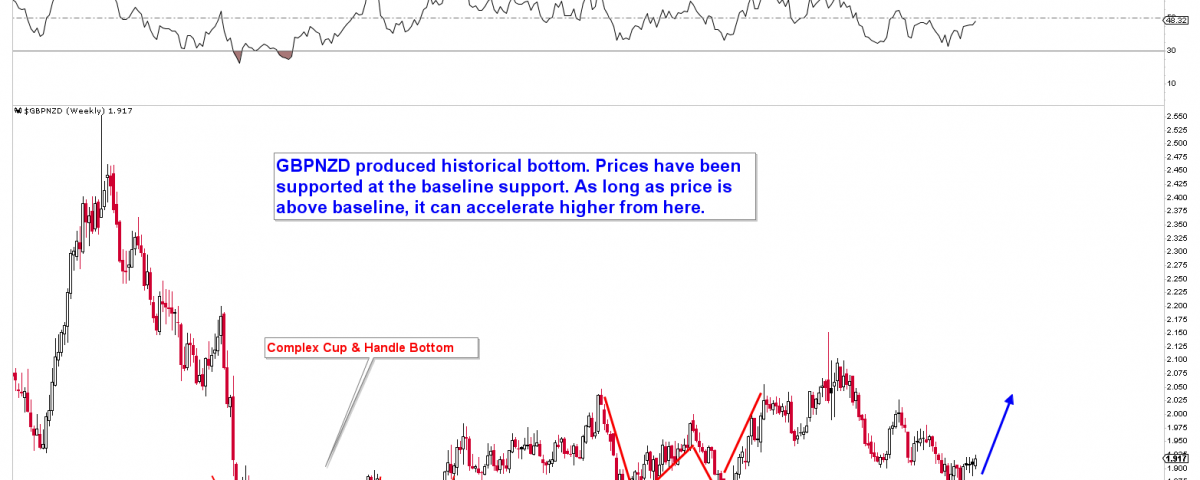
While reviewing all other forex instruments, we clearly stated that the GBPNZD has been the most outstanding pair for 2021. The pair was expected to gain thousands of pips in the year 2021 and beyond. When price of GBPNZD was 1.90 in January and February 2021, NZD was expected to remain the weakest currency onboard. And GBPNZD has been the best pair to go long based on technical and fundamental outlook. The chart below depicts the technical scenario for 2021.
The formation of a complex CUP and HANDLE bottom in 2017, followed by W patterns with a perfect hit to baseline, indicated a nearly 99.99% probability of an upcoming bull run of multiple of 1,000 pips. As a result, we clearly stated the upcoming multiple thousand pips rally from the baseline at least to 1.98 and 2.00.
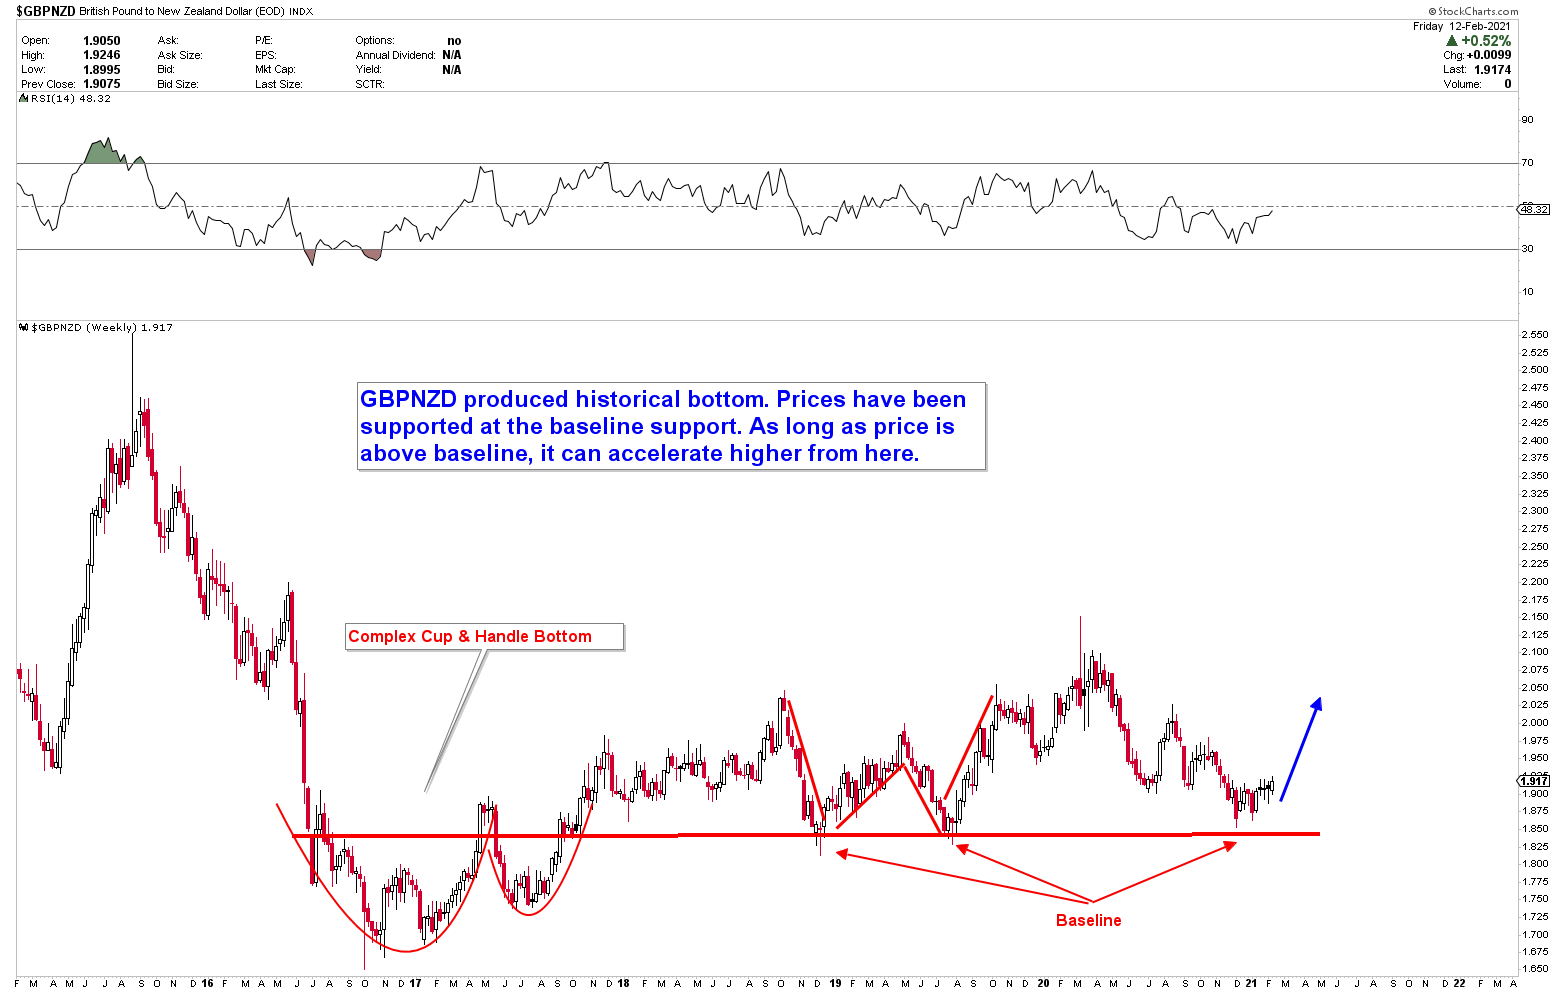
The following chart shows the possible initial resistance at 1.98, where any pullback was expected to trigger another buying opportunity. The chart depicts the outlook. The pullback was successfully developed, and the next buying opportunity was triggered. It was also mentioned that the development of a blue inverted head and shoulder adds to the pair’s upside potential.
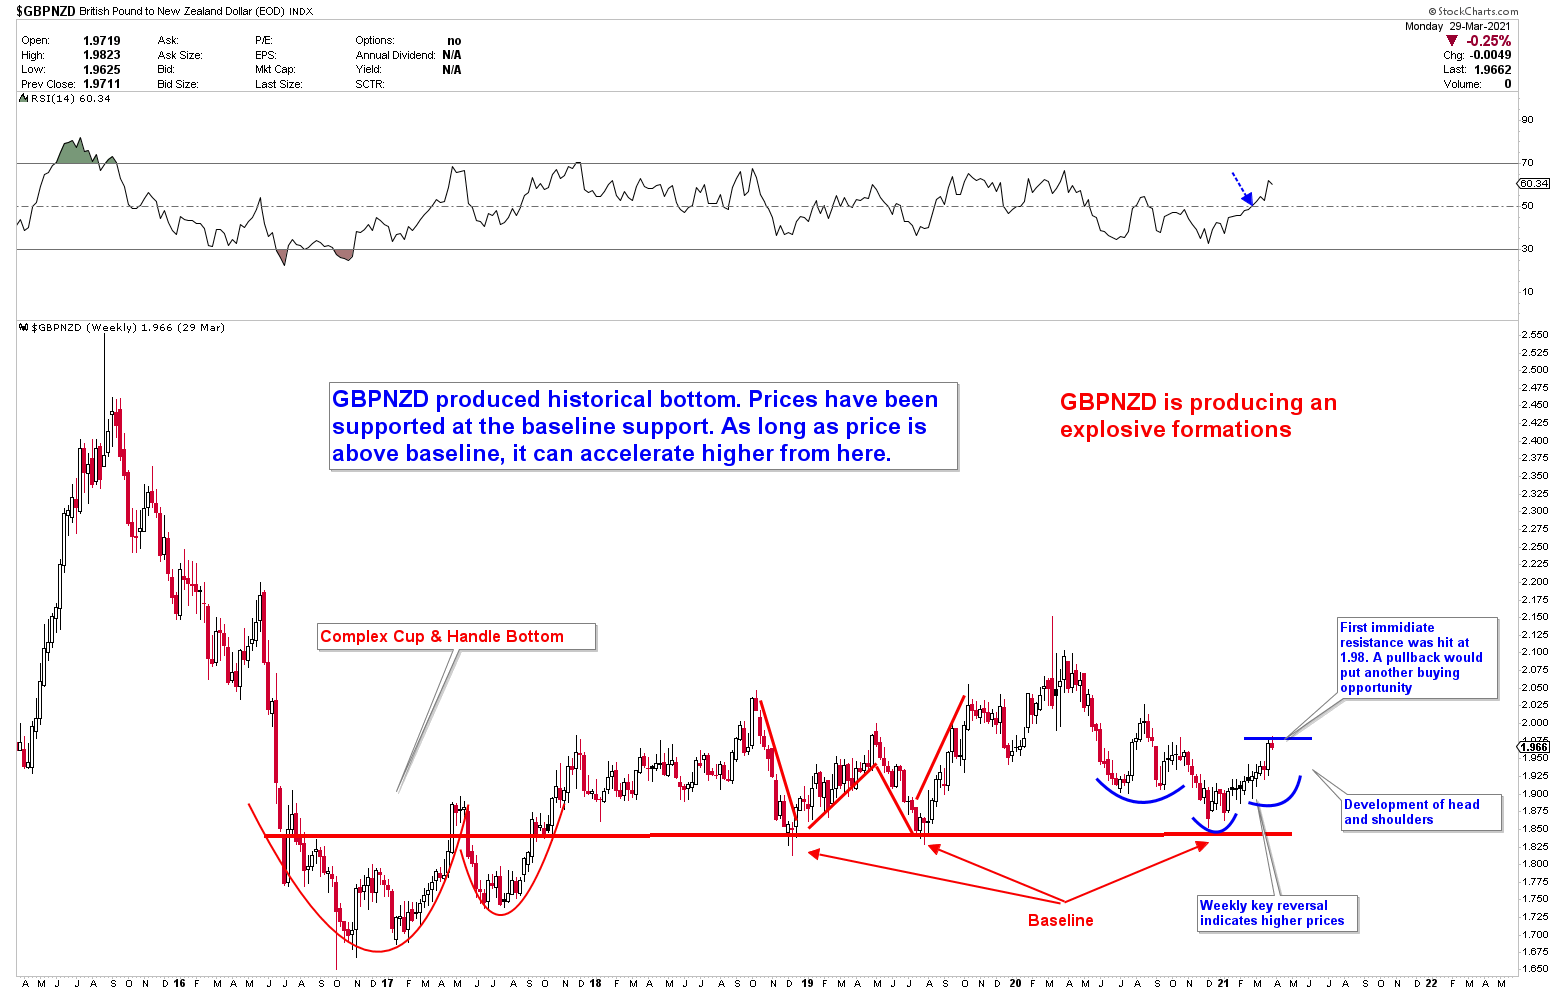
The chart below shows that the pullback from 1.98 was successfully developed following our illustration and predictions, and the next buying opportunity was also triggered. The chart also confirmed the inverted head and shoulder. Within the same month, the 1.98 area was cleared and broken to the upside, with the next upside target being reached.

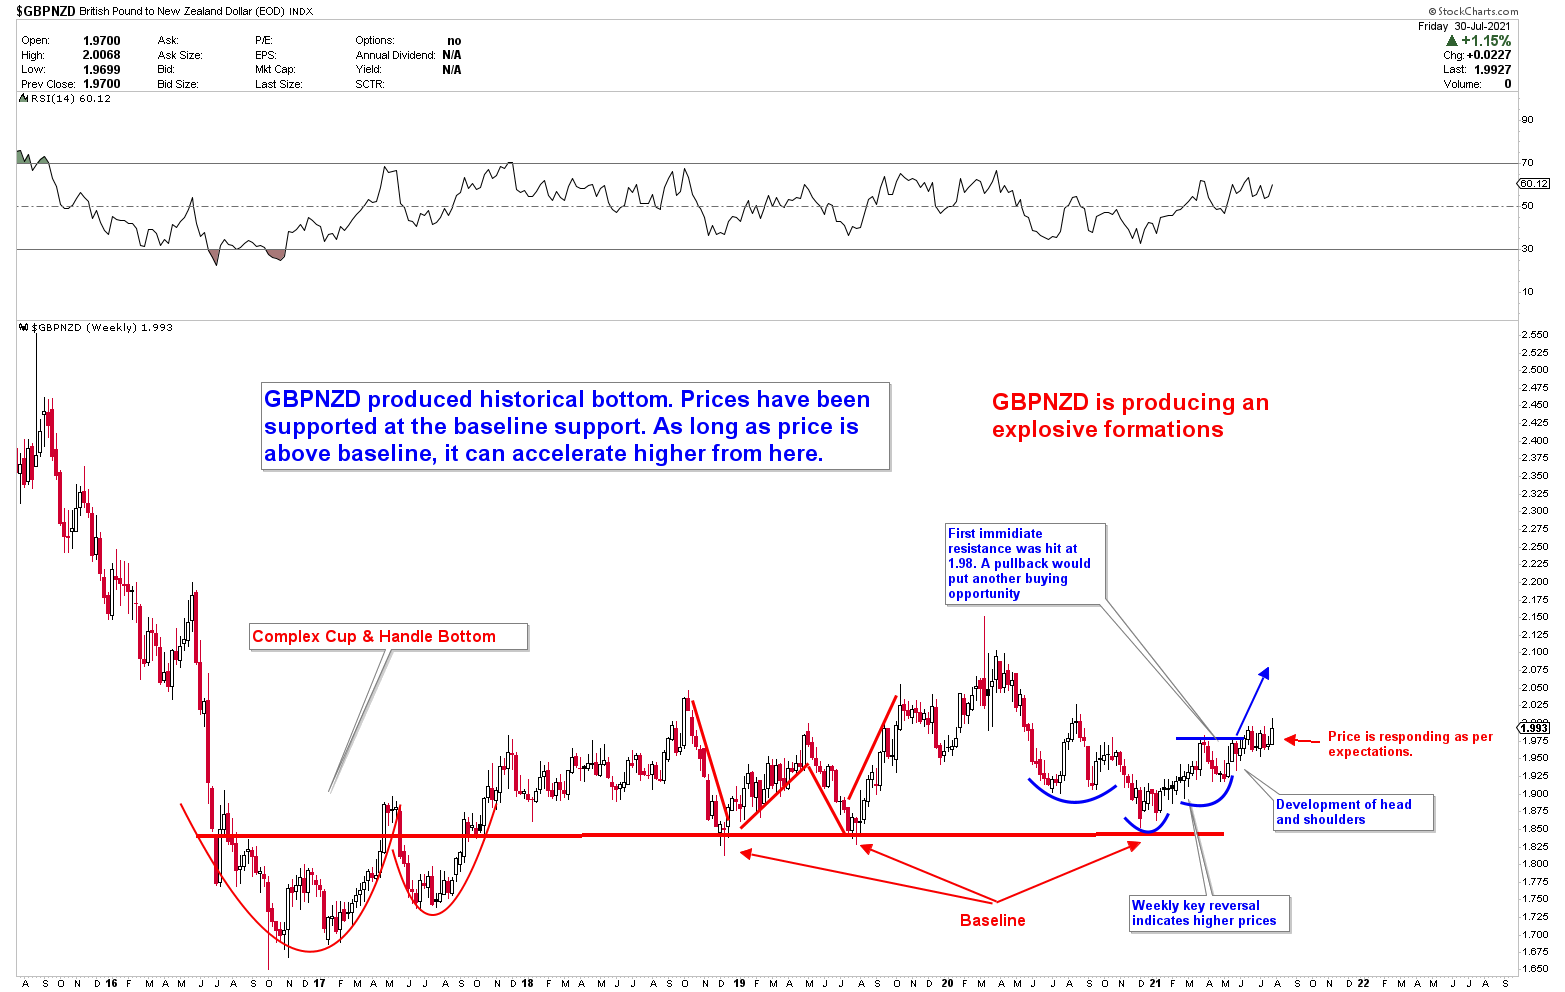
Prices fluctuated widely and shot up as the inverted head and shoulder pattern was broken to the upside. The explosive formations indicated an explosive move that caused the trading targets to book profits.
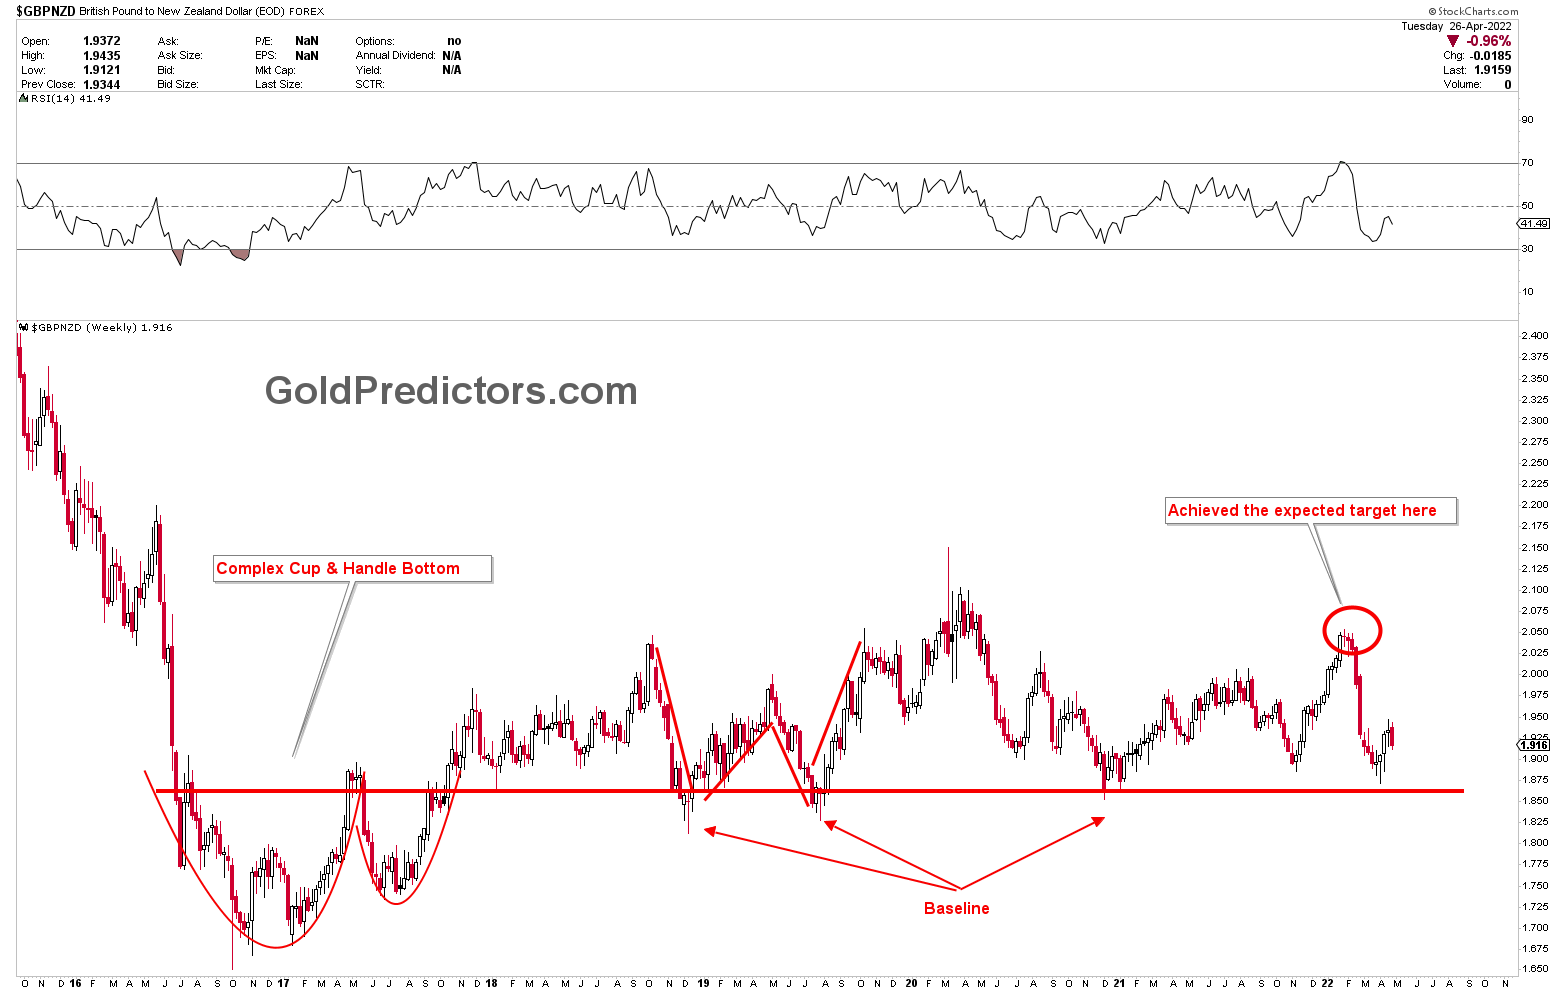
Aftermath of GBPNZD Prediction in 2022
The most recent update to the chart below shows the same chart with updated timeframes. The chart below shows that prices have already reached the listed target and have since retreated to the baseline. The recent rebound from the baseline is in full swing. Since the target has been met and a significant pullback has occurred, a new outlook has emerged. The GBPNZD chart requires more history to predict the next move in the GBPNZD.
To receive the free trading alerts, signals and articles please subscribe as a Free member to the link below.


