Weekly Forex Report
We have been very bearish on the dollar index since 2020. We identified hundreds of variables and there was not even a sole factor implying a bullish dollar bias. Since last year, dollar prices have dropped and have approached long-term channel support. This is where we said clearly in the premium update that a bounce would occur and would be a selling opportunity. In this forex report, we will discuss the Dollar index, GBPUSD, EURUSD, GBPNZD, AUDUSD
Weakest currency: JPY, USD
Strongest Currency: AUD & GBP
Best Instruments to Focus:
Long AUDUSD
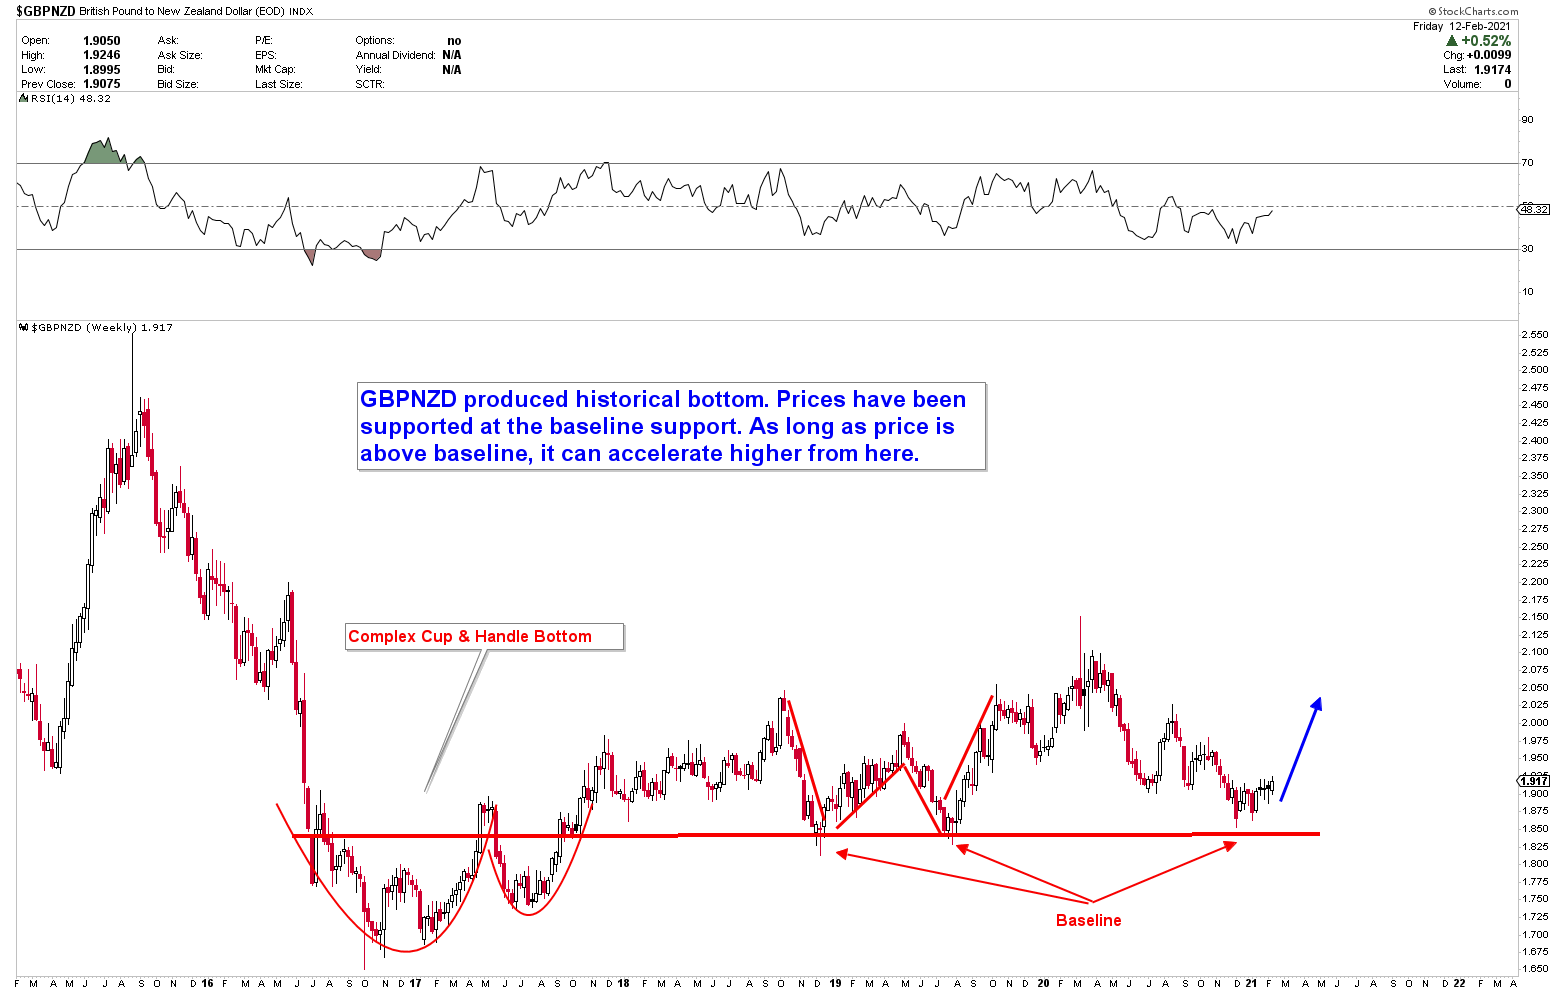
Long GBPNZD
Long GBPJPY
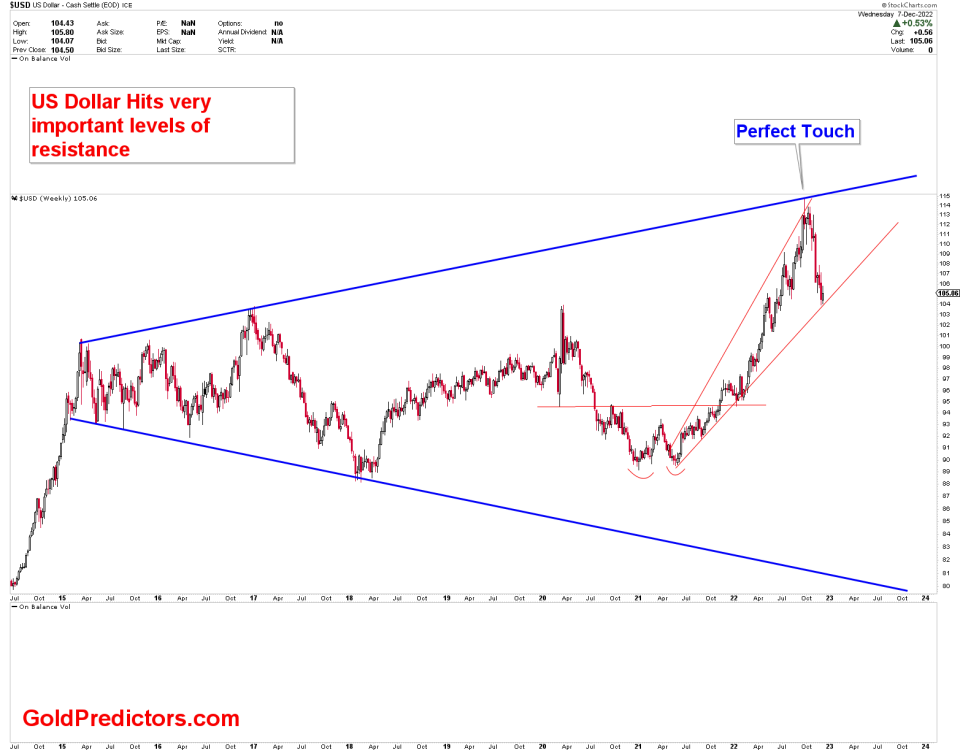
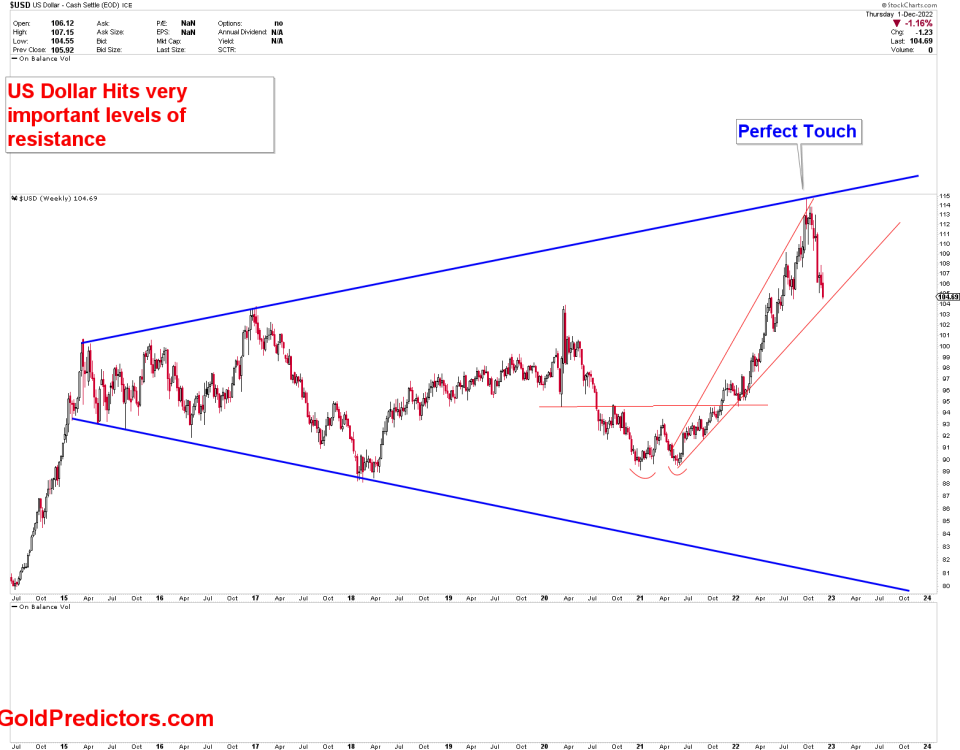
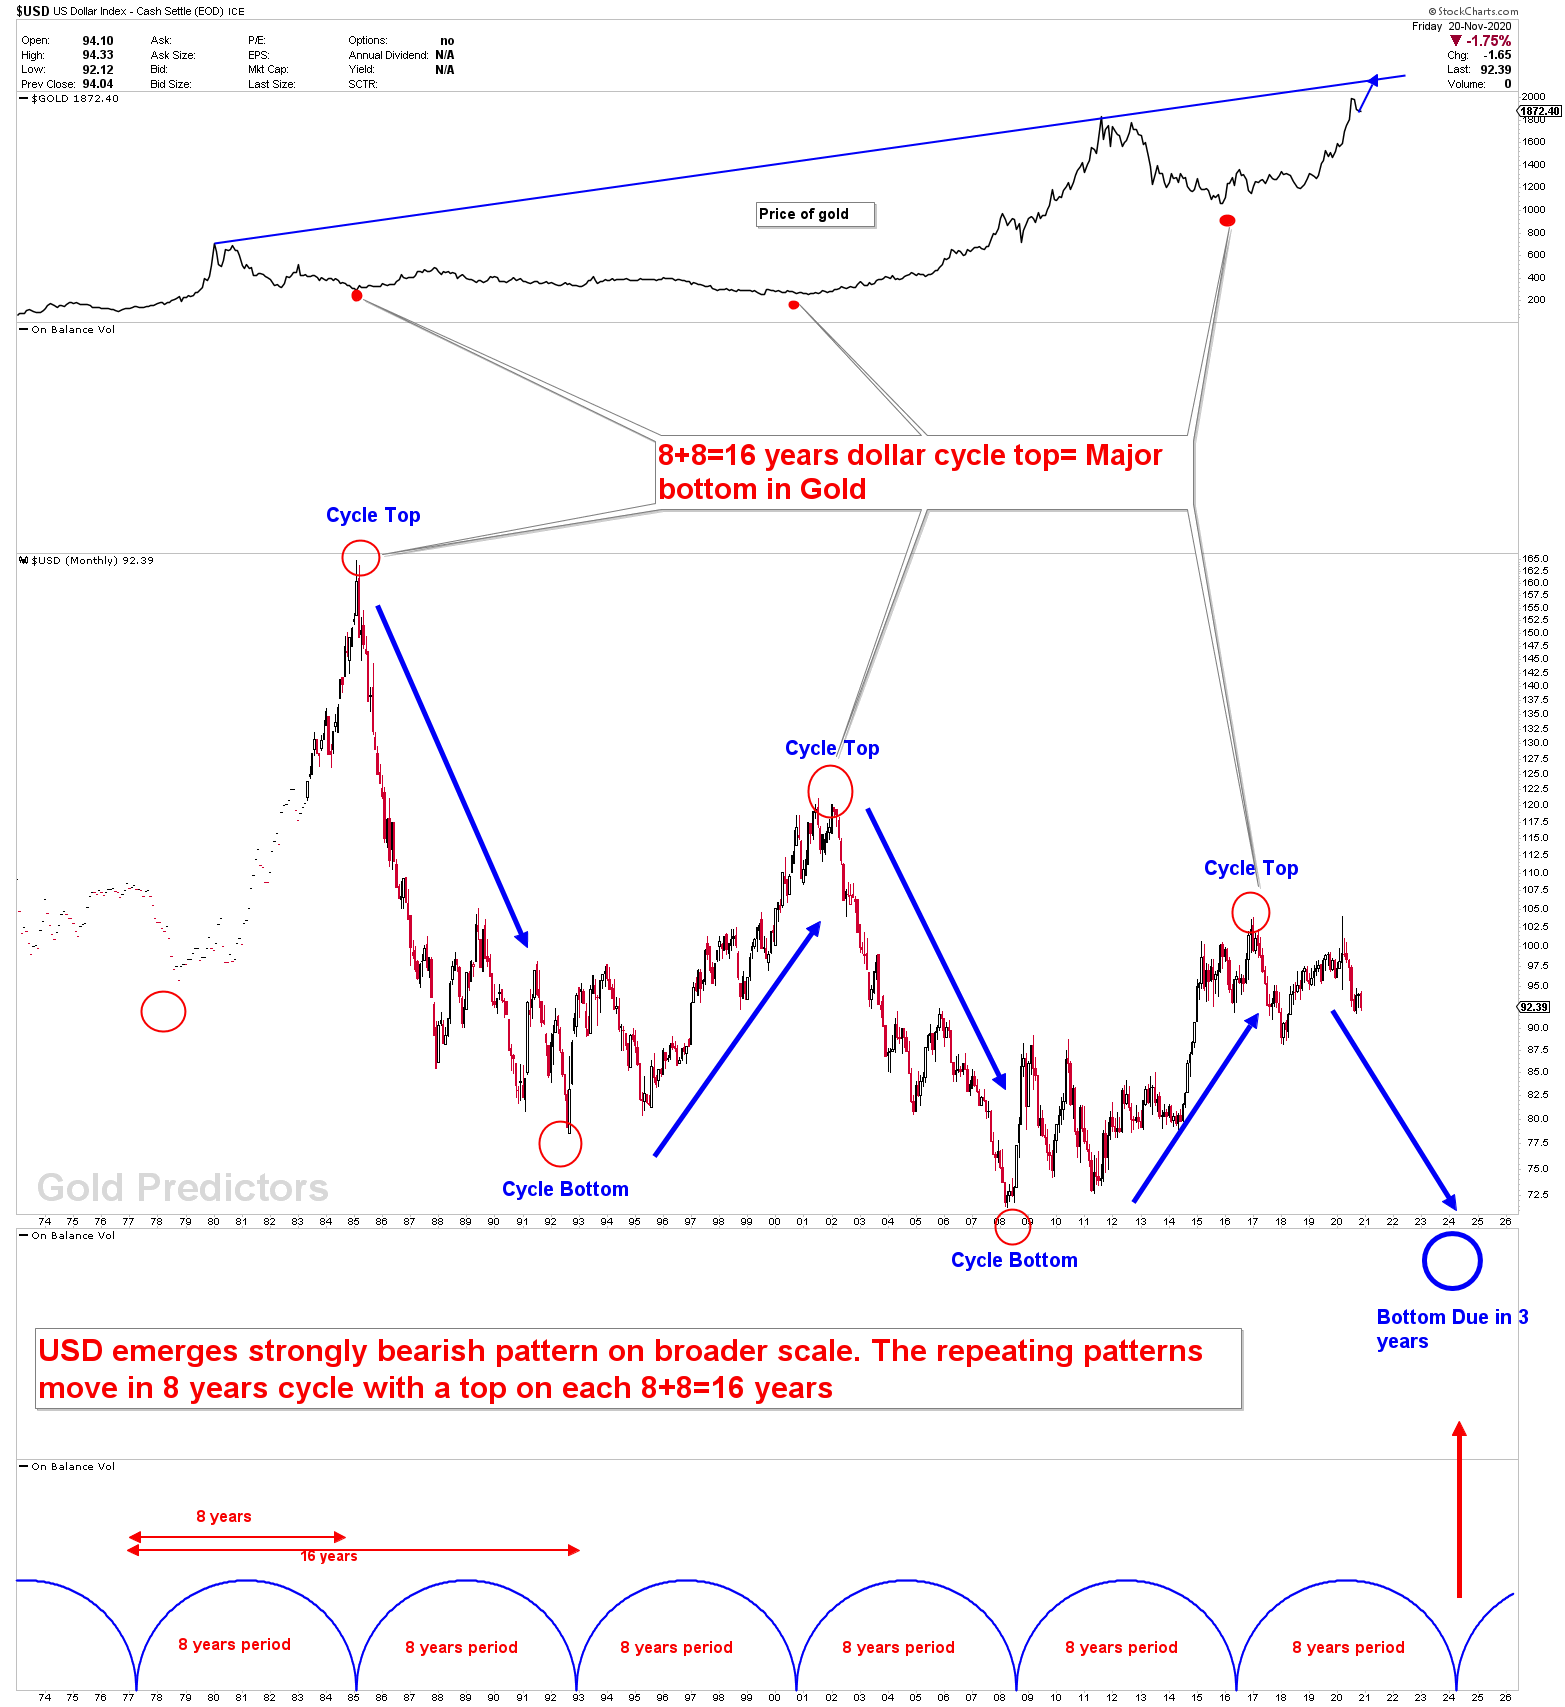
Let’s have a look at the long-term cycle chart for the dollar. We demonstrates this chart to premium members in a gold premium update a few months ago and what the charts say is very clear. In the gold update, we will discuss this outlook further. Lets jump to another chart.
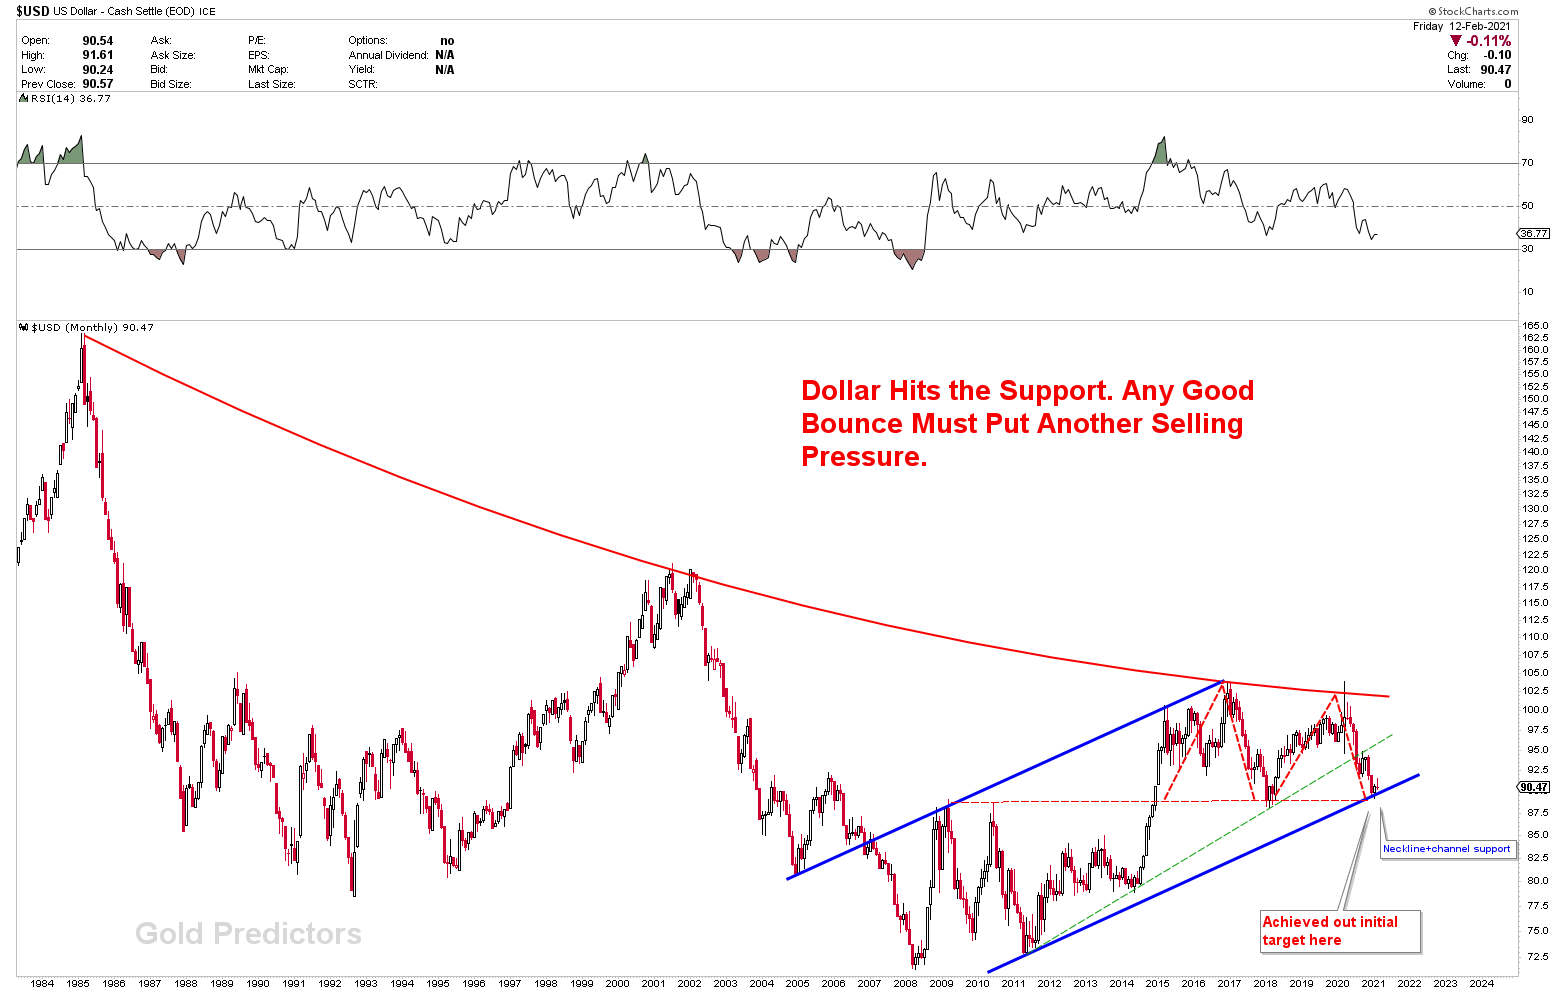
The monthly dollar chart shows that prices are touching the conjunction of support where the neckline of M type patterns and blue channel support line meets. That was the reason for dollar bounce last weeks. But we mentioned that this bounce must be a selling opportunity. In any case, a break below this neckline is a waterfall behaviors where dollar will flushout.
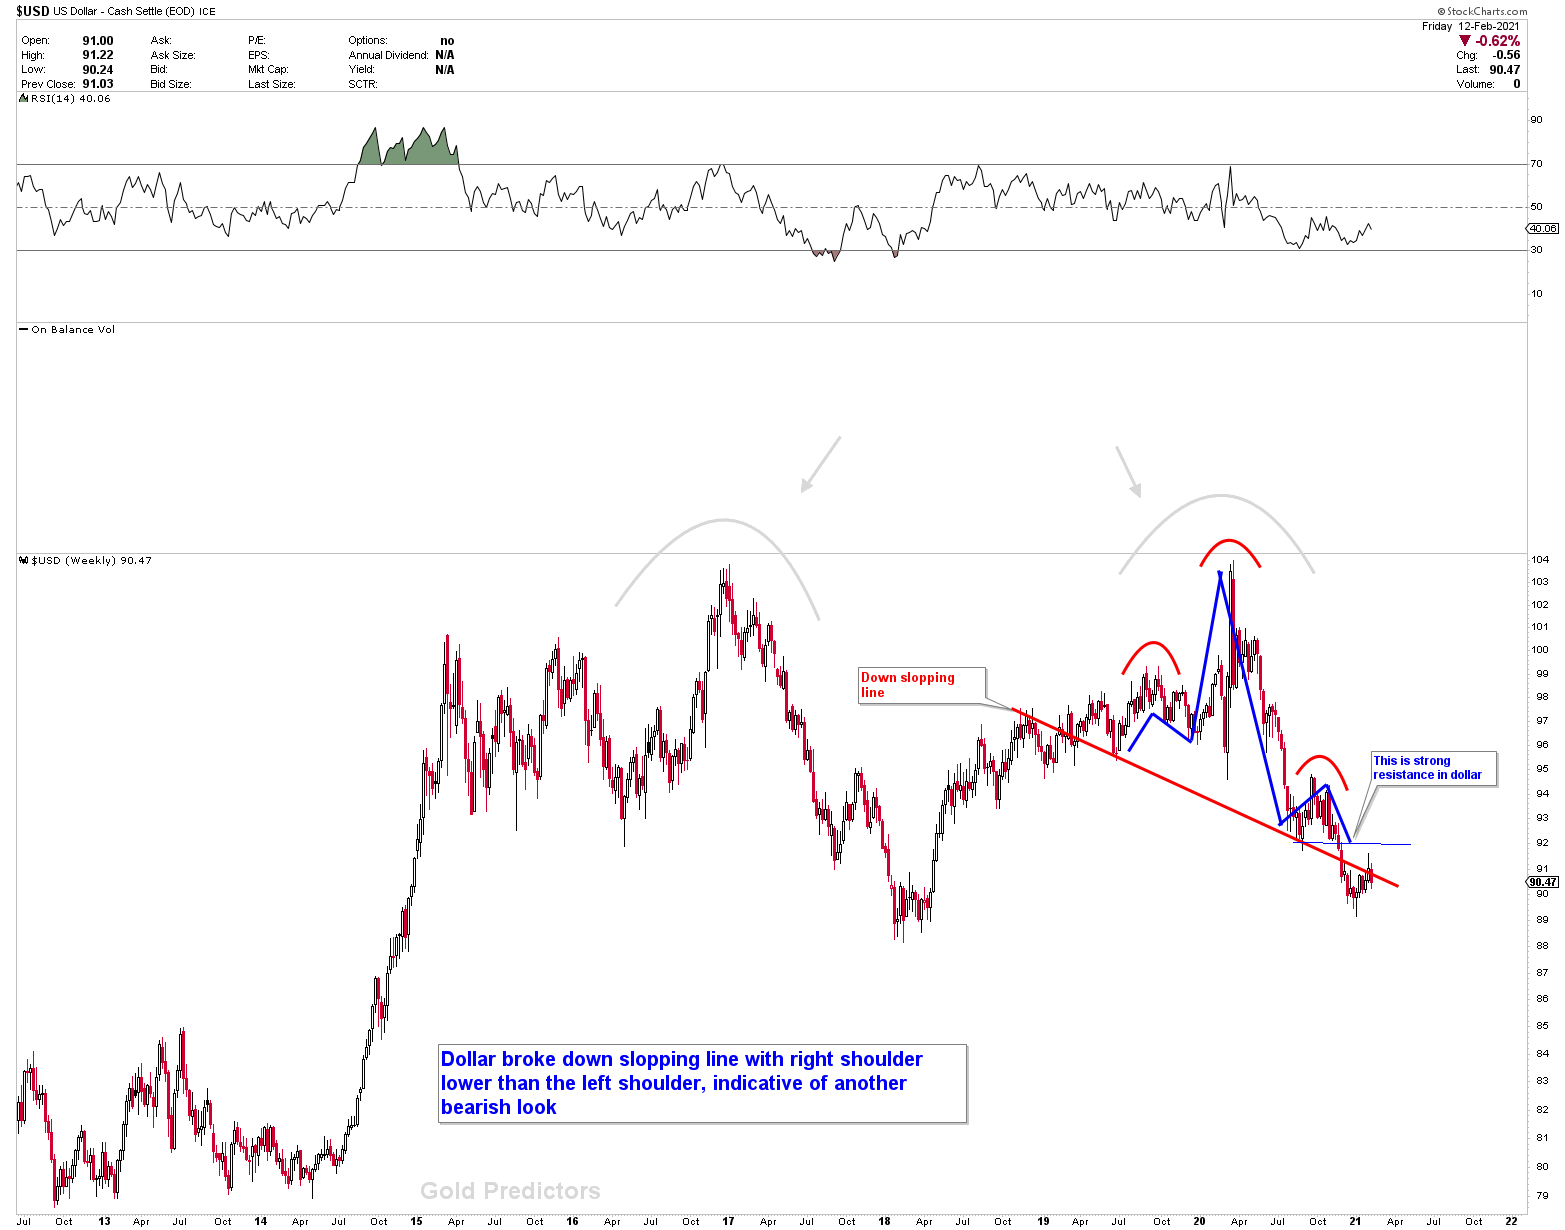
The weekly dollar data shows that the bounce is about to over and the price is slopping down in the next direction. While monthly charts are supportive, due to strong fundamental reasons, we are still bearish in dollars. The chart presents the neckline in the form of down slopping neckline. Down sloping line head and shoulders are more bearish than the normal one.
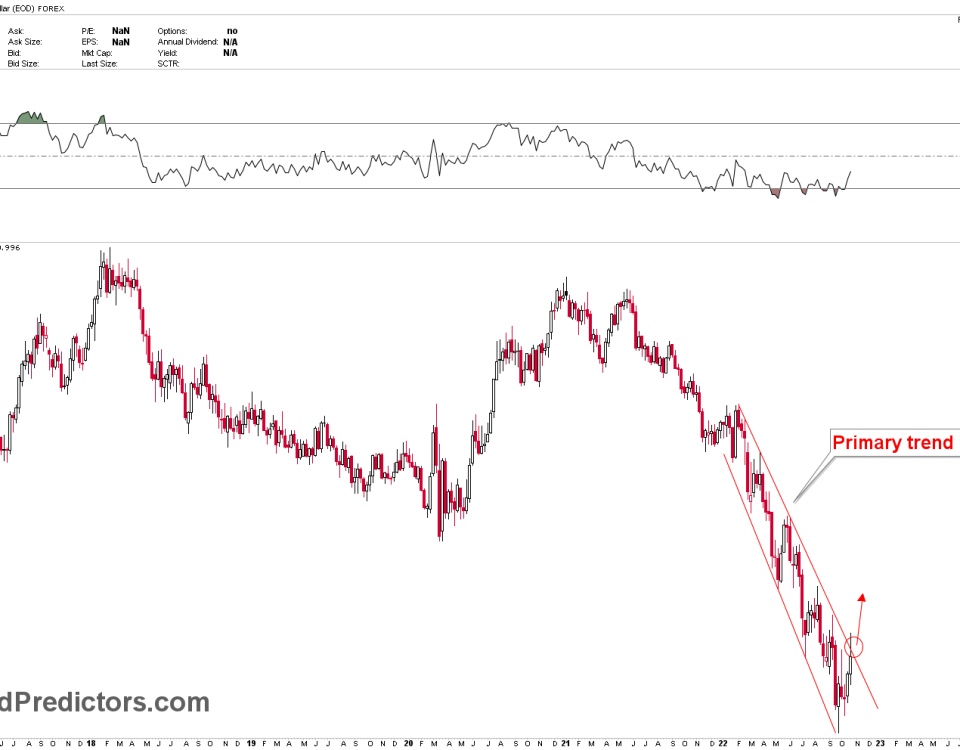
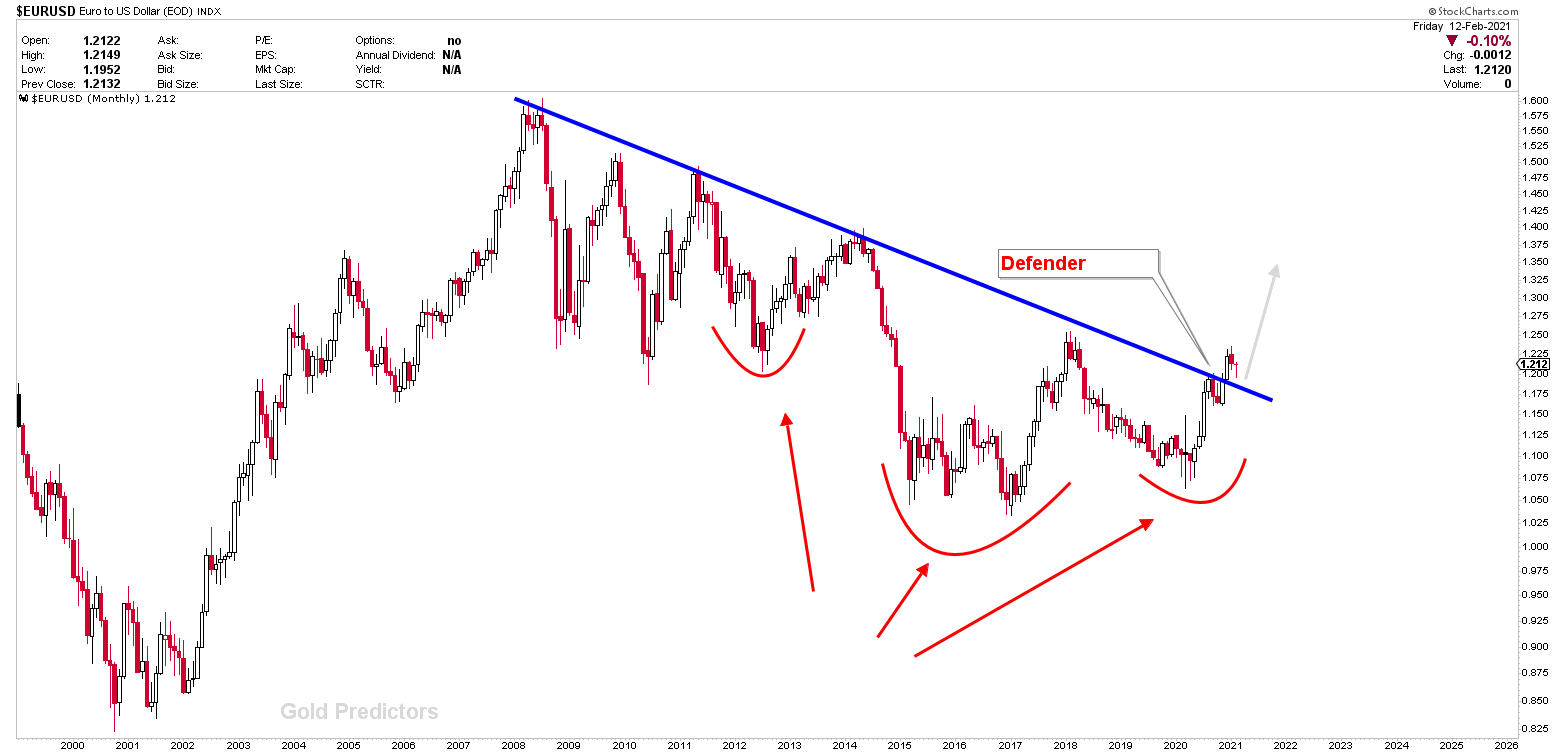
Normally, EURUSD is most beneficial when the USD is bearish. As we have been bullish on this instrument for the last 2 months, EURUSD is rising through the long-term barriers. The EURUSD monthly chart shows that the price has come out of the Defender, which has been blocking prices for last 10 years. It looks like if the USD breaks the blue channel on the monthly chart, EURUSD will explode through all barriers.
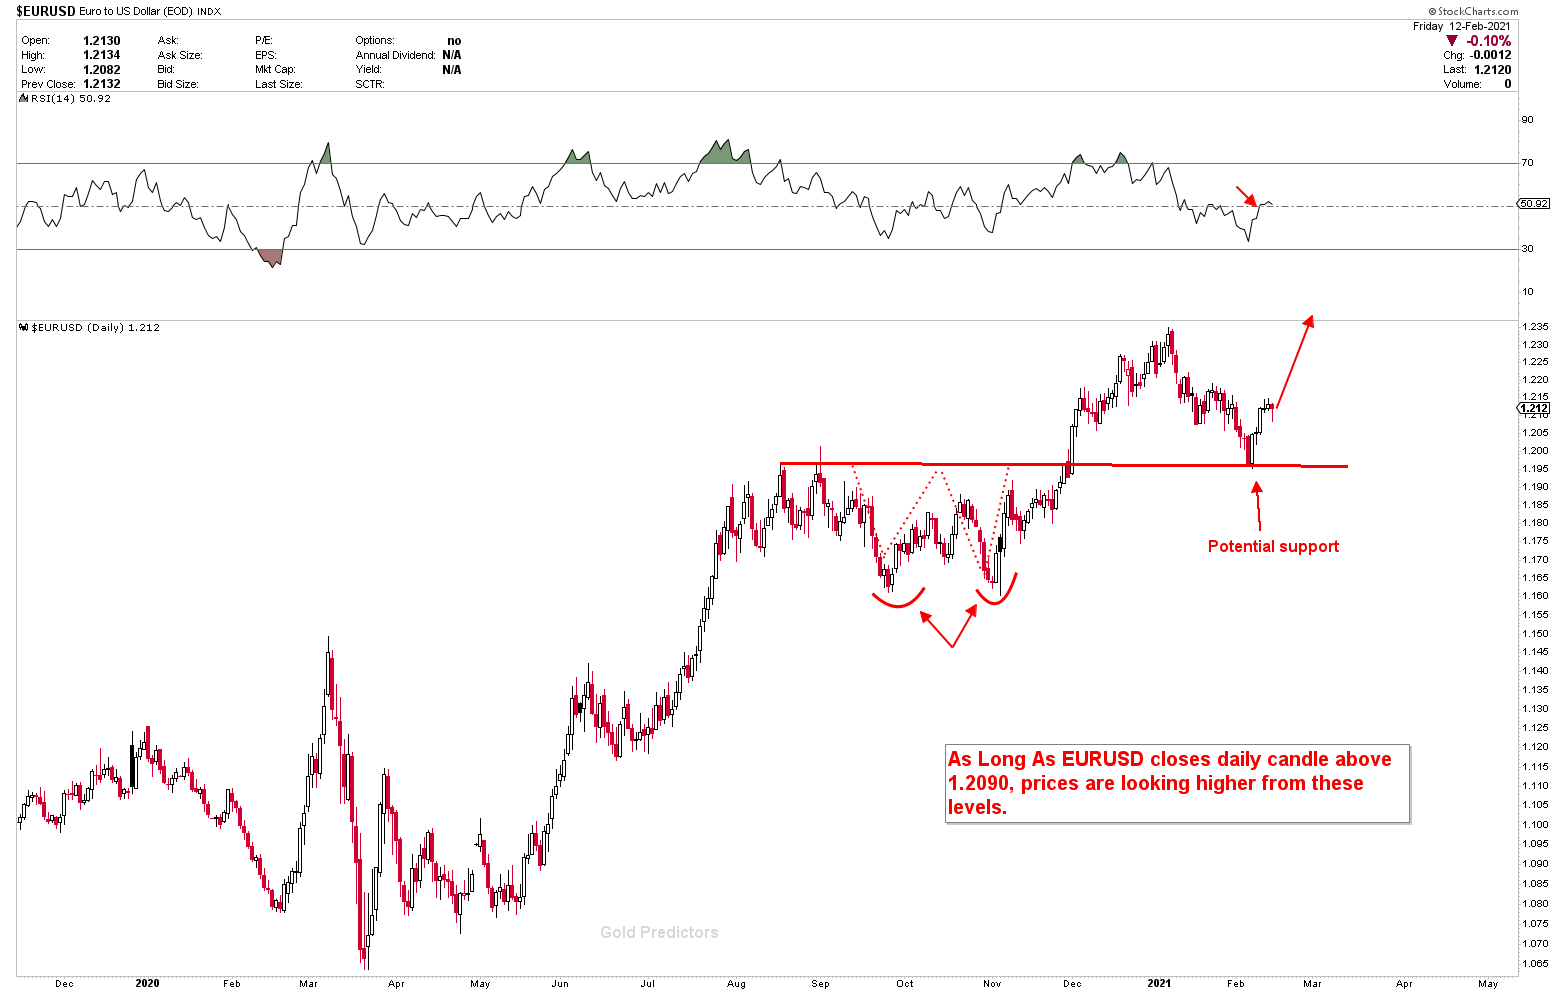
EURUSD daily charts shows that latest hit of bottom was an awesome buying opportunity.
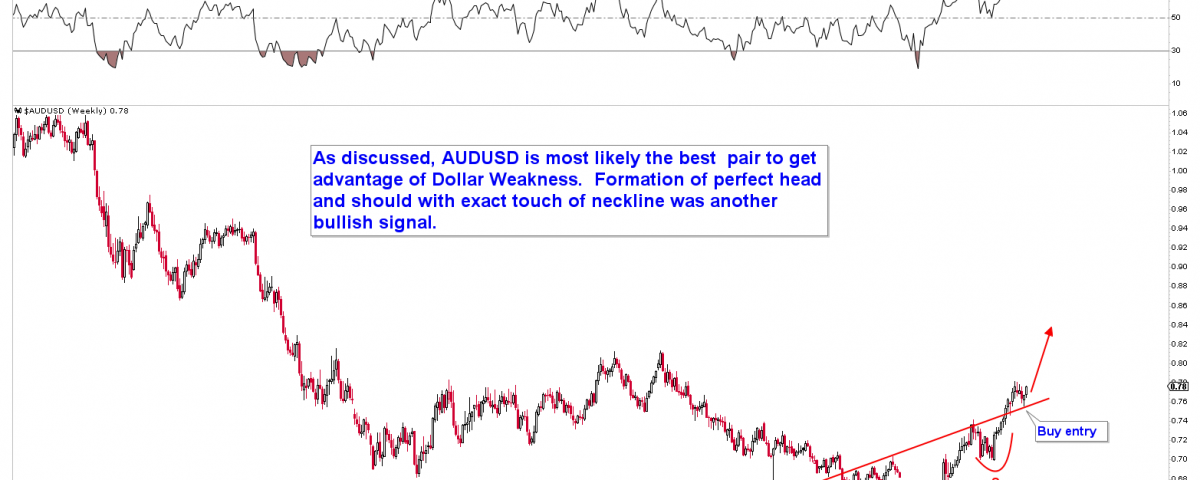
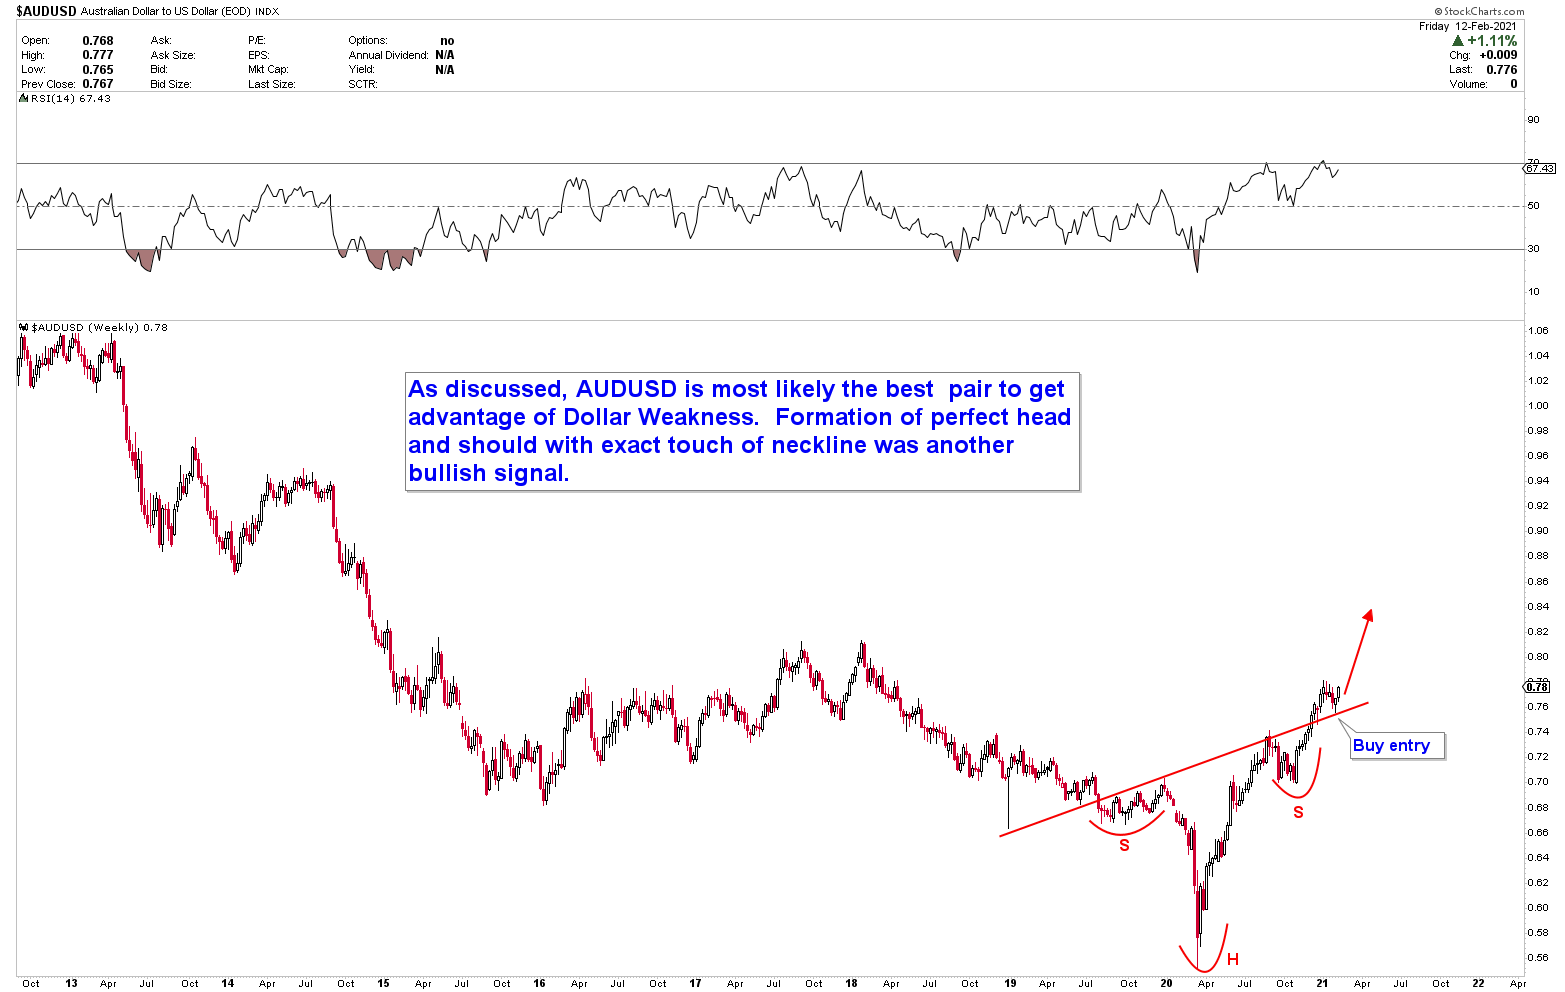
Well, the EURUSD structures are not that impressive compared to the AUD structures. The best pair that will explode this time, would be AUDUSD if the dollar is dumped. Many emails were sent to private investors about the emergence of bullish bias in AUDUSD in the last three months. This instrument looks like it will continue to explode in the coming weeks.
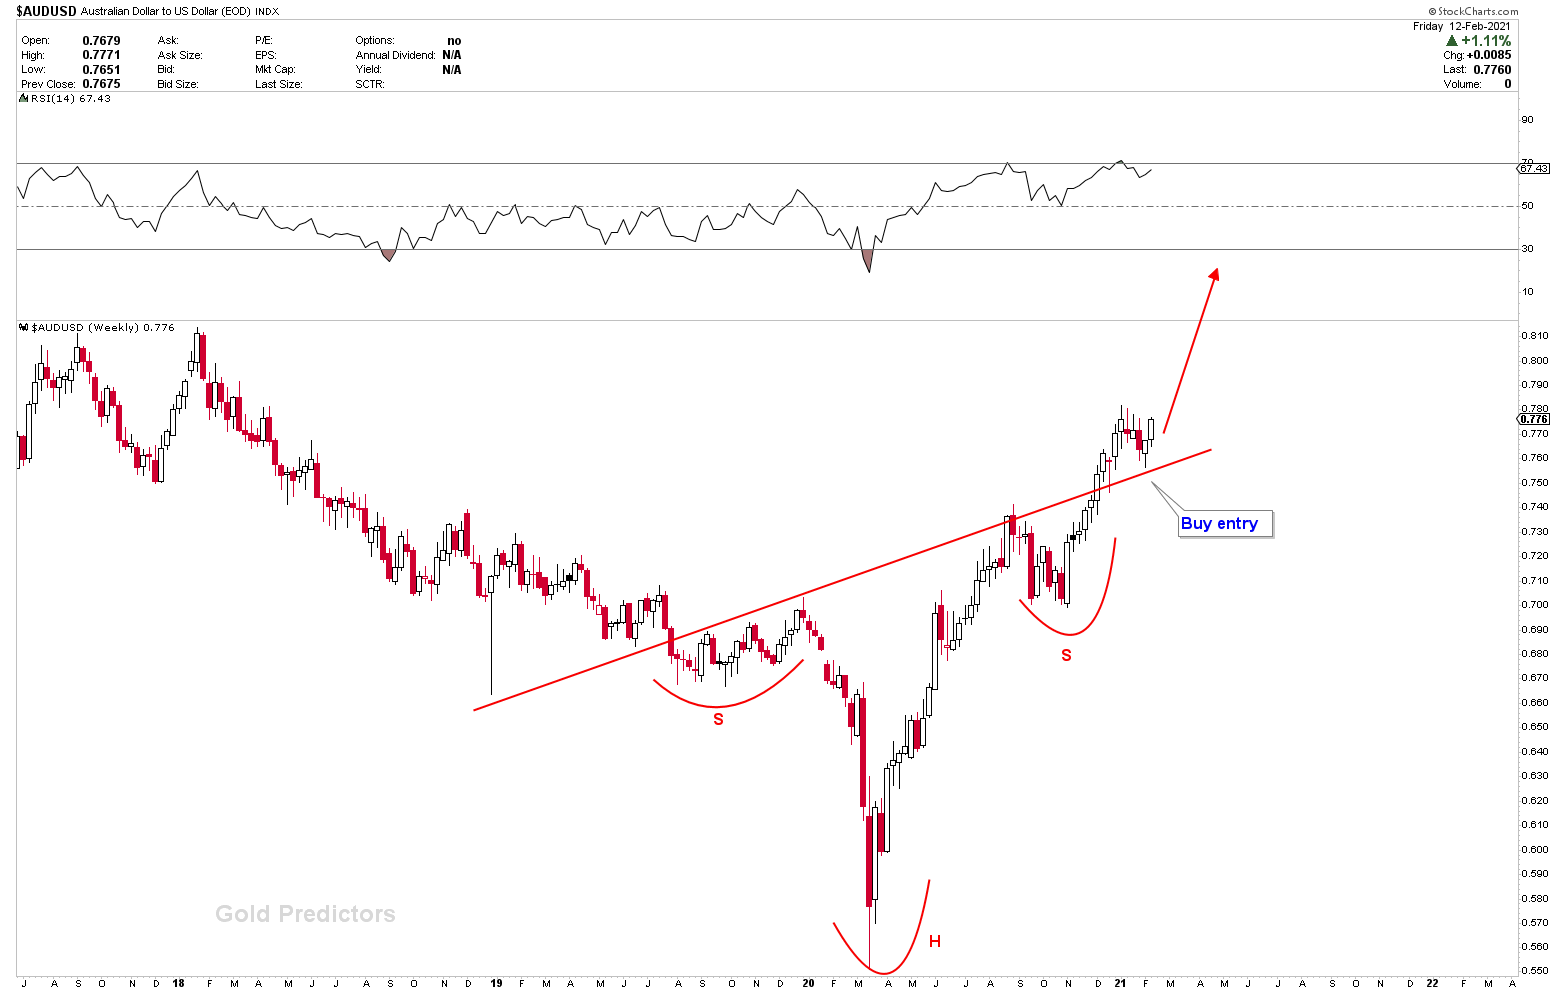
To observe the precision of the inverted head and shoulder, let’s zoom the formations out. The neckline is slopping up, versus the dollar, which is slopping down. The UP slopping neckline inverted head and shoulder usually explodes with higher velocity.
There are other bullish gatherings in the GBP pairs. For the weeks ahead, we see GBPUSD, GBPZND and GBPJPY as bullish instruments. The GBPUSD weekly chart shows the Blue Double Bottom. The neckline of this double bottom is 1.42-1.44, where the pair will head in the next few weeks. But it would be explosive after a break through a blue line because the instrument is supported by Red inverted head and shoulder. In GBPUSD, the total structure is bullish.

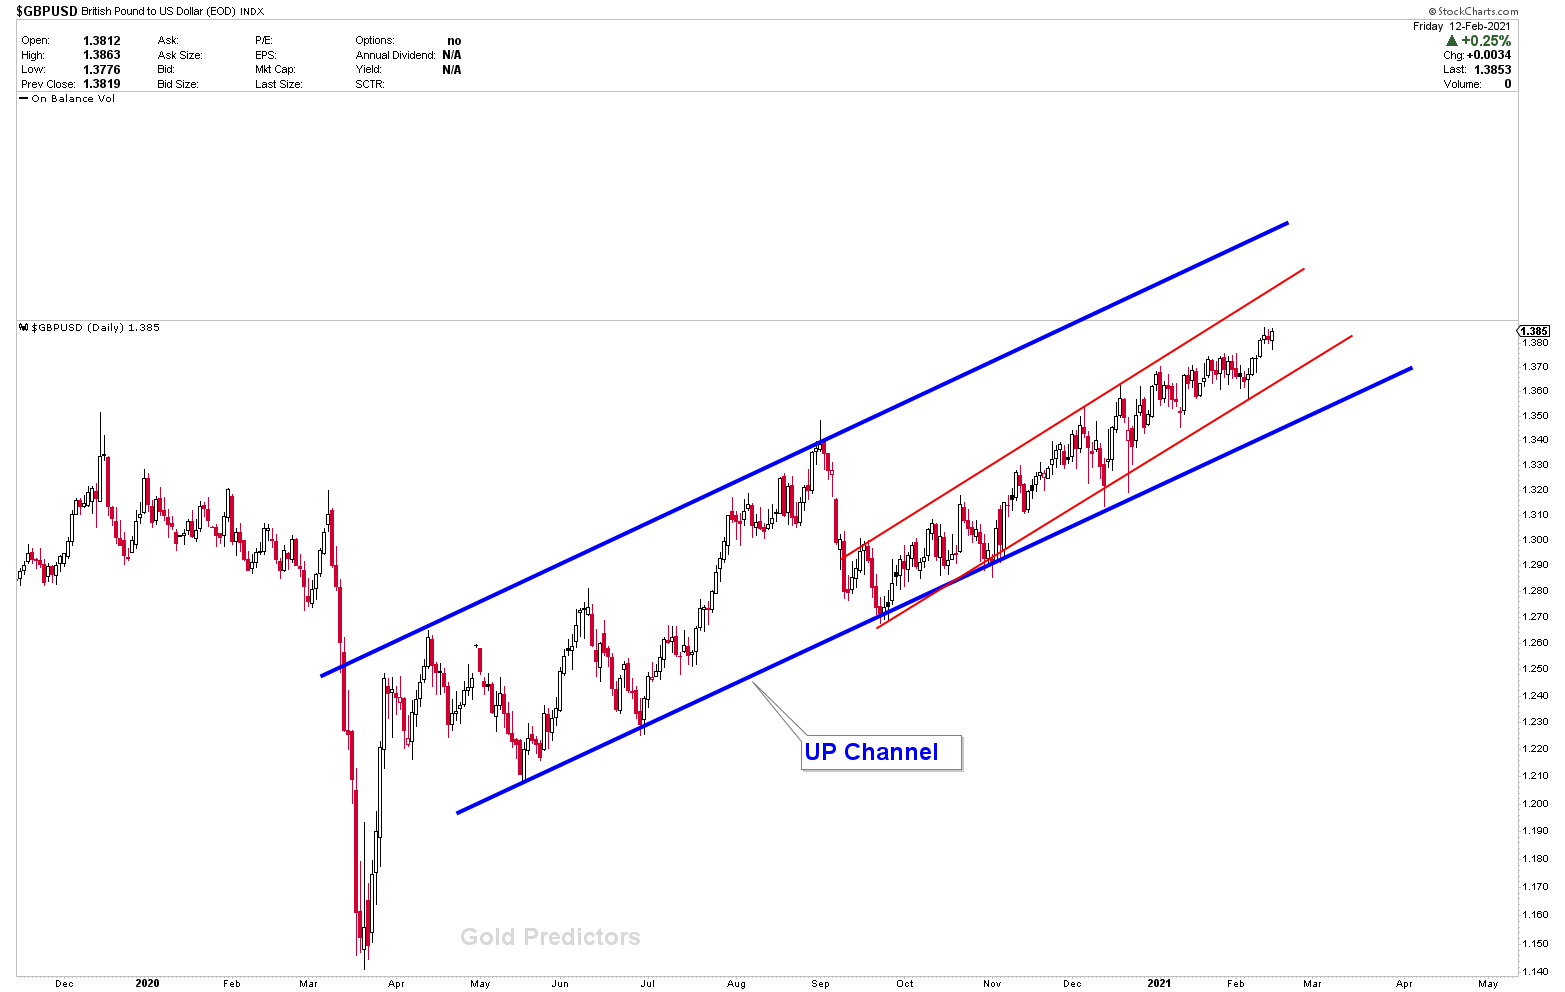
Let’s zoom out GBPUSD on daily charts. In the blue channel, prices are rising and prices are expected to increase further because each selloff is reversed by powerful moves suggesting strength in this instrument.
A look at GBPNZD shows that the instrument produced a complex CUP and handle and has been supported for a very long time at the baseline. At baseline, currently prices formed a complex support and it looks like this pair will rocket higher if baseline support holds.
Dollar is trading at some significant areas, but we still favor some pressure to remain. A break of dollar from blue channels on monthly chart would complete M pattern and suggest dollar flushout. AUDUSD is ready to take the advantage of the phenomena based on the formations.
To receive the free trading alerts, signals and articles please subscribe as a Free member to the link below.


