US Dollar Rebound From Supports
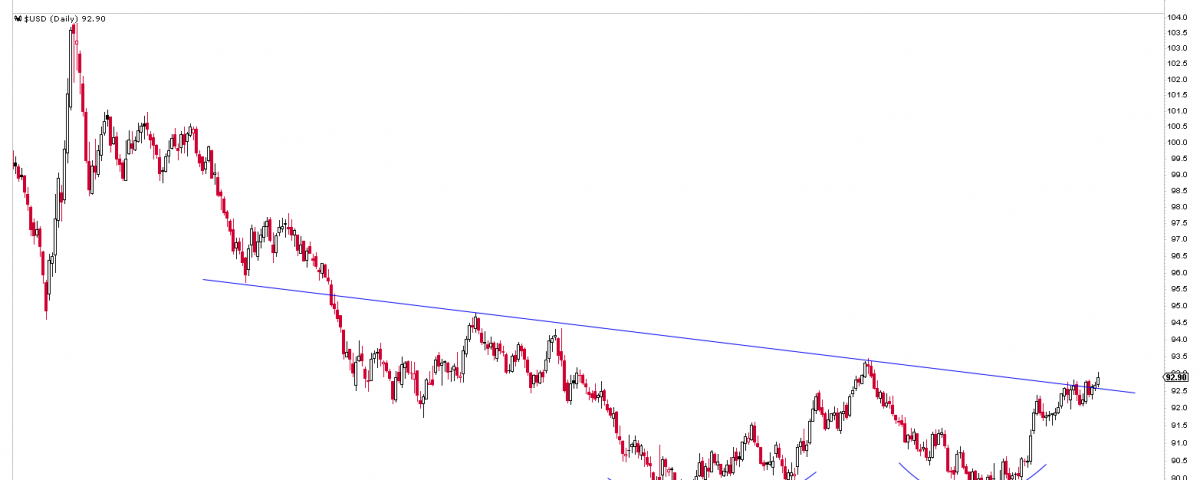
We discussed the Japanese Yen, trading at the inflection point last week, where a significant move is expected. Japanese Yen is reacting at the inflection area and falling from the long term resistances. Despite the inflationary bomb, the stocks, commodities, and forex markets are stuck in a rut, and the bond market is in jeopardy, implying that the summer doldrums have arrived. The US dollar rebound from a long-term support juncture. This rebound indicates that the index will rise in the coming days, but a decline is expected soon. A few of the charts below help to explain the situation.
Best Instruments to Focus:
Short NZDCAD
Long GBPNZD
Summer Doldrums
US dollar Rebound
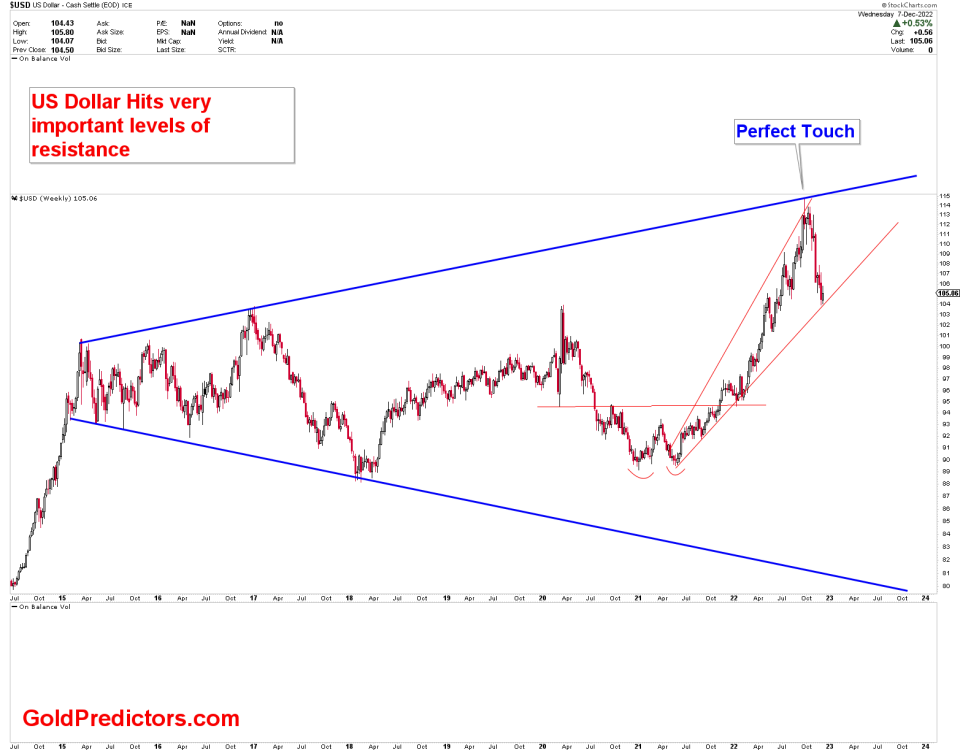
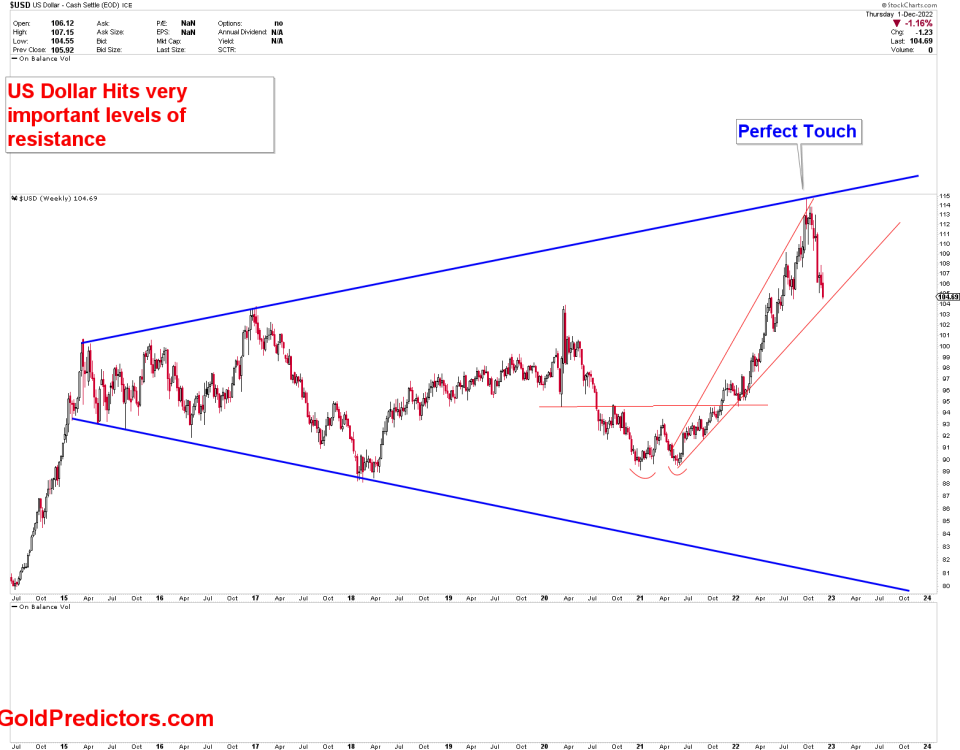
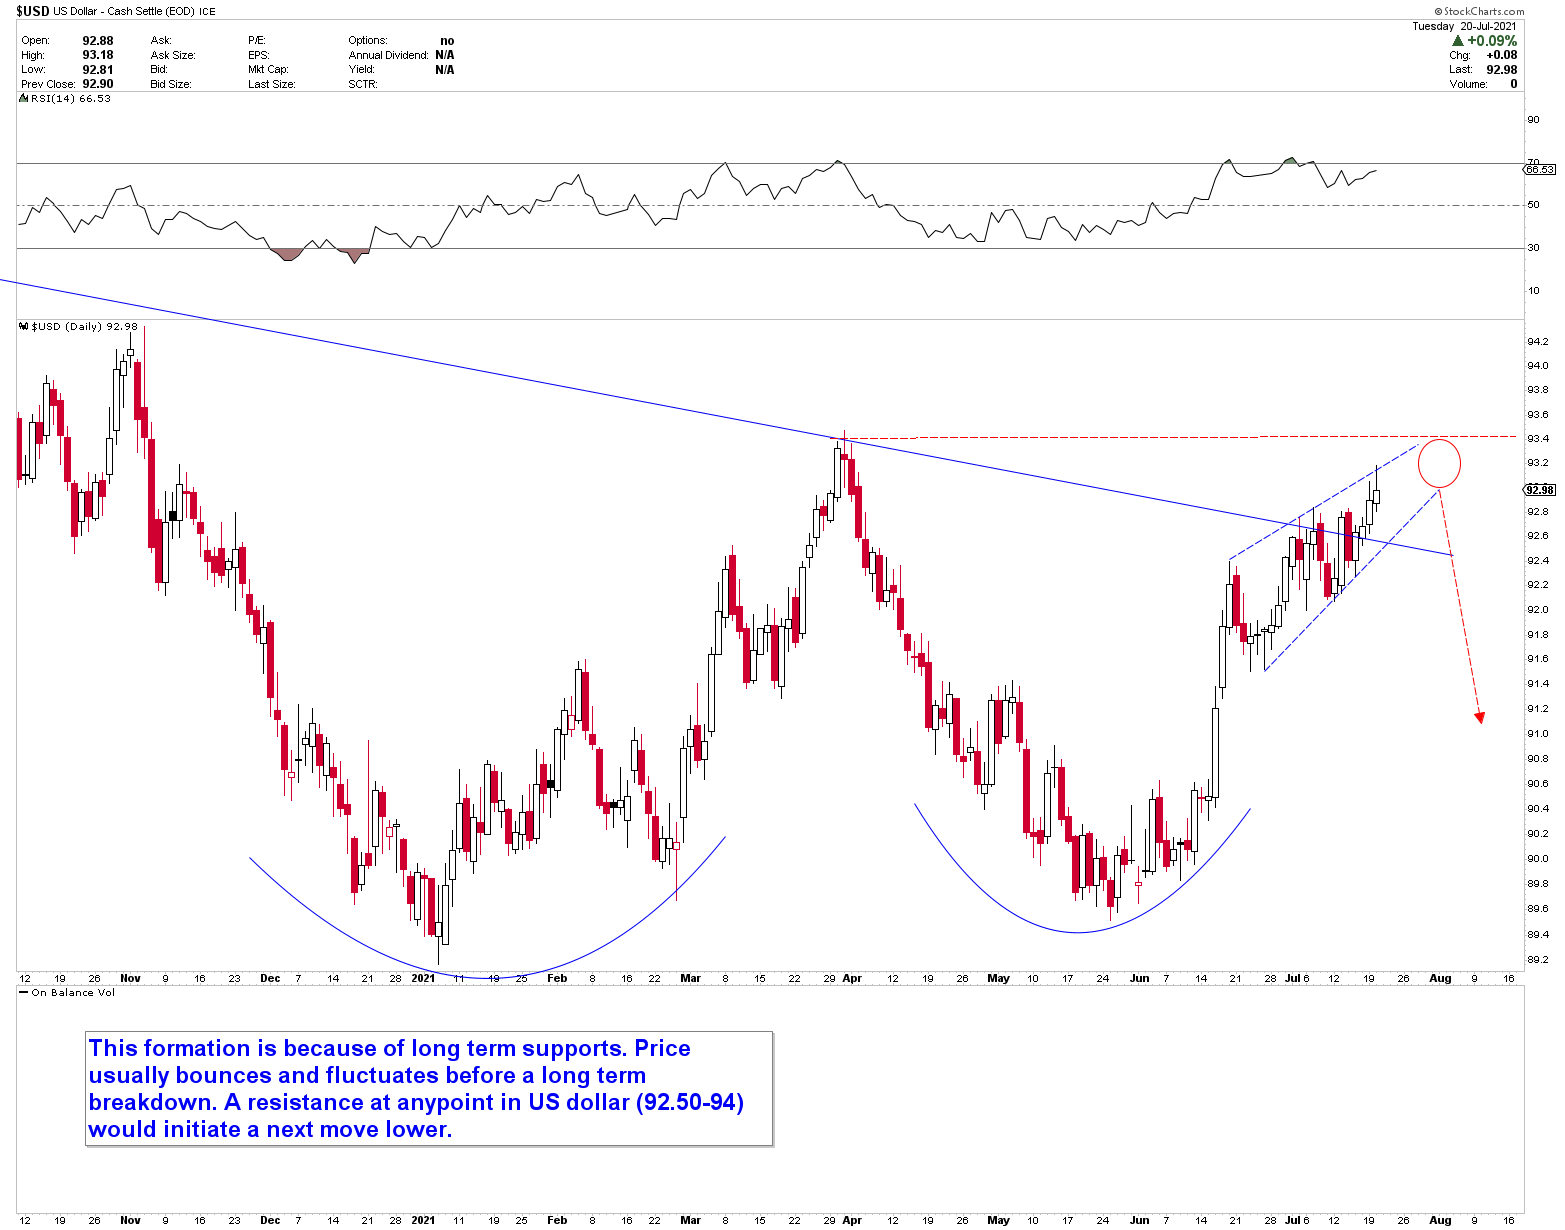
The zoomed out view of the US dollar index chart, as shown below, depicts long-term support. The US dollar is likely to churn at these levels for a while longer, before the next crash.
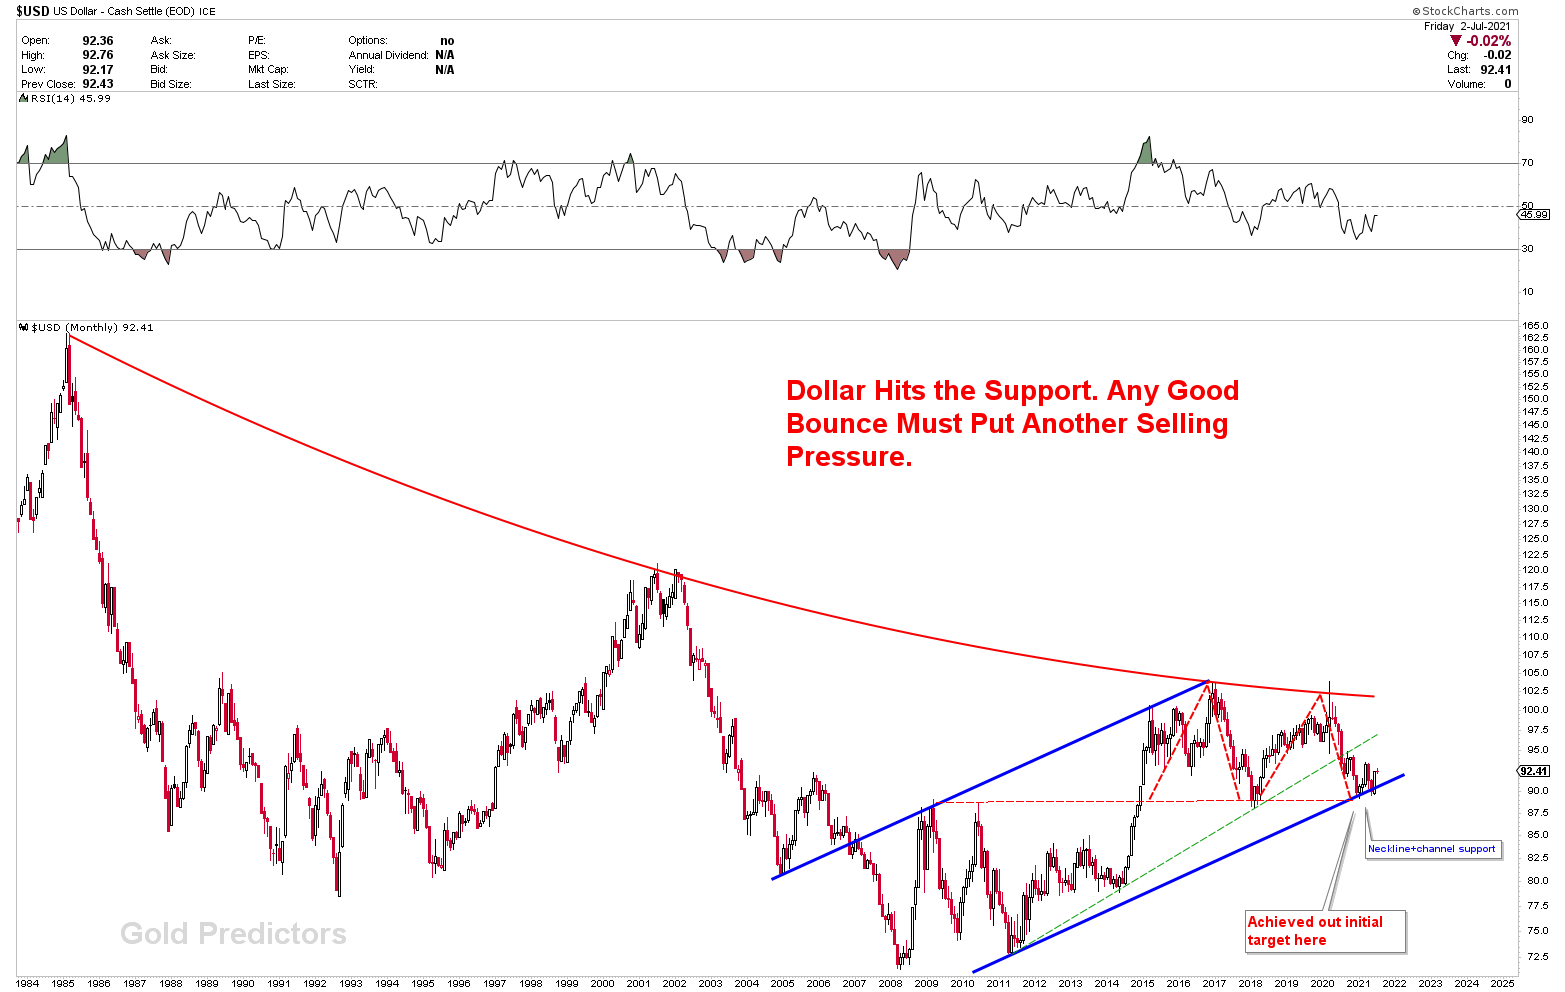
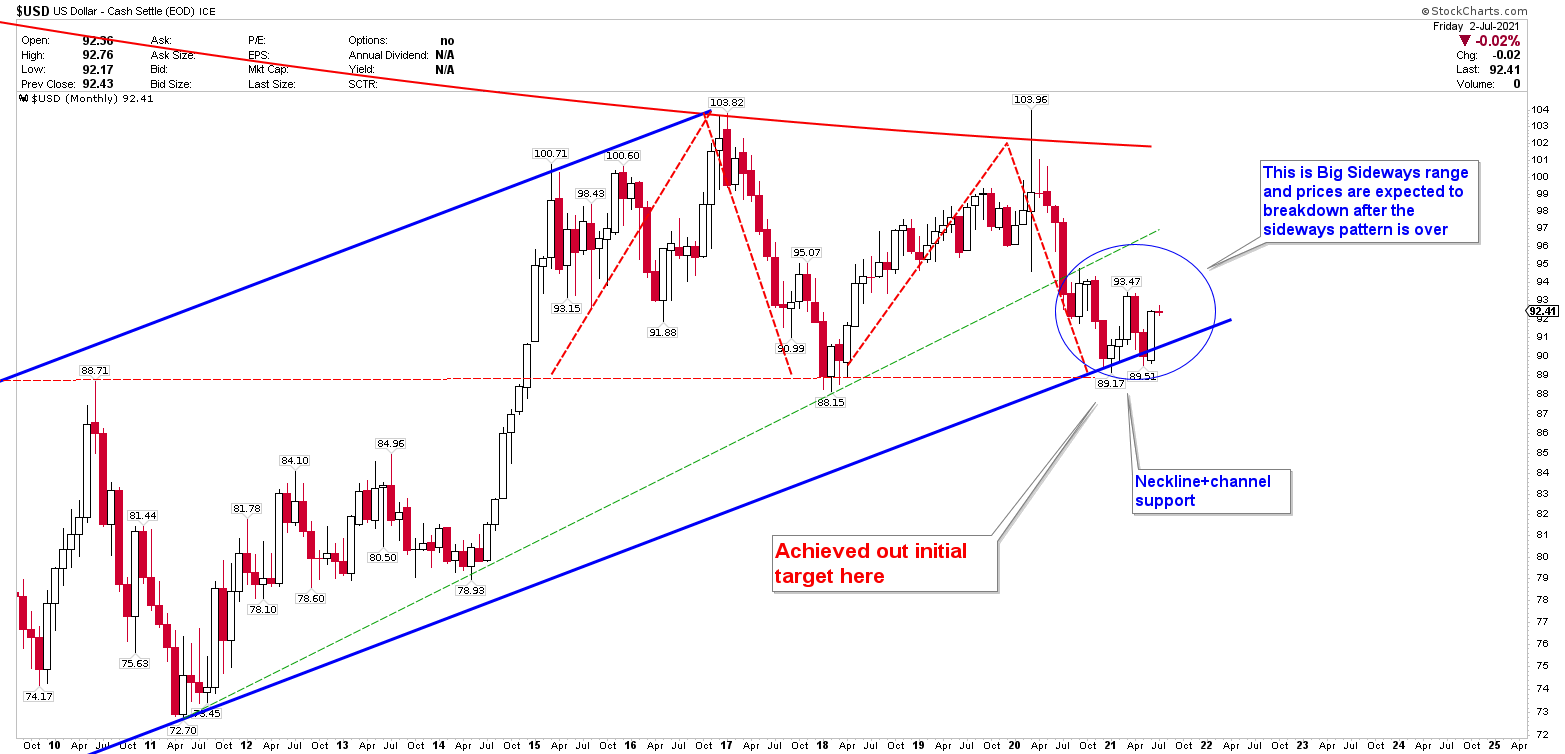
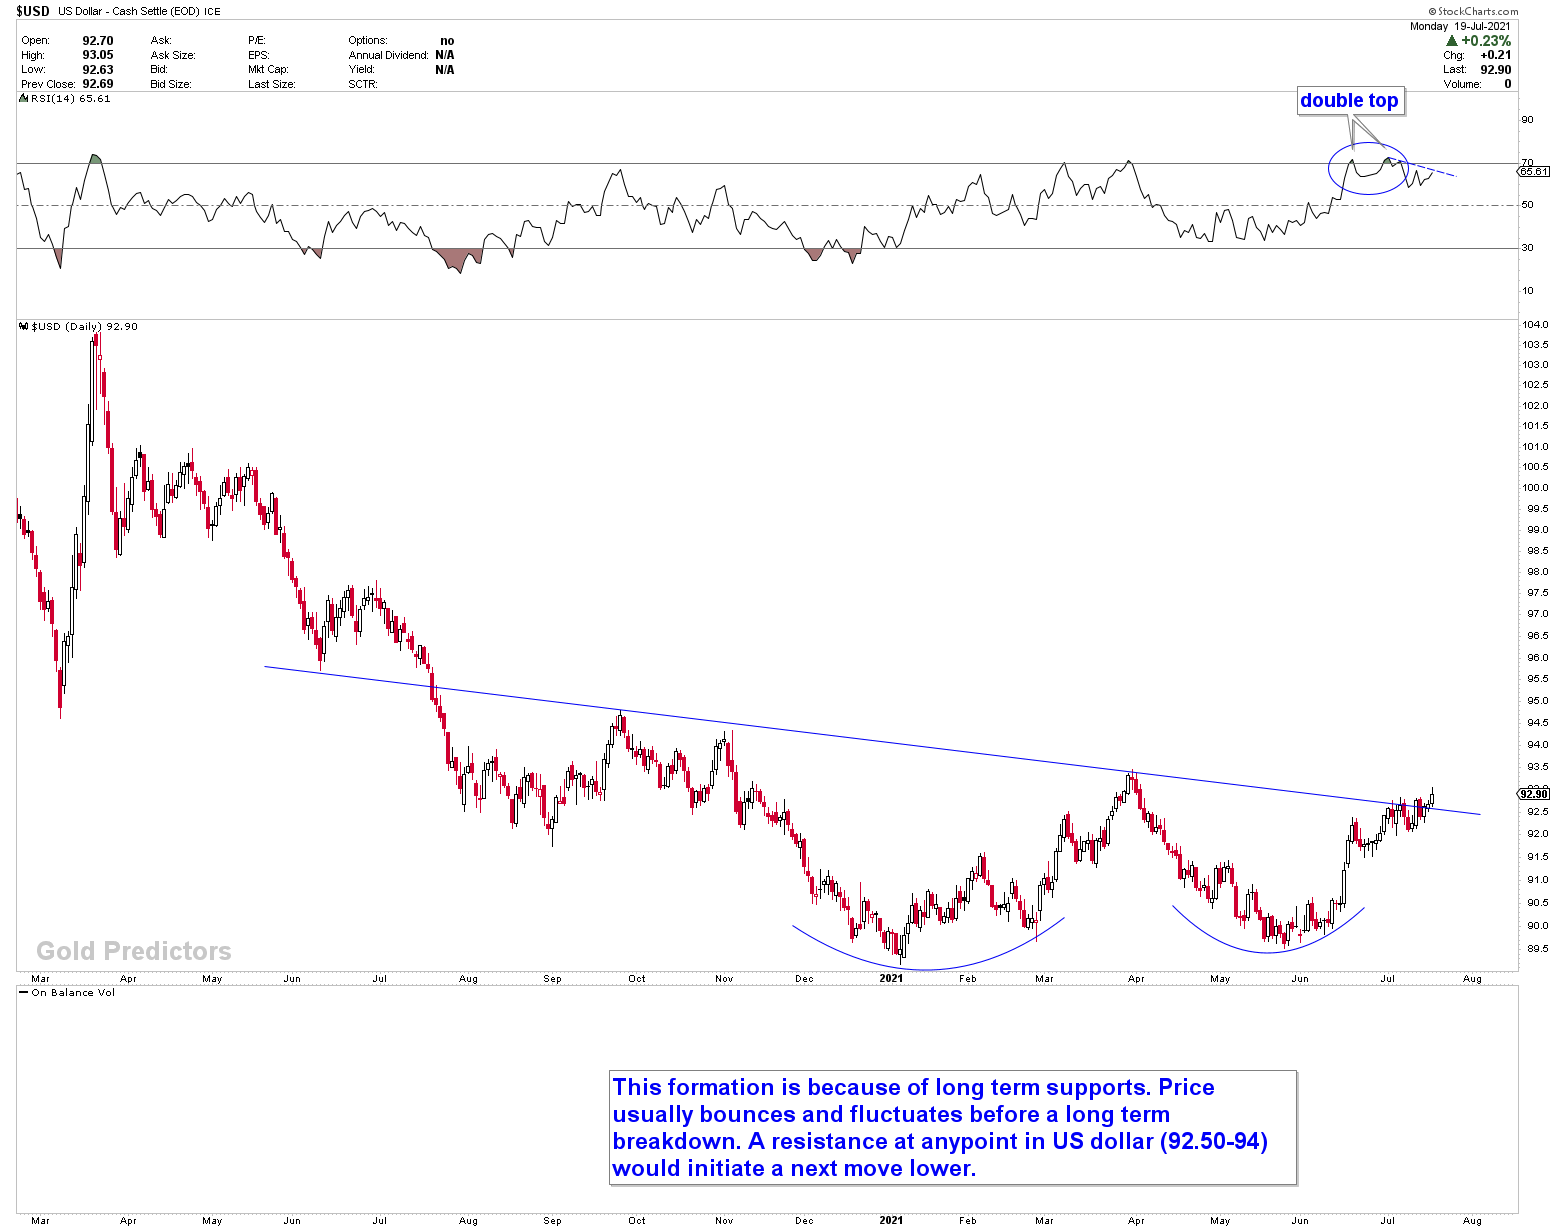
From the daily chart, the US dollar is attempting to break the trend line from last week. A break may take it to the resistance at 93.50. The zoomed-out view of the US dollar chart, on the other hand, shows a rising wedge, which is a bearish pattern. The emergence of these patterns at 93.50 suggests that the index will fall if the rising wedge patterns are broken to the downside. Overall, there is no progress in patterns and the US dollar rebound appears to be in a trading range of 89 to 93.
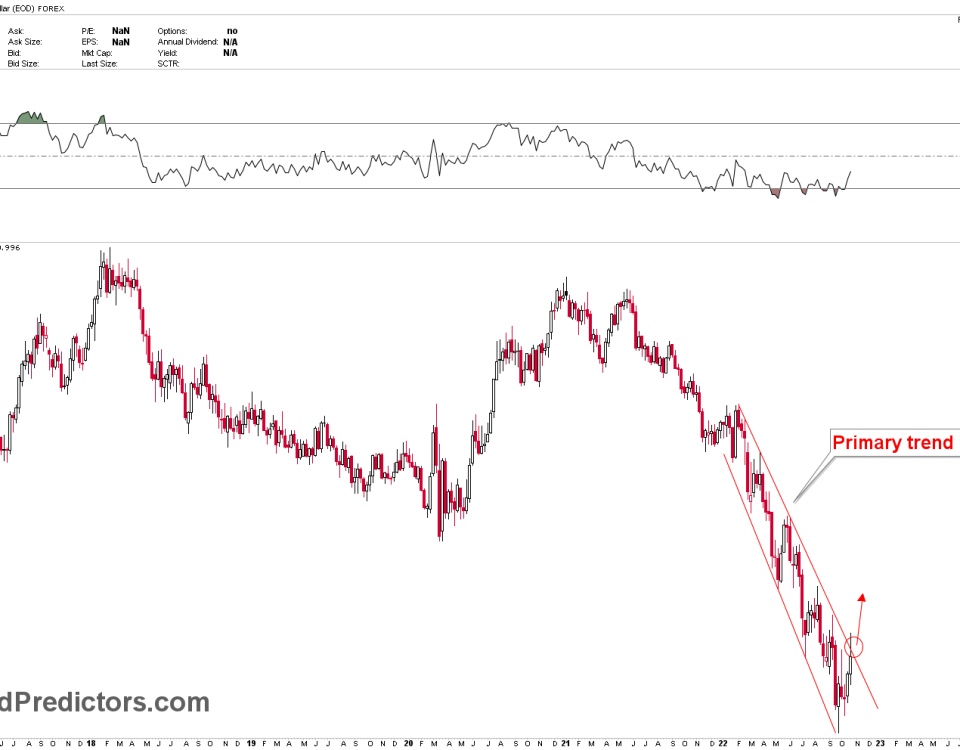
The falling wedge in the EURUSD chart reflects the rising wedge in the USD index, since the US dollar is inversely proportional to the Euro. Last week, we presented the same chart, and prices are still stuck in the wedge. The falling wedge is a bullish price pattern in which the EURUSD will rise if it is broken to the upside.

GBPUSD Reversal From Long Term Resistance
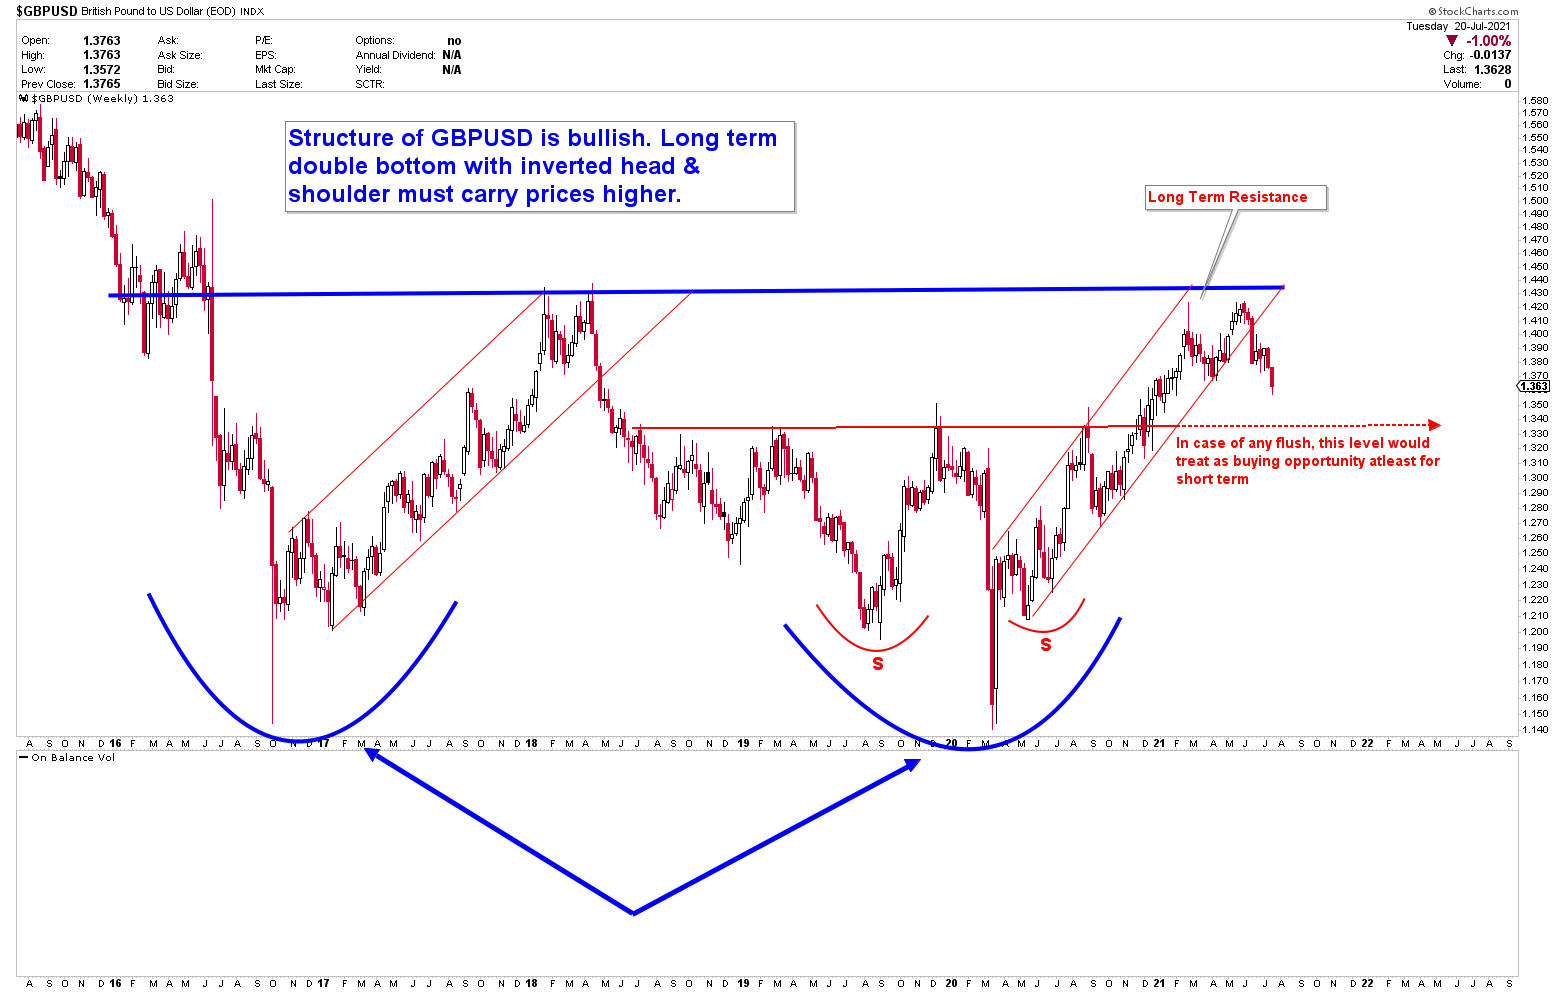
GBPUSD, on the other hand, has broken through the rising channel and is now looking for medium-term support. We’ve been watching the channel for the past three months. Prices have been staying within it for a long time. The long term chart of GBPUSD clearly shows a breakout from the upward channel.
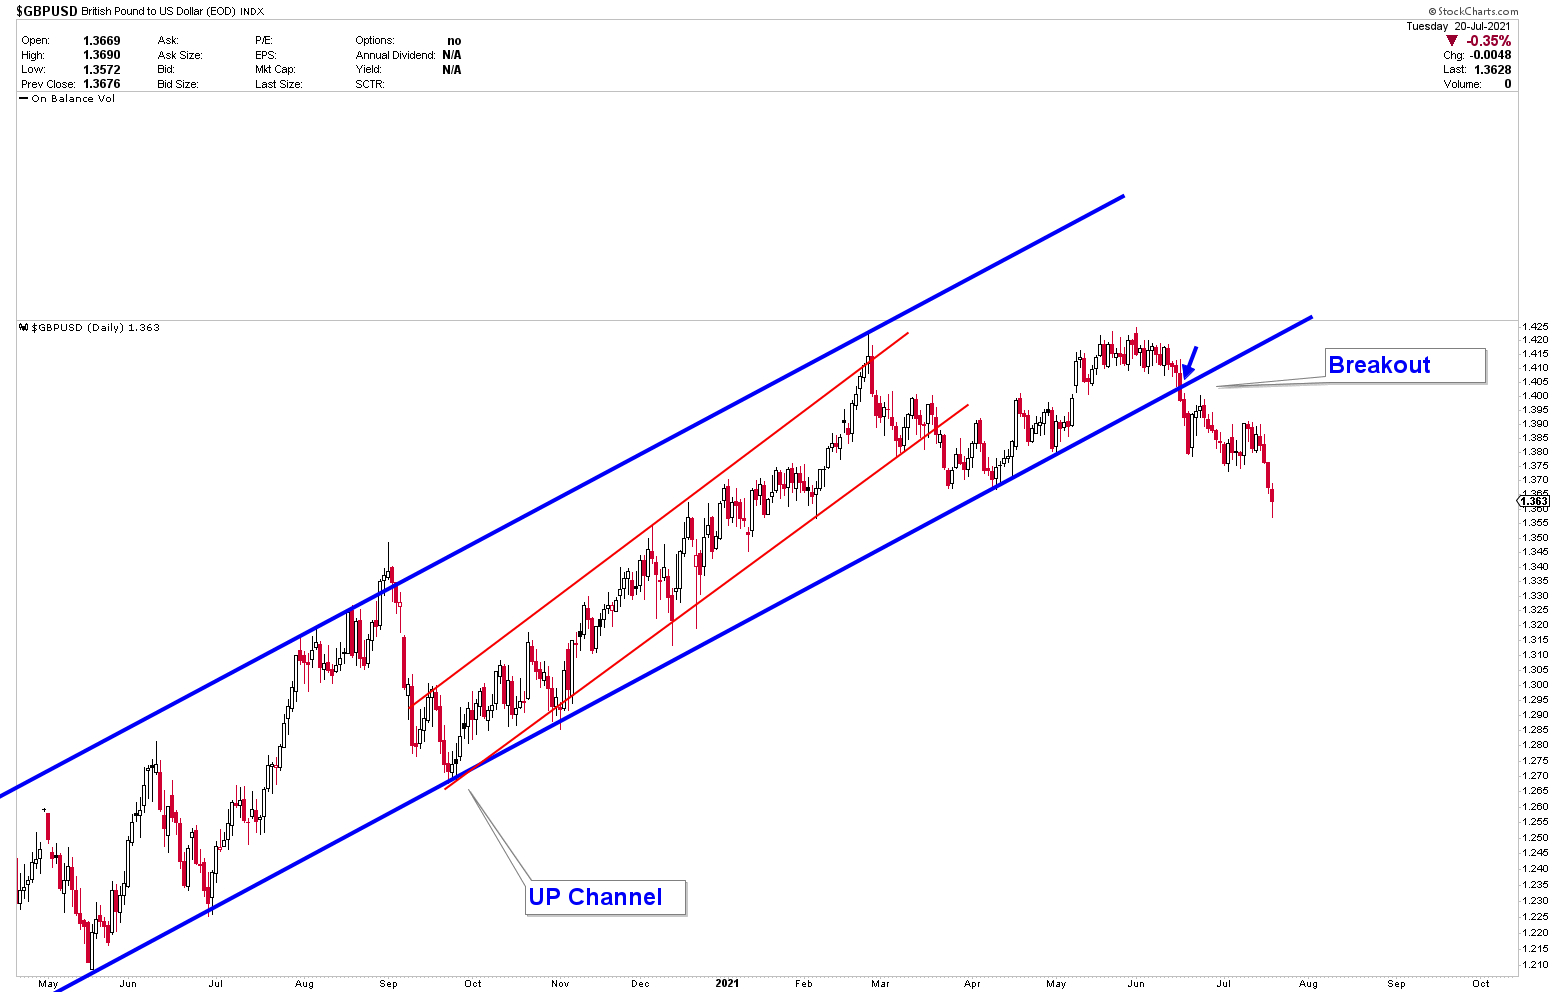
The weekly chart of the GBPUSD shows that long-term resistance has been reached. Prices are falling in search of support near the breakout point. This chart was shown to you four months ago. We predicted that the GBPUSD would touch the neckline of the pattern and fall out.
