The Dollar Shift
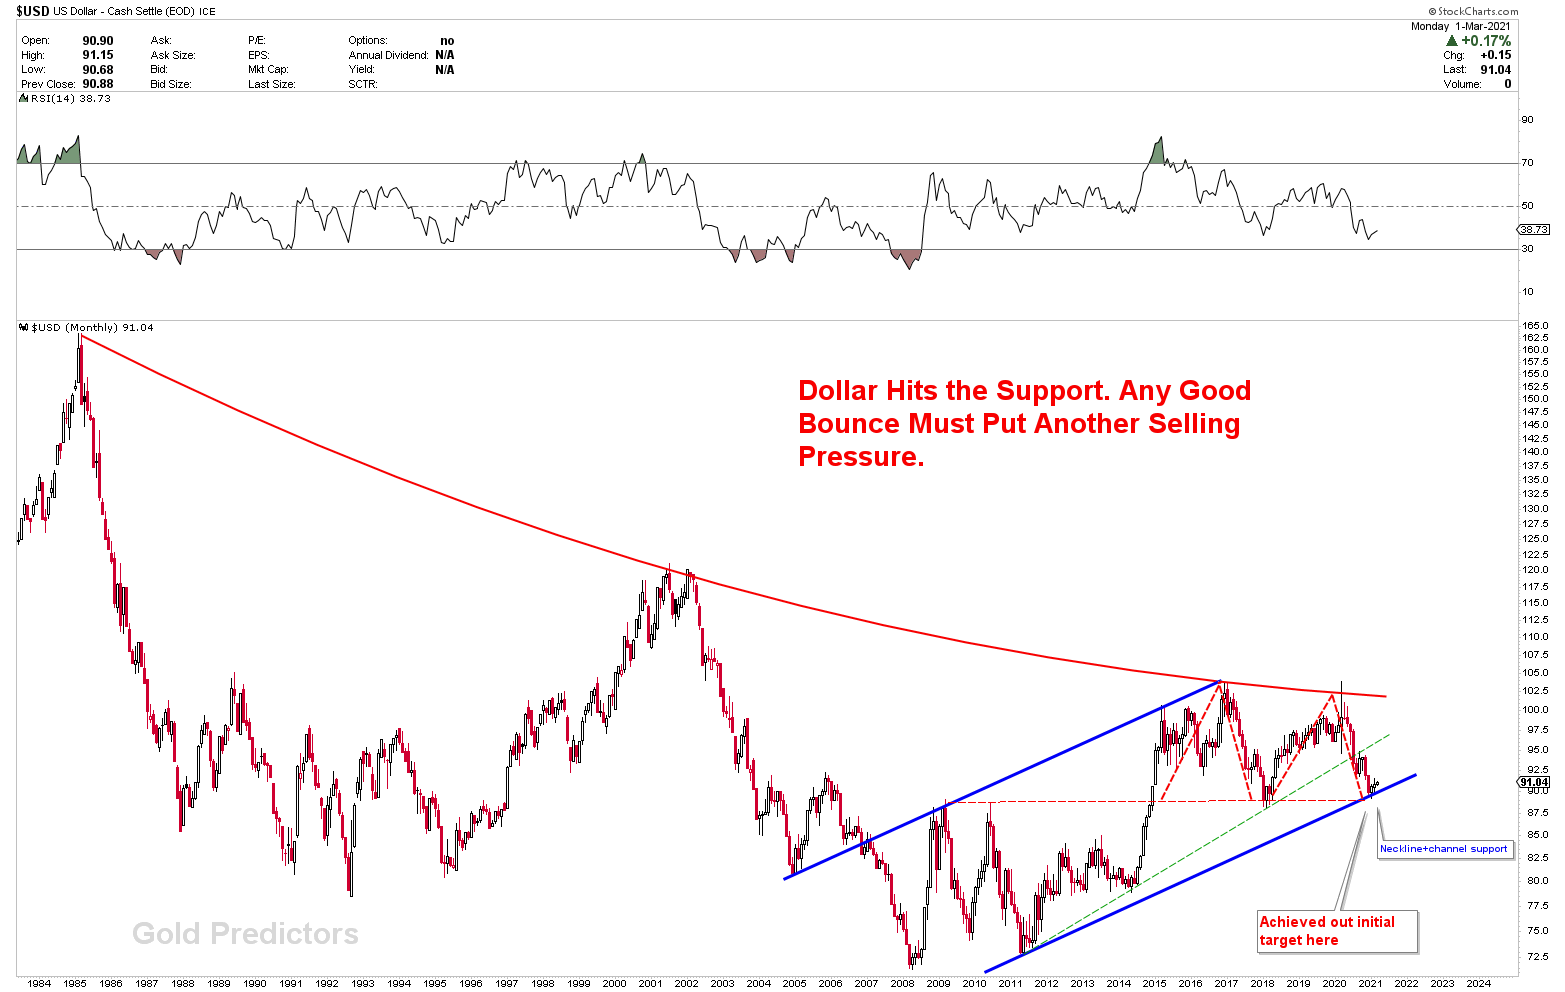
Last week, the dollar announced a notable reversal and bounced off long-term channel support. While long-term trends remain in place, but this region may produce a short term dollar shift.
Highlights
- The US is accountable for about 14% of GDP between December’s package and the one that will be approved in March. The UK may extend its support next week, announcing up to an additional 5% in fiscal assistance, for small and medium-sized businesses wrecked by the pendamic.
- Many investors perceived comments made by Federal Reserve officials last week, particularly the leadership, as evidence of inflation.
- The economy would weaken as monetary support for recovery/expansion was removed. The US 10-year yield has risen 44 basis points in the last month, while the UK yield has risen 53 basis points. An increase of 80 basis points has occurred in Australia. German and French yields both increased by nearly 30 basis points.
- We were bullish on the AUD and EUR, with the AUDUSD climbing hundreds of pips higher, but big economies turned around last week. Our predictions for all majors have come true with 100% results. Markets are now seeing some major areas, so let’s look at how to interpret them.
Weakest currency: CHF, NZD
Strongest Currency: USD, GBP
Best Instruments to Focus:
LONG GBPAUD
Long GBPNZD
Let’s start with the monthly chart of the dollar index, which reveals that the currency is trading at significant levels, where a bounce is expected from these levels. There is one possibility that USD could hit 95-96 levels on extremes. USD is unable to breakdown for weeks from this level because If these levels on technical charts are broken, the dollar will be in serious trouble, as we have mentioned before. However this is just a short term bounce and dollar can start to come under pressure any time.
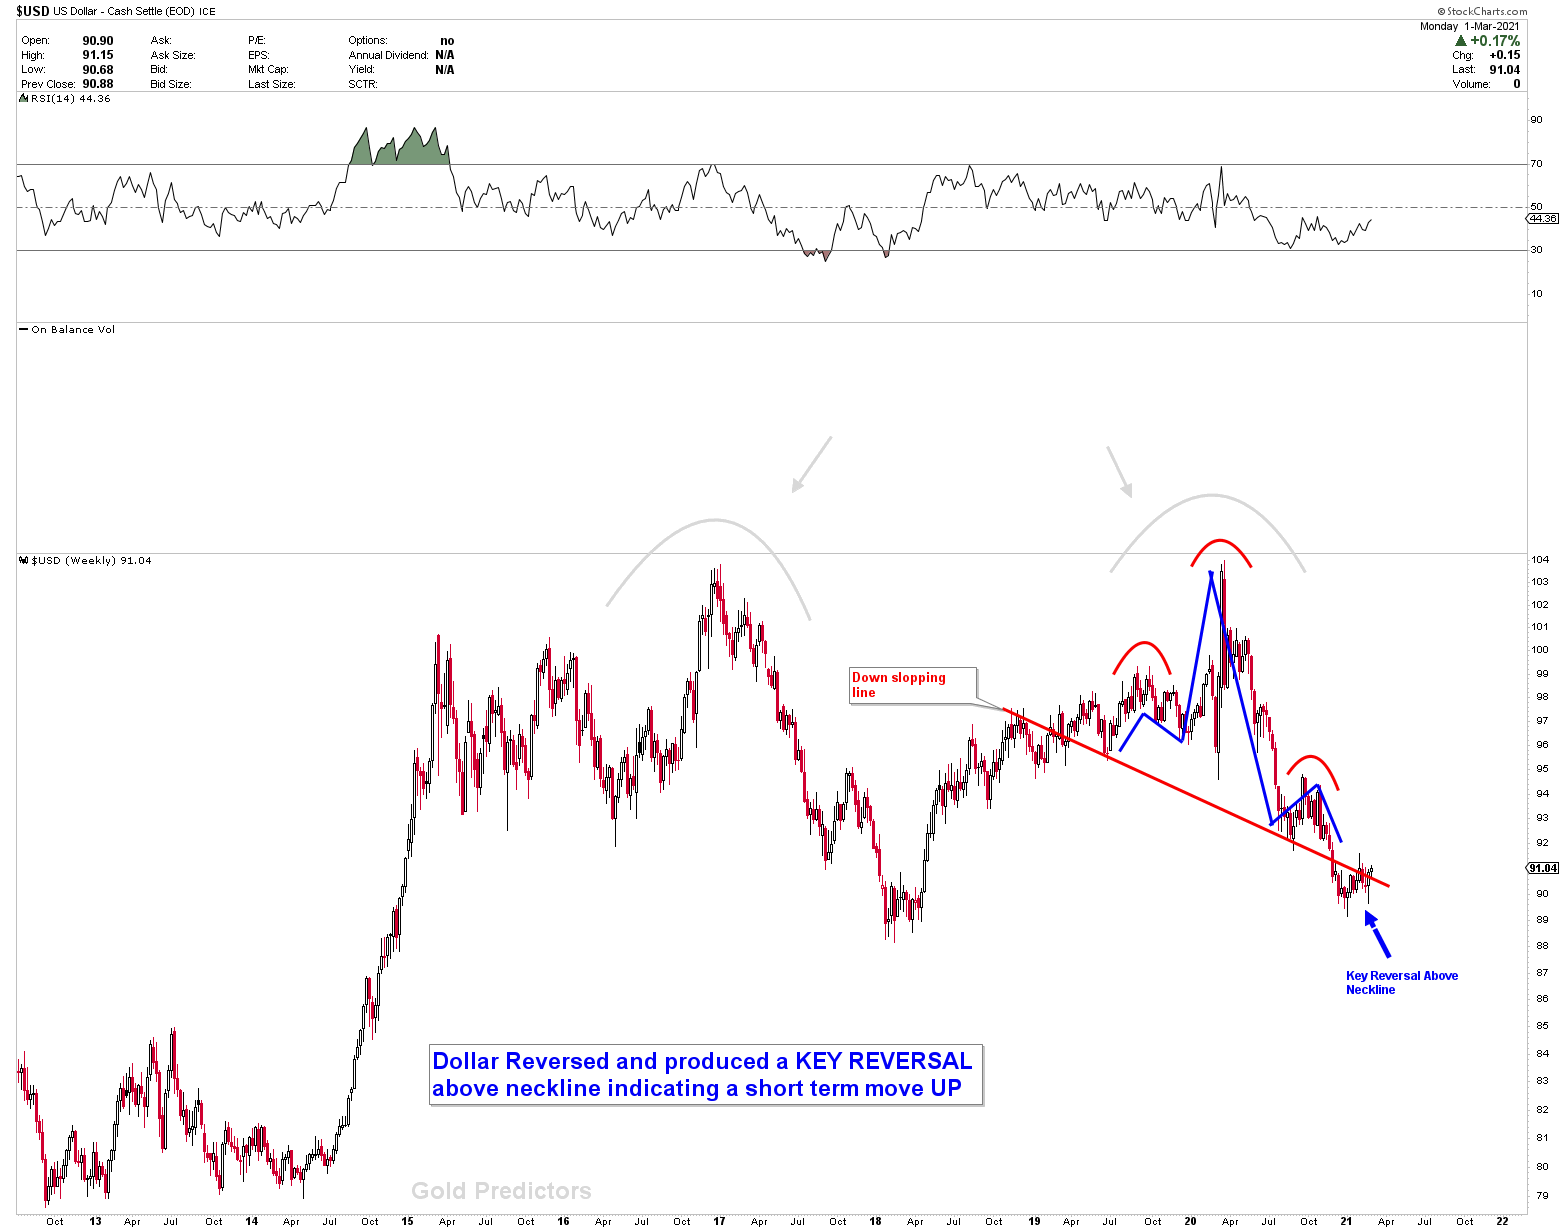
The weekly USD chart below shows that the dollar reversed last week, implying a short-term bounce this week. As the US dollar grows, the EURUSD and AUDUSD will pullback with it. Last week, the EURUSD have also seen a weekly key reversal indicating a drop in that particular instrument.
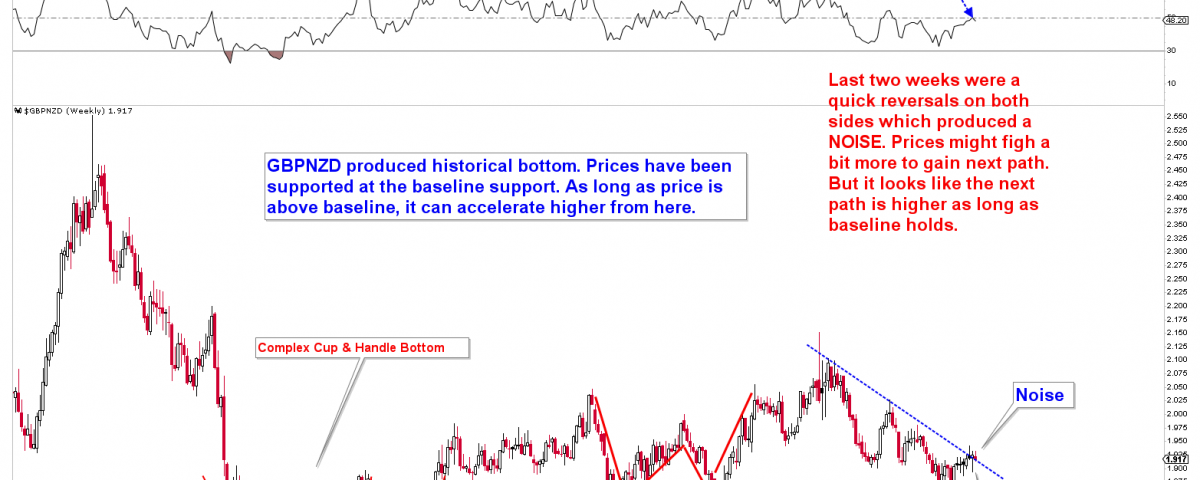
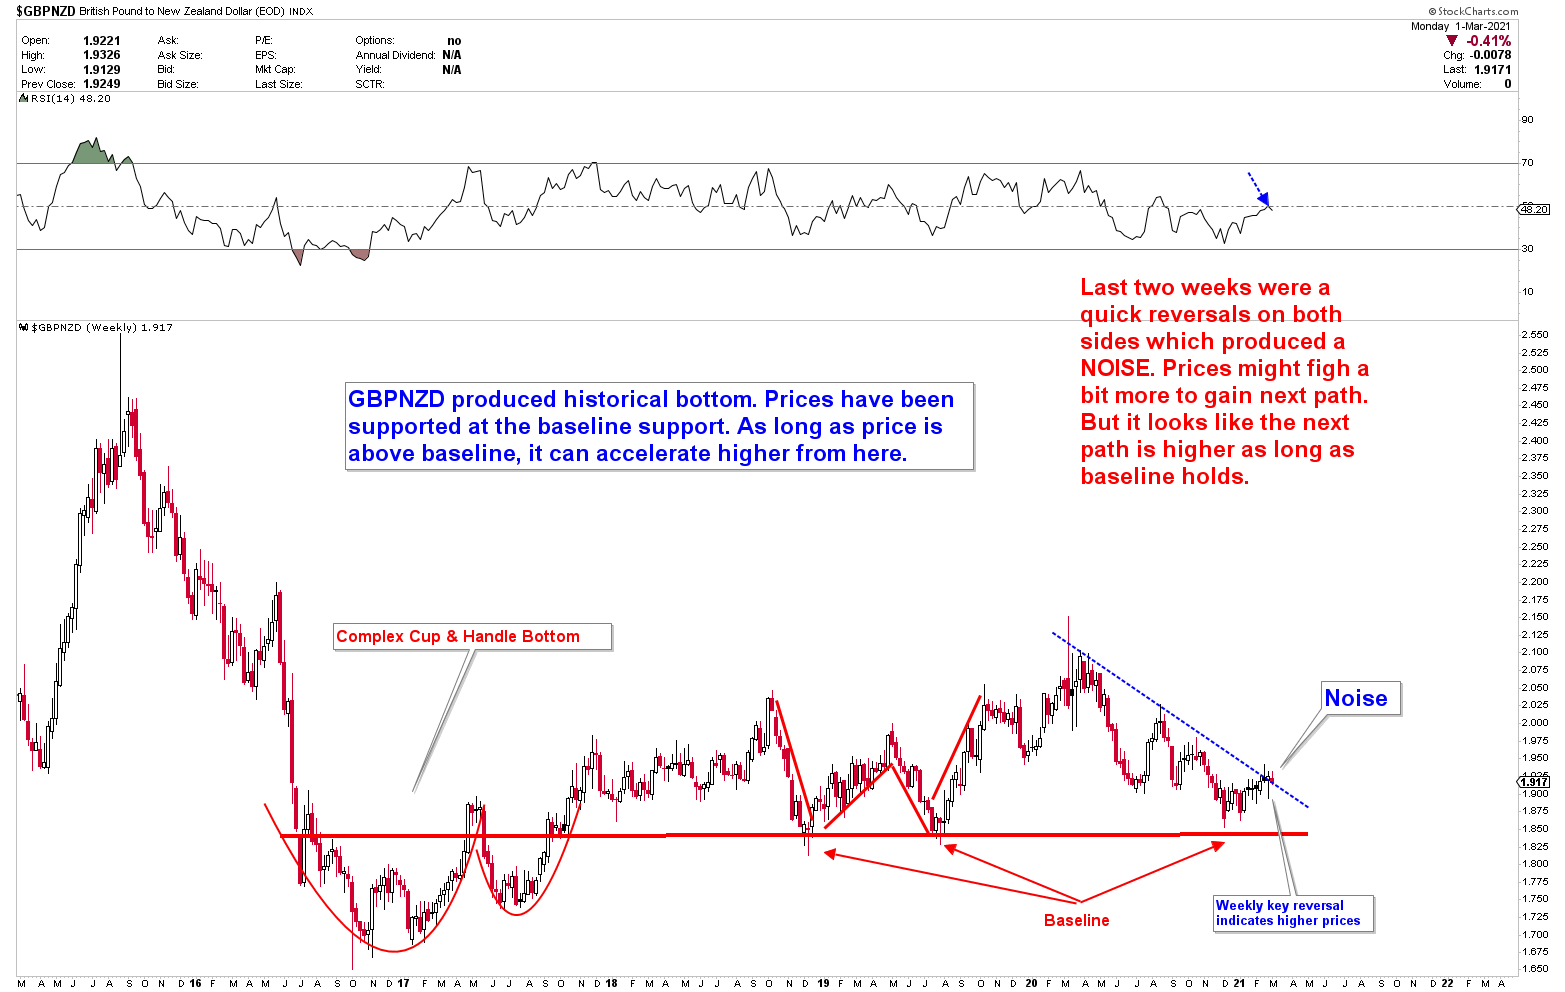
Last week, we discussed the GBP/NZD chart. With the W bottom above the baseline support, the historical COMPLEX CUP & HANDLE bottom was super bullish. As long as the baseline support holds, it appears that this instrument’s next trajectory would be higher. Last week marked a significant reversal, indicating that prices are likely to rise faster in the near future. Short-term trading would be risky, according to NOISE, which was produced from the last 2 weeks candles. Short term traders, be careful but as long as base line support hold this instrument is going higher.
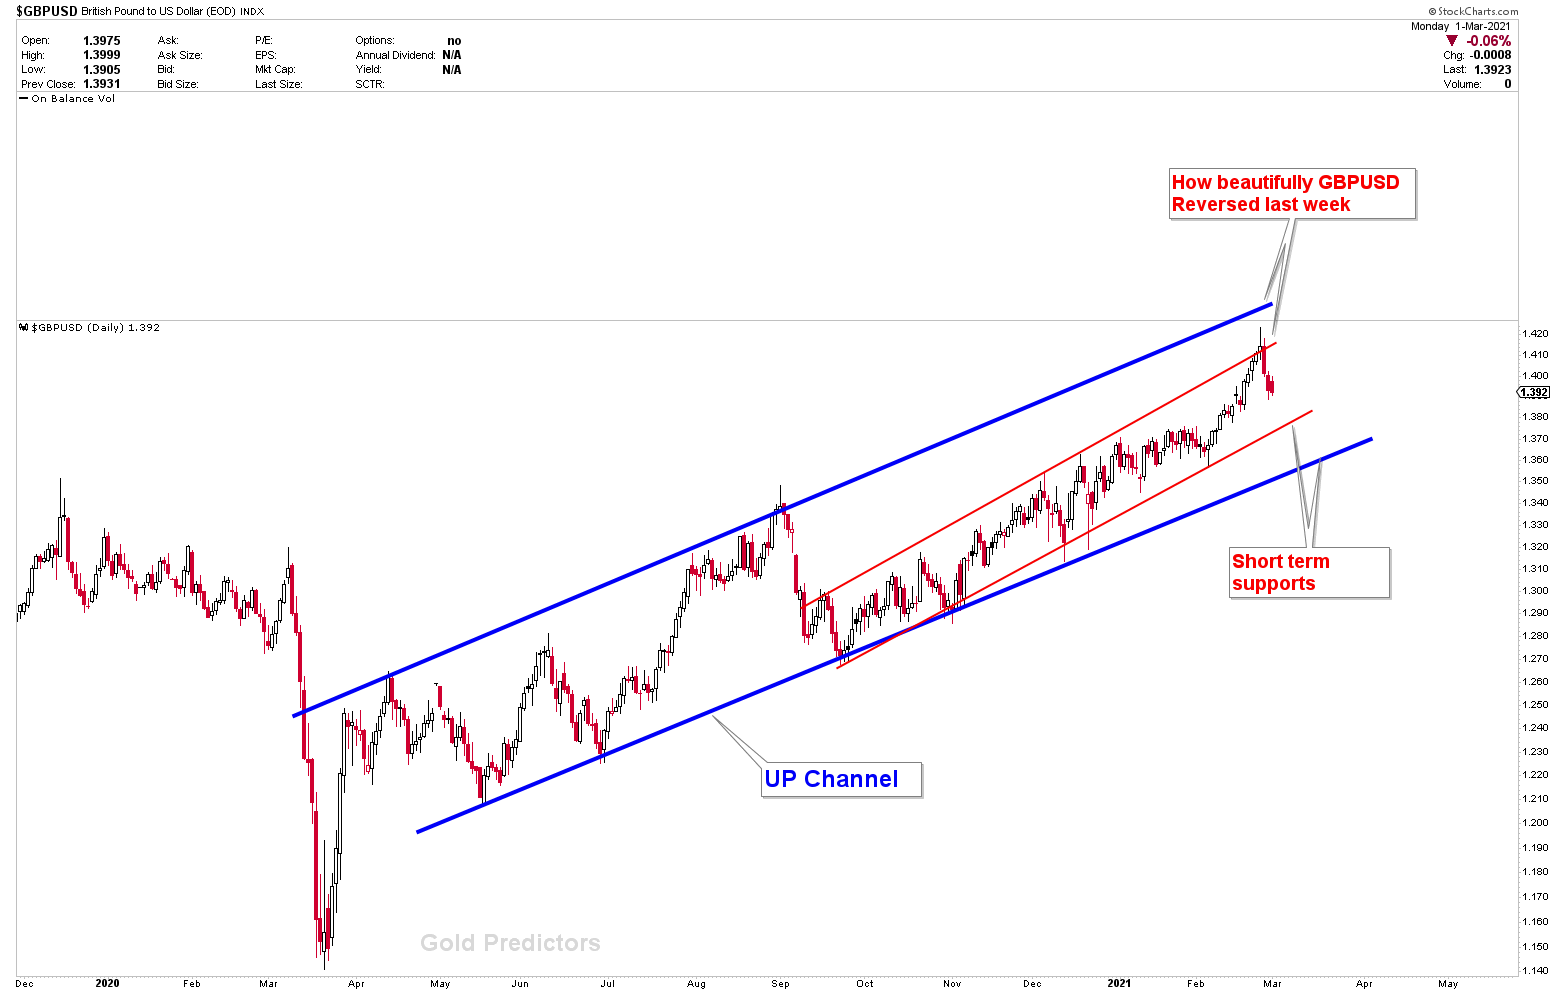
Last week, the GBPUSD hit a major resistance and was hammered, despite the fact that the GBP is hoping very strong. The weekly key reversal near the blue long term resistance line indicates a short-term pause in the GBPUSD cruise, but the GBP remains strong, the pullback was developed because of dollar strength. Because the US dollar is bouncing off a long-term support channel, GBPUSD looks risky to execute trades, in that case, other GBP pairs, such as GBPNZD, are better bets for this week.
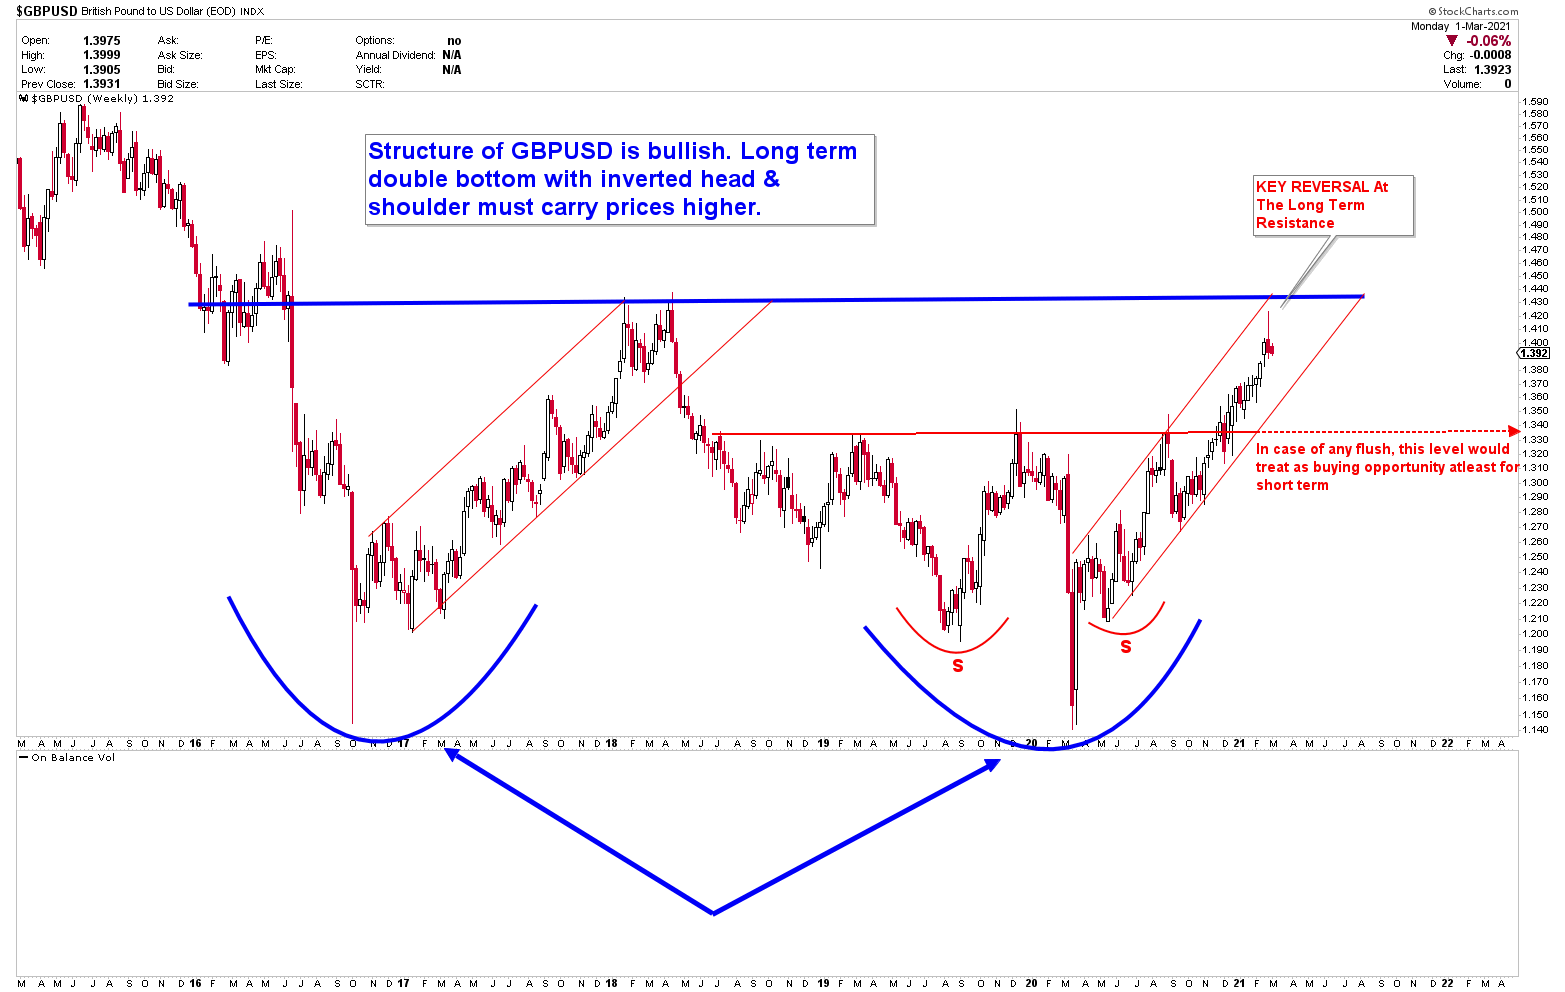
When you zoom out on the GBPUSD chart, you can see how well the resistance was held, and the red channel serves as initial support at 1.3750-90, with 1.33-1.35 representing as a strong base support.
The USDJPY is trying to achieve its next goal by taking advantage of JPY weakness and USD strength. This instrument is simply oscillating between the long-term broadening triangle and a breakout below or above would indicate the next direction. This pair must break down according to the rules. We would see a drop if the instrument dropped below 99.

We focus on the market price to see where they want to go. The dollar remains strongly bearish, but there was a significant shift last week that should be acknowledged. It’s painful to rule out a strong bounce in dollar from this area. Things could change any time, as we are currently in the middle of a major cyclical period in all markets.
To receive the free trading alerts, signals and articles please subscribe as a Free member to the link below.
Note: The subject highlights the ideas and thoughts of the writer for educational support that can be used to enable the reader to become an independent thinker and decision maker.


