Silver Price Forecast: Multi-Year Channel Breakout Points to Strong Upside
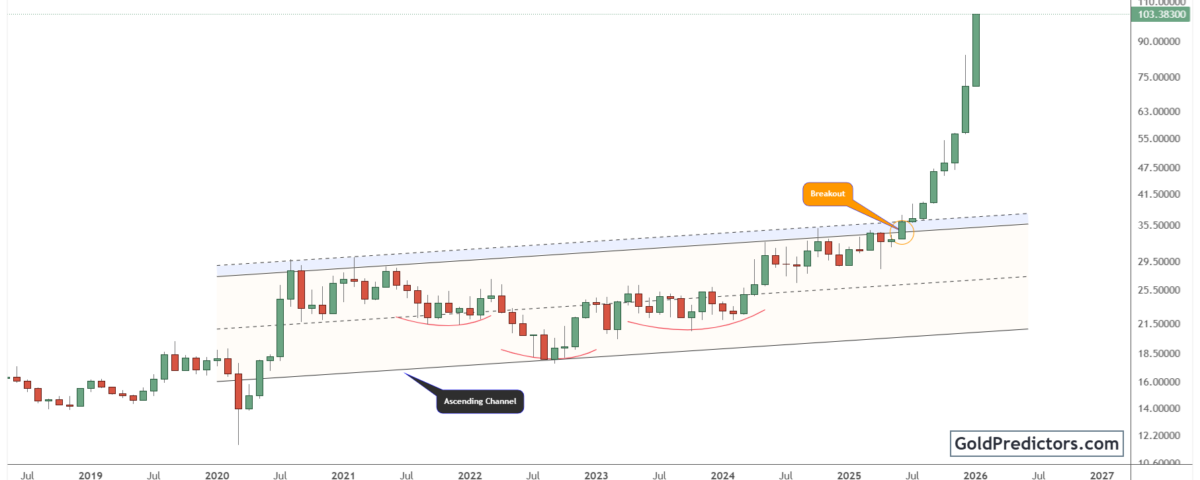
Silver (XAGUSD) has broken out of a multi-year ascending channel with explosive strength. After years of steady gains and accumulation near key support, the metal surged above the channel’s upper boundary. This move confirmed a major technical breakout and signaled the start of a powerful new phase. At the same time, the silver-to-3M ratio is nearing a key resistance level, pointing to renewed relative strength in silver over industrial equities. These developments point to a structural shift in capital flows toward hard assets and suggest strong long-term upside for silver.
Silver Breaks Out of Multi-Year Ascending Channel, Enters Powerful New Bull Phase
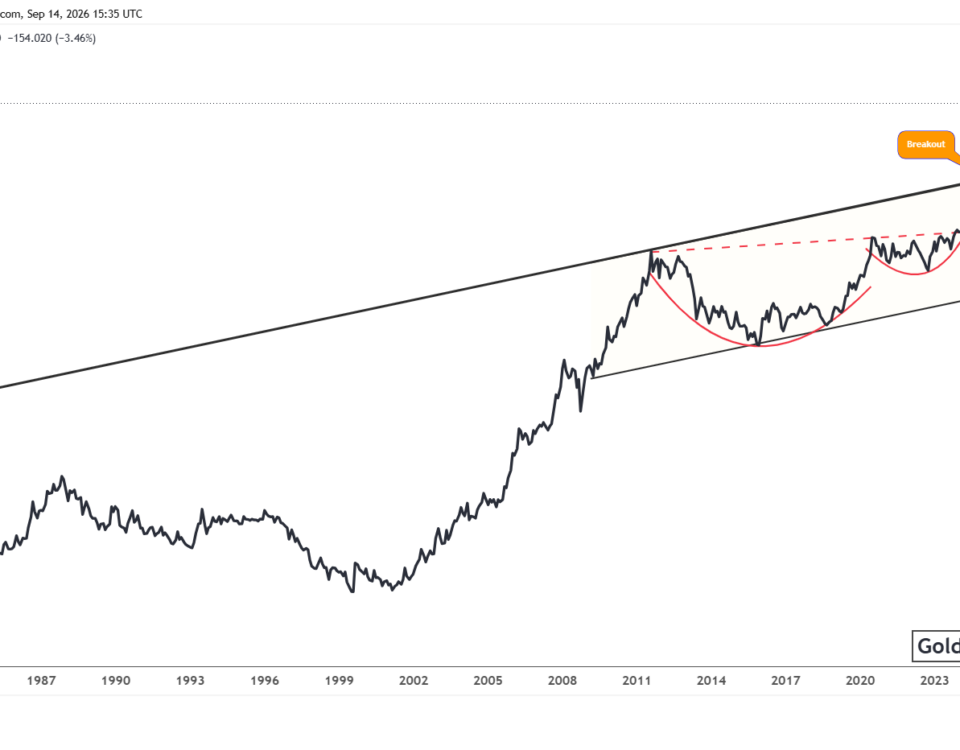
The silver chart below shows a well-defined ascending channel that has guided price action since 2020. Within this structure, silver consistently formed higher highs and higher lows, highlighting a steady upward trend. Price movements developed a series of rounded bottoms near the lower boundary, indicating repeated accumulation. This pattern laid the foundation for a powerful breakout and the start of a sustained bullish phase.
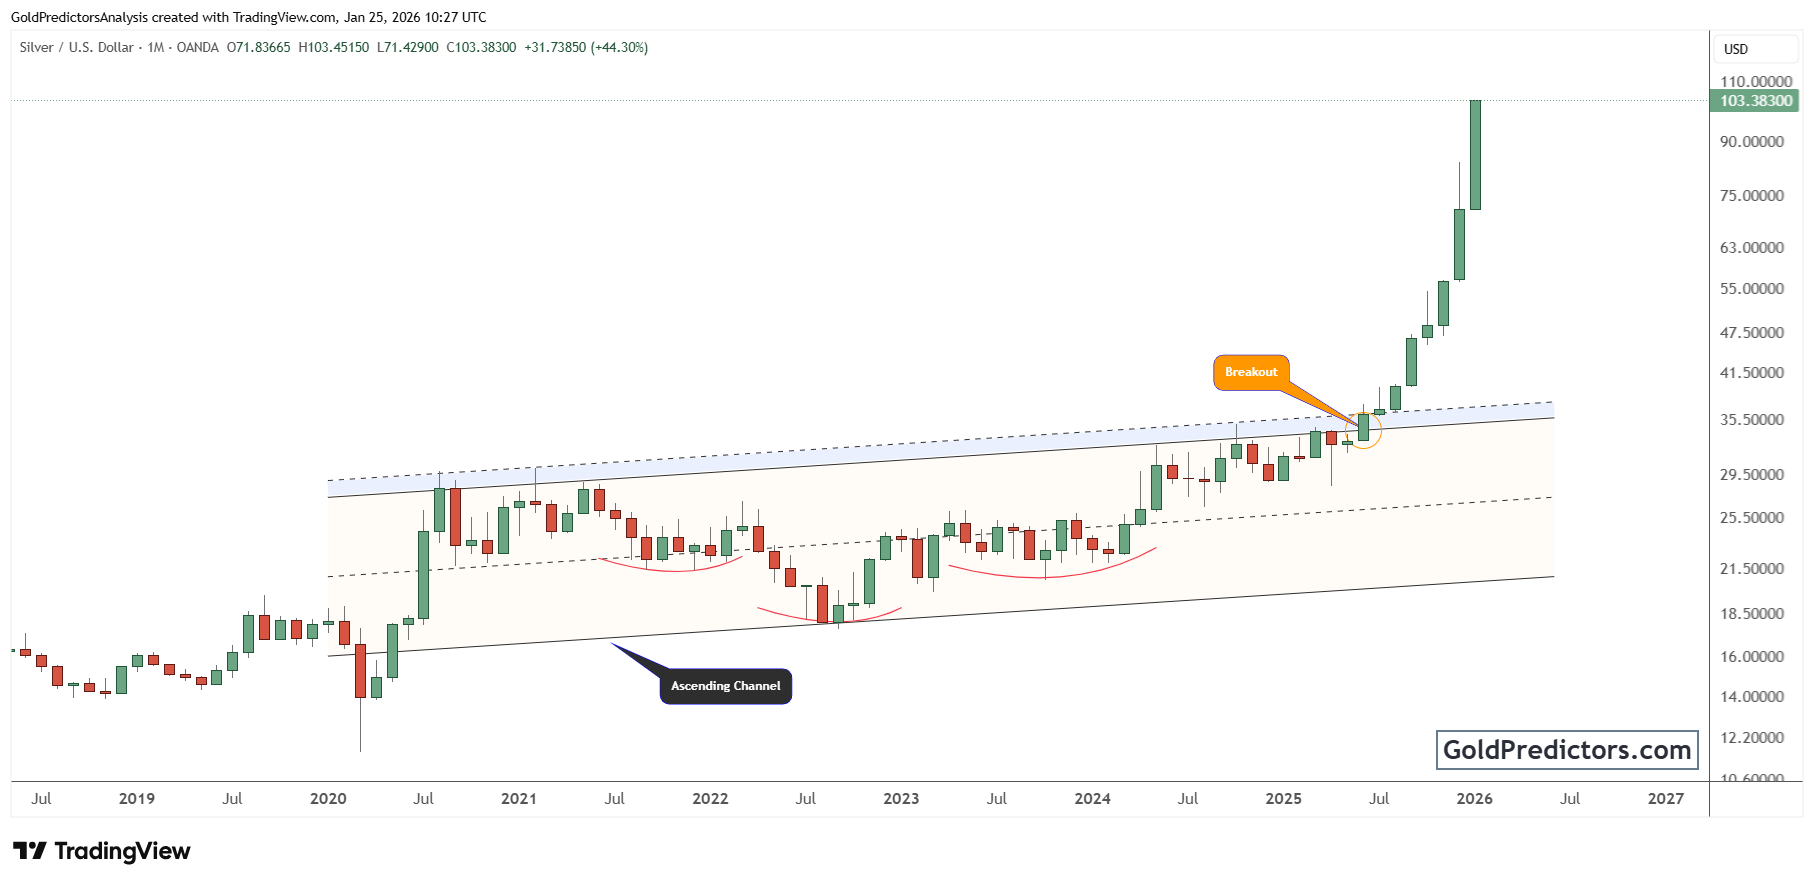
In 2024, silver initiated a strong rally toward the upper boundary of the channel. After multiple tests of resistance, the metal broke decisively above the upper trendline around mid-2025. The breakout unleashed a sharp rally, sending silver from below $30 to above $90 within a few months. Former resistance has now turned into key support, confirming the shift from consolidation to acceleration.
Importantly, the breakout highlights a transition into a more powerful leg of silver’s ongoing bull cycle. The steep ascent and clean move above channel resistance reflect strong underlying demand, likely supported by institutional interest. Momentum and volume indicators would further confirm the breakout’s significance. This shift signals a clear transition from a gradual climb to a structurally powerful advance.
Silver-to-3M Ratio Approaches Key Breakout after Decades of Underperformance
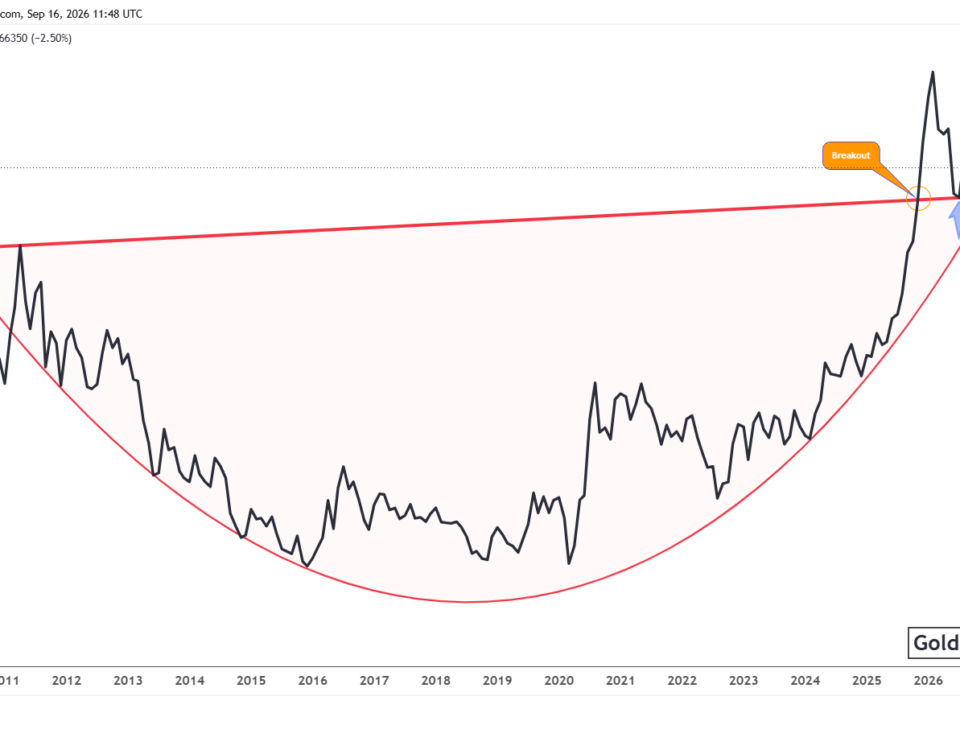
The chart below shows the Silver-to-3M ratio, comparing the performance of silver relative to a major U.S. industrial equity. It reveals a massive cup formation that began after the 1980 peak. Following that peak, the ratio declined for several decades, bottoming out in the early 2000s. Since then, silver has gradually regained strength, carving out a rounded base with several failed attempts to break above the 0.67 level. These repeated rejections have shaped the upper boundary of a classic multi-decade cup pattern.
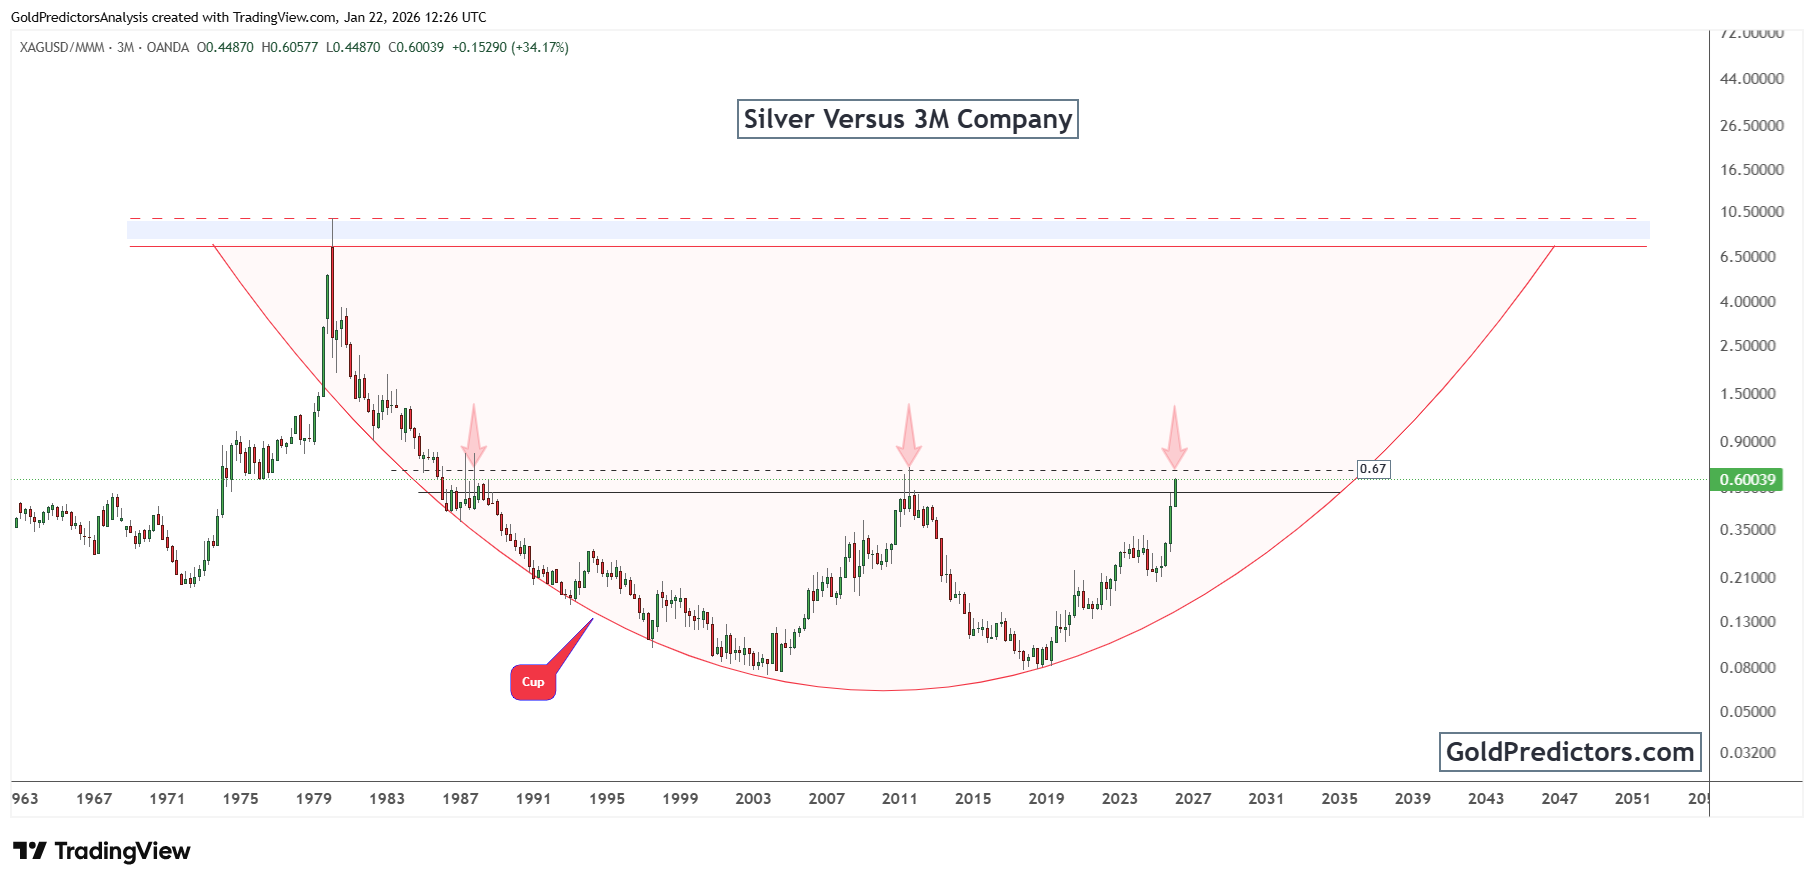
As of January 2026, the ratio is approaching this resistance again, with the latest surge showing strong upward momentum. The extended base and repeated resistance tests indicate mounting pressure for a breakout. A decisive close above the 0.67 level would complete the cup formation and confirm a long-term structural reversal. This breakout would signal a significant shift in capital flows, moving away from industrial equities and favoring monetary metals like silver.
Currently, the technical setup in the ratio reflects a major inflection point following decades of accumulation and resistance tests. This breakout setup stands out due to its long-term structure. After decades of relative underperformance, silver is now showing renewed strength against major industrial equities. A confirmed breakout in this ratio could unlock significant upside potential for silver and other hard assets.
Conclusion: Technical Breakout and Ratio Setup Point to Sustained Silver Upside
Silver’s breakout from its ascending channel marks the beginning of a powerful upward phase. This breakout signals the transition from accumulation to acceleration, driven by strong underlying demand. The rapid move above key resistance levels reflects a shift in sentiment and strong participation from broader market segments.
At the same time, the silver-to-3M ratio is approaching the top of a multi-decade cup pattern. This indicates not only absolute strength in silver but also growing relative outperformance versus industrial equities. A decisive breakout above 0.67 would confirm a generational shift toward hard assets, highlighting silver’s role as a core asset in the evolving macro environment.
These developments reflect rising demand for hard assets, with silver reclaiming leadership across the commodity space. Both price action and the silver-to-3M ratio highlight growing institutional interest alongside a macro backdrop that favors continued upside. As silver extends its outperformance, the technical and structural setup continues to support long-term gains.
Gold Predictors Premium Membership
Get exclusive short-term and swing trade ideas with precise entry levels, stop-loss, and target prices, including justification and analysis — all delivered directly via WhatsApp.
Our premium service includes deep technical analysis on gold and silver markets. We cover cycle analysis, price forecasting, and key timing levels.
Members also receive a weekly market letter with detailed analysis, commentary from our Chief Analyst, including actionable insights, trade timing, and direction forecasts for gold and silver.
Stay ahead of the market — join our premium community today.