

Silver Price Analysis: XAG/USD Holds Long-Term Support as Stocks vs Silver Ratio Rebounds
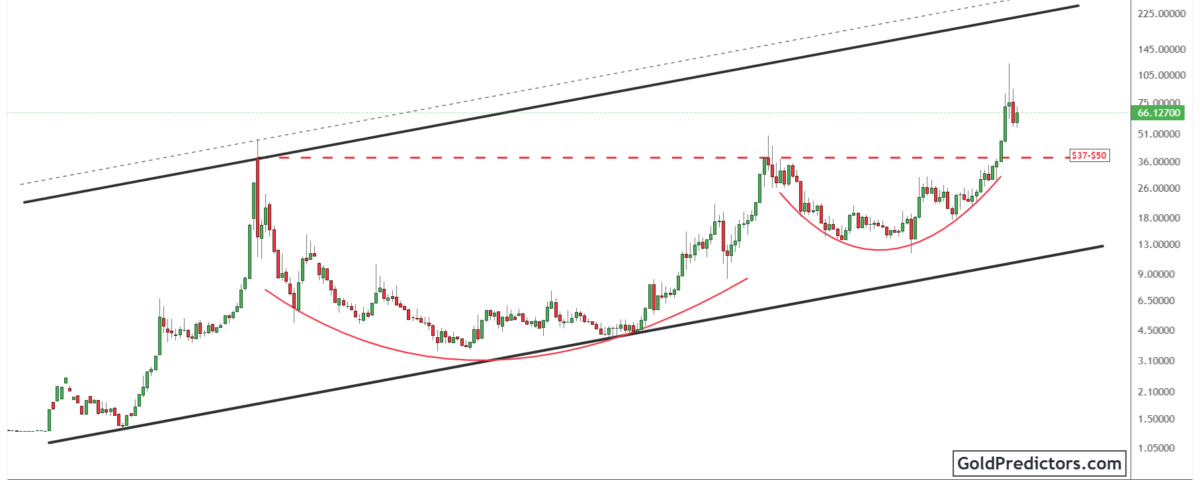
Silver (XAG/USD)remains well above its historic long-term breakout zone despite the recent correction. Price continues to hold above former multi-decade resistance, preserving the broader technical structure. At the same time, the Stocks versus Silver ratio has rebounded from its long-term rising trendline, highlighting continued relative strength in equities compared with silver. These developments continue to support the long-term technical outlook, with silver holding above key support and equities maintaining relative strength over silver.
Silver Technical Analysis: XAG/USD Holds above Historic Breakout Support
The silver chart below shows a broad ascending channel that has guided price action for several decades. The lower trendline has repeatedly provided support during major corrections, while the upper trendline has acted as long-term resistance. Silver reached the upper resistance trendline during the major rally in 1980 before entering a prolonged correction. The latest advance has pushed price sharply higher, but it has turned lower before reaching the long-term resistance trendline.
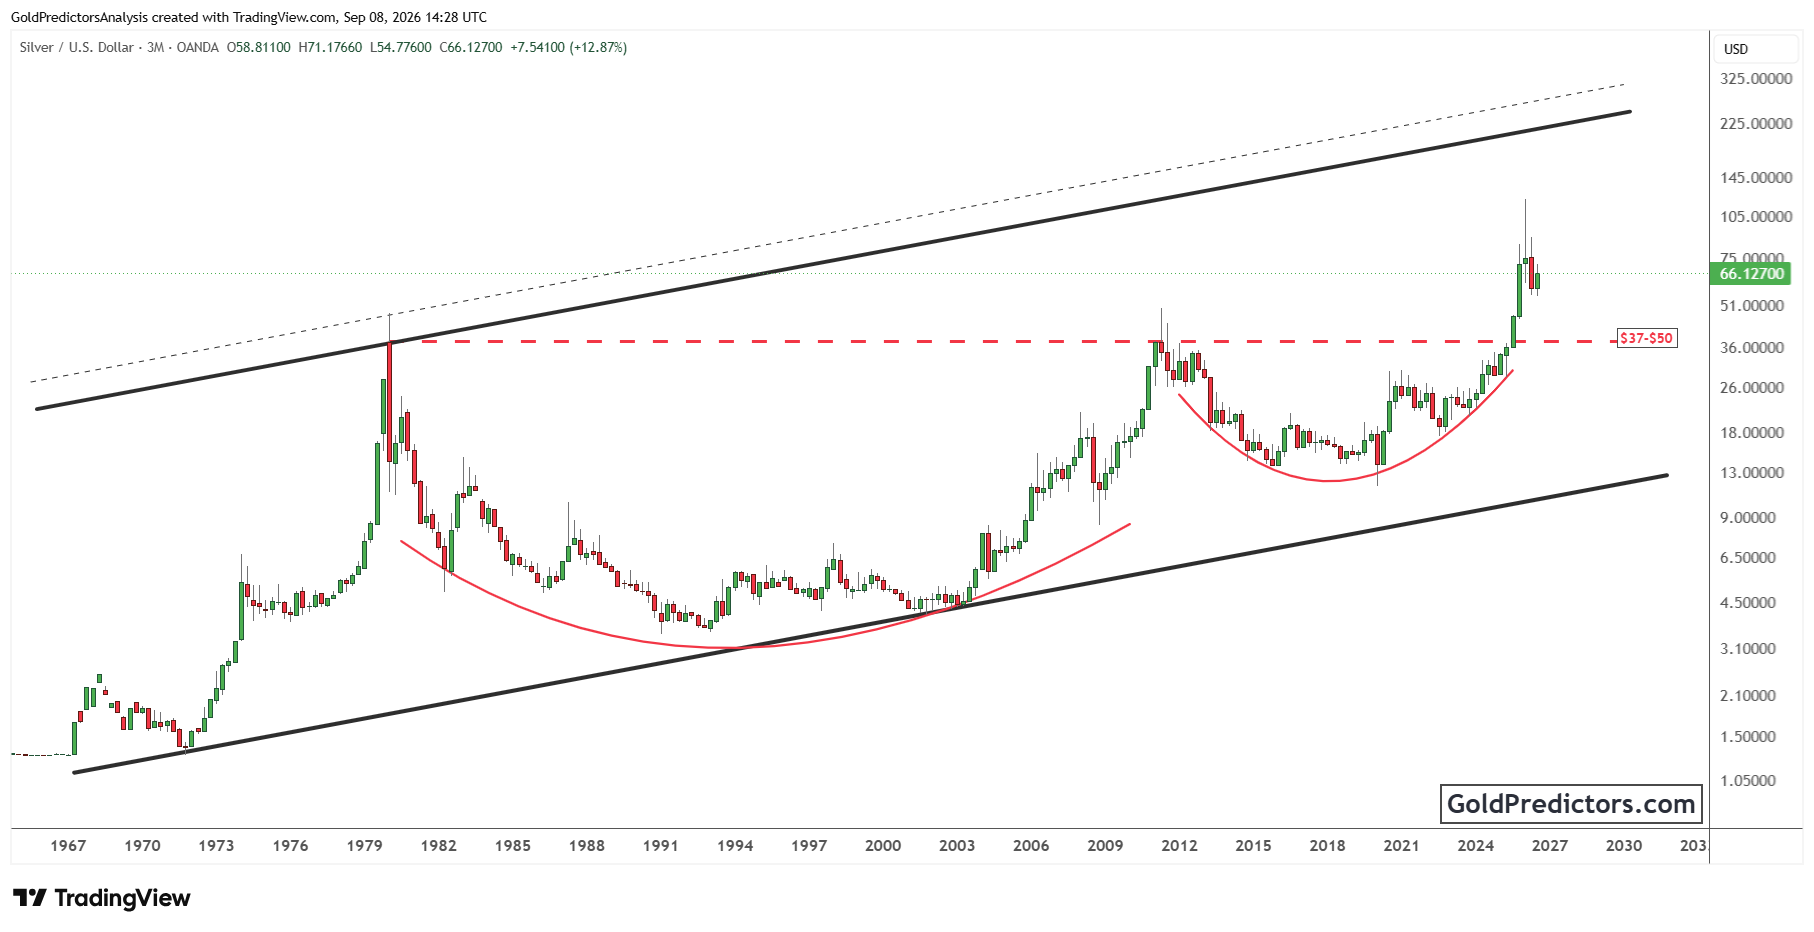
The recent correction has not changed the broader technical picture. Silver remains well above the former multi-decade resistance zone, which capped every major rally for decades. The breakout above this long-term barrier marked a significant shift in the market structure. Although price has pulled back from its recent highs, the former resistance zone continues to serve as an important long-term support area.
The current pullback appears to be a normal consolidation following the historic breakout. Silver has since shown a slight rebound while remaining well above the key support region. This price action keeps the long-term technical structure intact. As long as silver remains above this support, the outlook continues to favor further strength.
Stocks vs Silver Ratio Rebounds From Long-Term Support
The chart below shows the Stocks versus Silver ratio holding above a long-term rising trendline that has provided support for several decades. This trendline has remained important during major declines in the ratio. Previous tests have been followed by strong recoveries. The latest decline has once again found support at the rising trendline before the ratio turned higher.
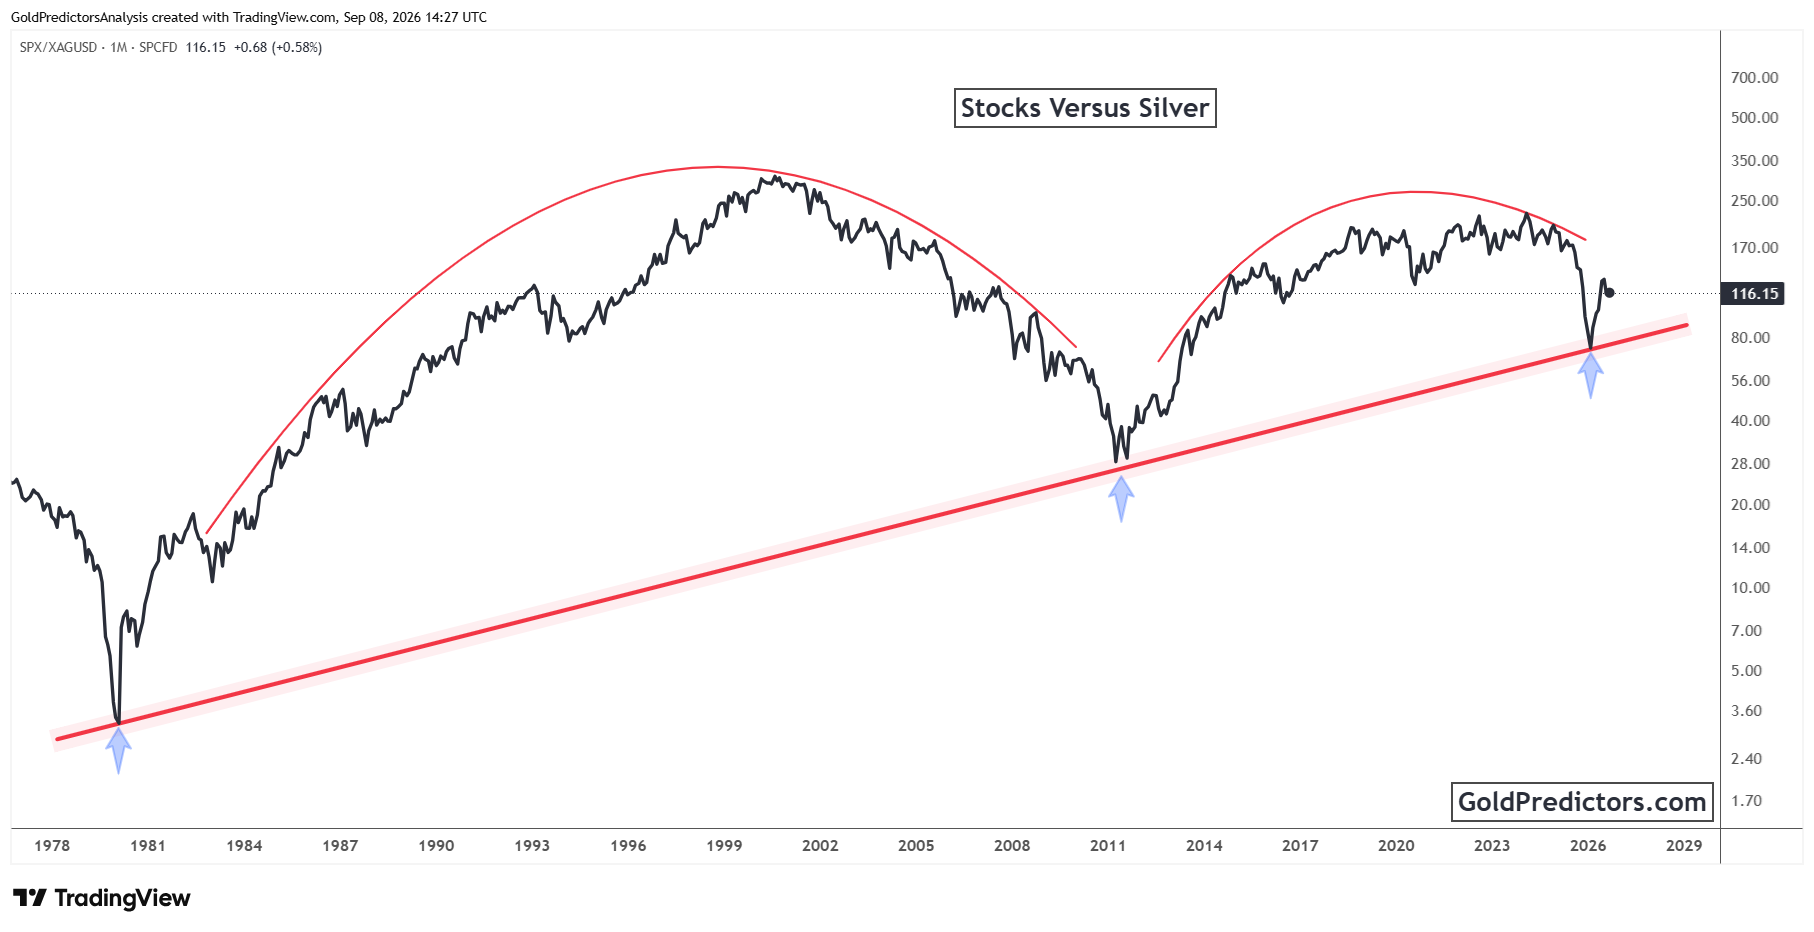
The repeated reactions from the rising trendline highlight its importance as a key technical support. Previous tests have been followed by strong recoveries, helping maintain the overall structure of the ratio. The latest recovery has developed in a similar way, keeping the rising trendline in focus as an important support.
As long as the ratio holds above the rising trendline, the overall technical structure continues to indicate stronger performance from stocks relative to silver. Holding above this support would remain consistent with the historical pattern that has developed over several decades. Although shorter-term fluctuations may continue, the long-term structure continues to support the relative strength of equities compared with silver.
Silver Price Outlook: Long-Term Breakout Holds as Stocks Outperform Silver
Silver continues to hold above its historic breakout level despite the recent decline. Price remains well above the former multi-decade resistance zone, which now serves as an important support area. Holding above this region would keep the larger breakout structure intact and maintain the positive technical outlook.
At the same time, the Stocks versus Silver ratio has once again rebounded from its long-term rising trendline. This reaction follows a historical pattern that has developed repeatedly over several decades. Holding above this support continues to favor equities outperforming silver over the longer term.
These developments provide an important framework for both markets. Silver remains above its historic breakout zone, preserving its long-term technical structure. However, the recovery in the Stocks versus Silver ratio indicates that equities continue to hold the relative advantage over silver.
Gold Predictors Premium Membership
Get exclusive short-term and swing trade ideas with precise entry levels, stop-loss, and target prices, including justification and analysis — all delivered directly via WhatsApp.
Our premium service includes deep technical analysis on gold and silver markets. We cover cycle analysis, price forecasting, and key timing levels.
Members also receive a weekly market letter with detailed analysis, commentary from our Chief Analyst, including actionable insights, trade timing, and direction forecasts for gold and silver.
Stay ahead of the market — join our premium community today.