Gold Price Forecast: XAU/USD Holds Long Term Breakout as Nasdaq-to-Gold Ratio Stays Below Resistance
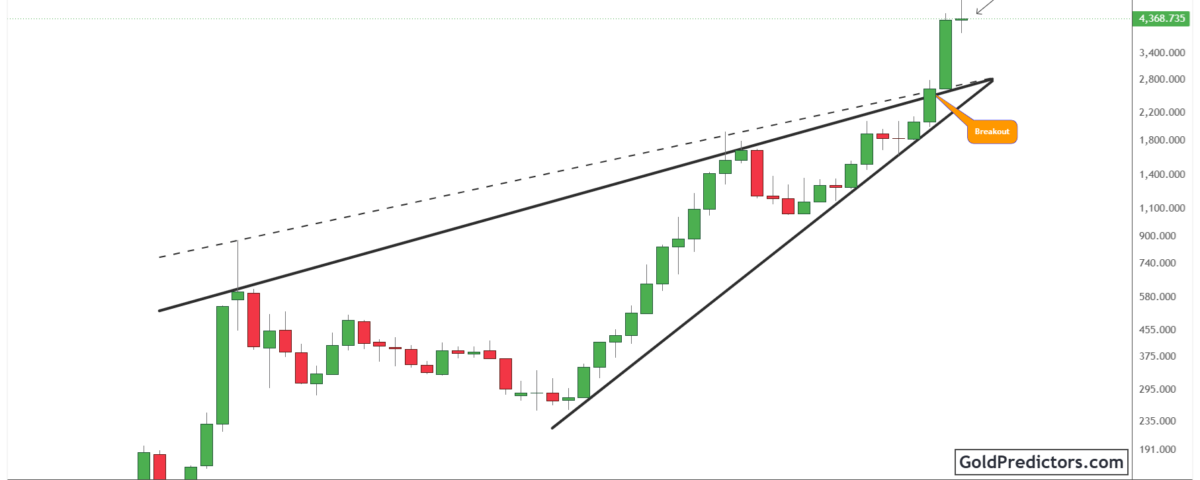
Gold (XAU/USD) continues to hold a strong technical position after completing a major breakout from a multi-decade price structure. The metal remains well above the former resistance line, which marks an important shift in its long-term price structure. At the same time, the Nasdaq-to-Gold ratio continues to trade below its major resistance trendline. The recent decline in the ratio shows stronger performance from gold relative to the Nasdaq 100. These developments keep attention on gold’s technical structure and its performance relative to the Nasdaq 100.
Gold Price Analysis: XAU/USD Holds above Former Triangle Resistance
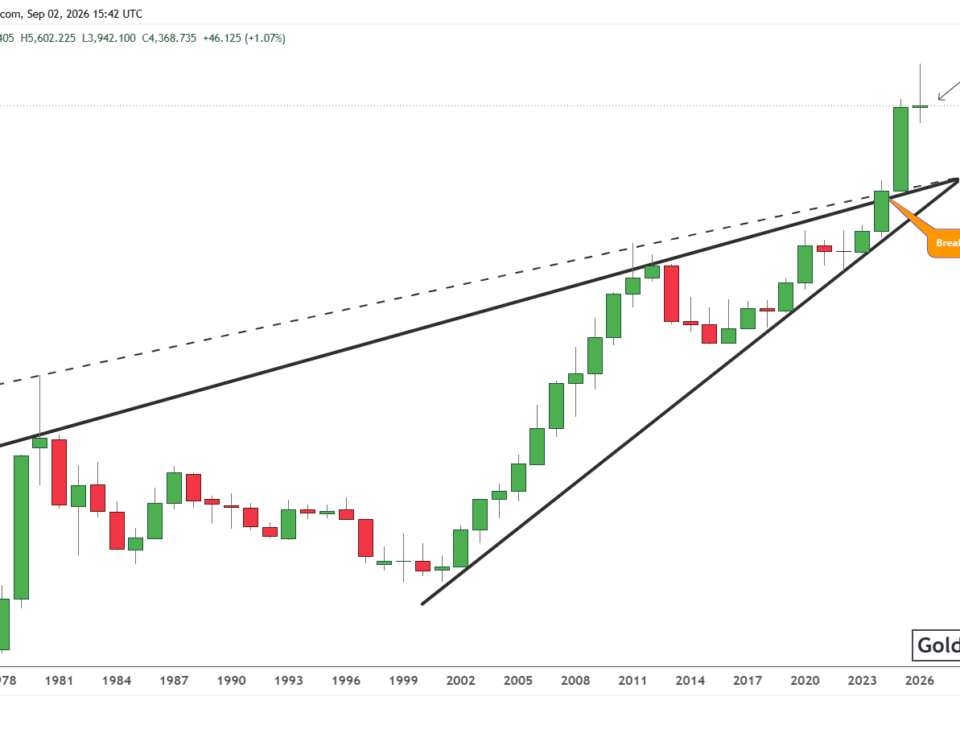
The gold chart below shows a large triangle pattern that shaped price action for several decades. Two rising trendlines gradually converged and formed the structure. The upper trendline acted as major resistance, while the lower trendline provided structural support. Price eventually broke above the upper trendline and confirmed a major technical breakout.
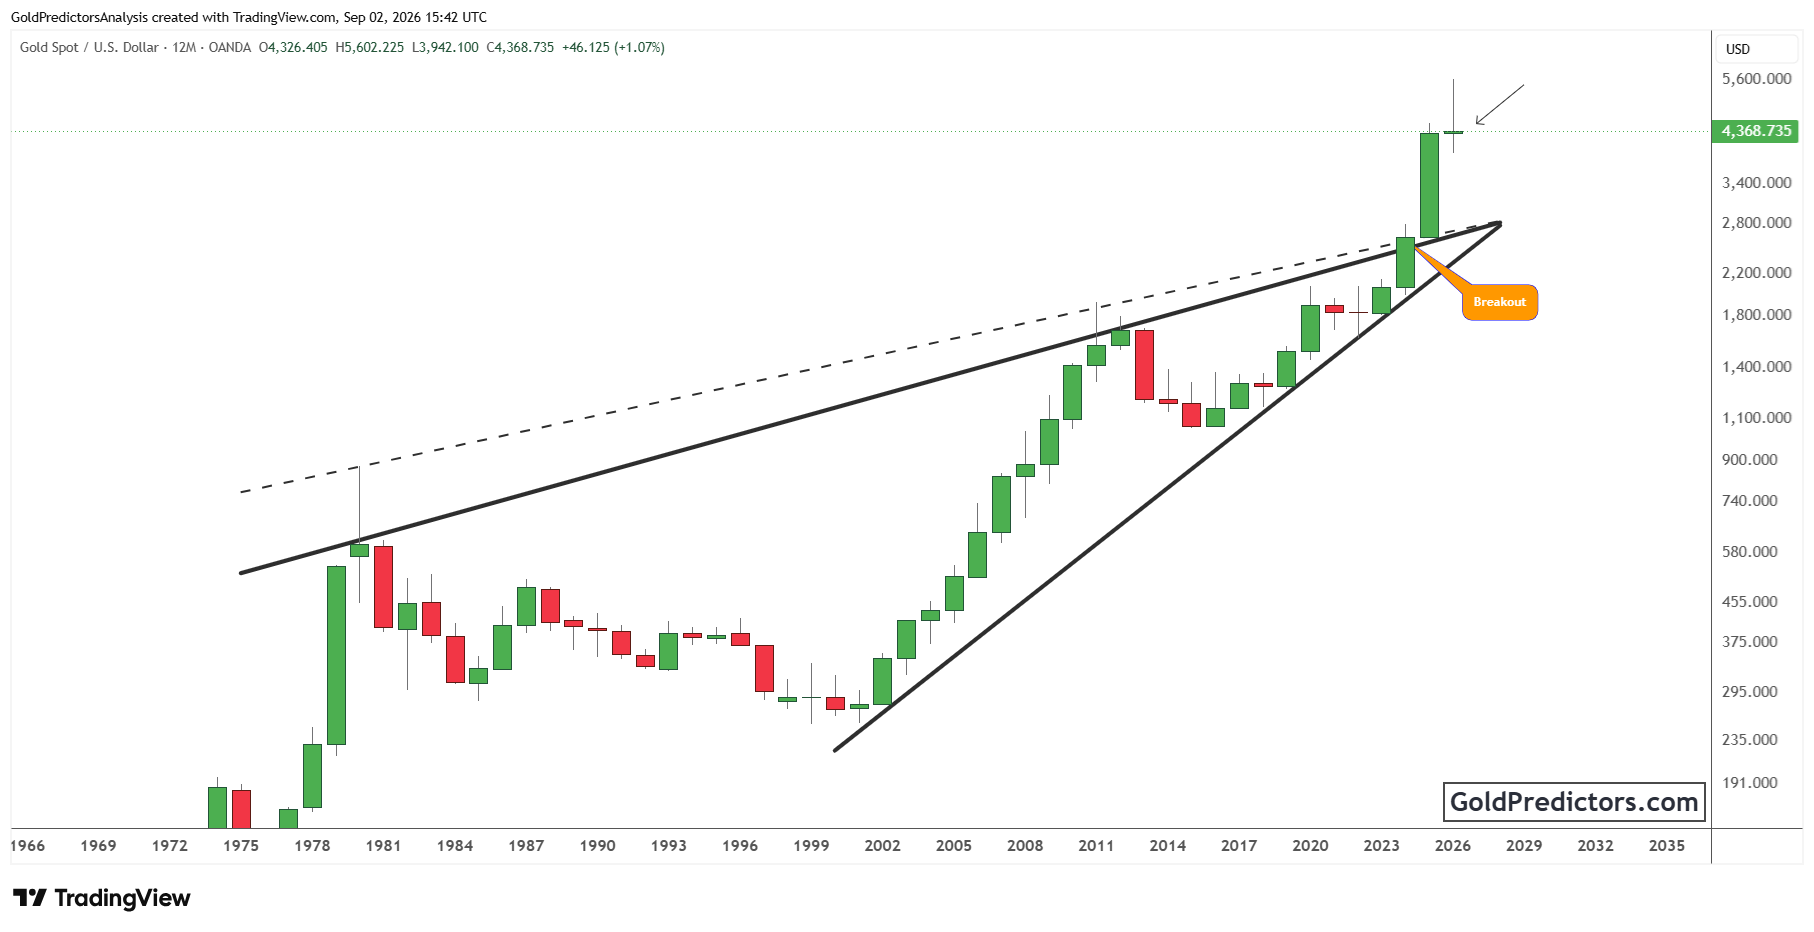
Gold accelerated strongly after clearing the triangle resistance. The breakout pushed price well above the former resistance line and into a much higher range before a pullback began. This strong advance shows a clear change in the pace of the market. Price continued to extend its gains after the breakout and maintained strong upward momentum. This sustained strength highlighted the importance of the breakout and confirmed a clear shift in the overall price structure.
The latest candle reflects a pullback following the strong advance. Gold reached around $5,600 before declining toward $4,300. Price remains well above the major breakout zone despite this decline. This keeps the larger technical structure intact. Further weakness could extend the pullback, while the former triangle resistance remains an important support for the larger structure.
Nasdaq to Gold Ratio Remains Below Long Term Triangle Resistance
The chart below shows the Nasdaq versus Gold ratio trading within a large multi-decade triangle pattern. A descending trendline has acted as major resistance, while a rising trendline has provided support from below. These two trendlines have gradually converged and narrowed the trading range over time. The ratio continues to trade between these two important trendlines.
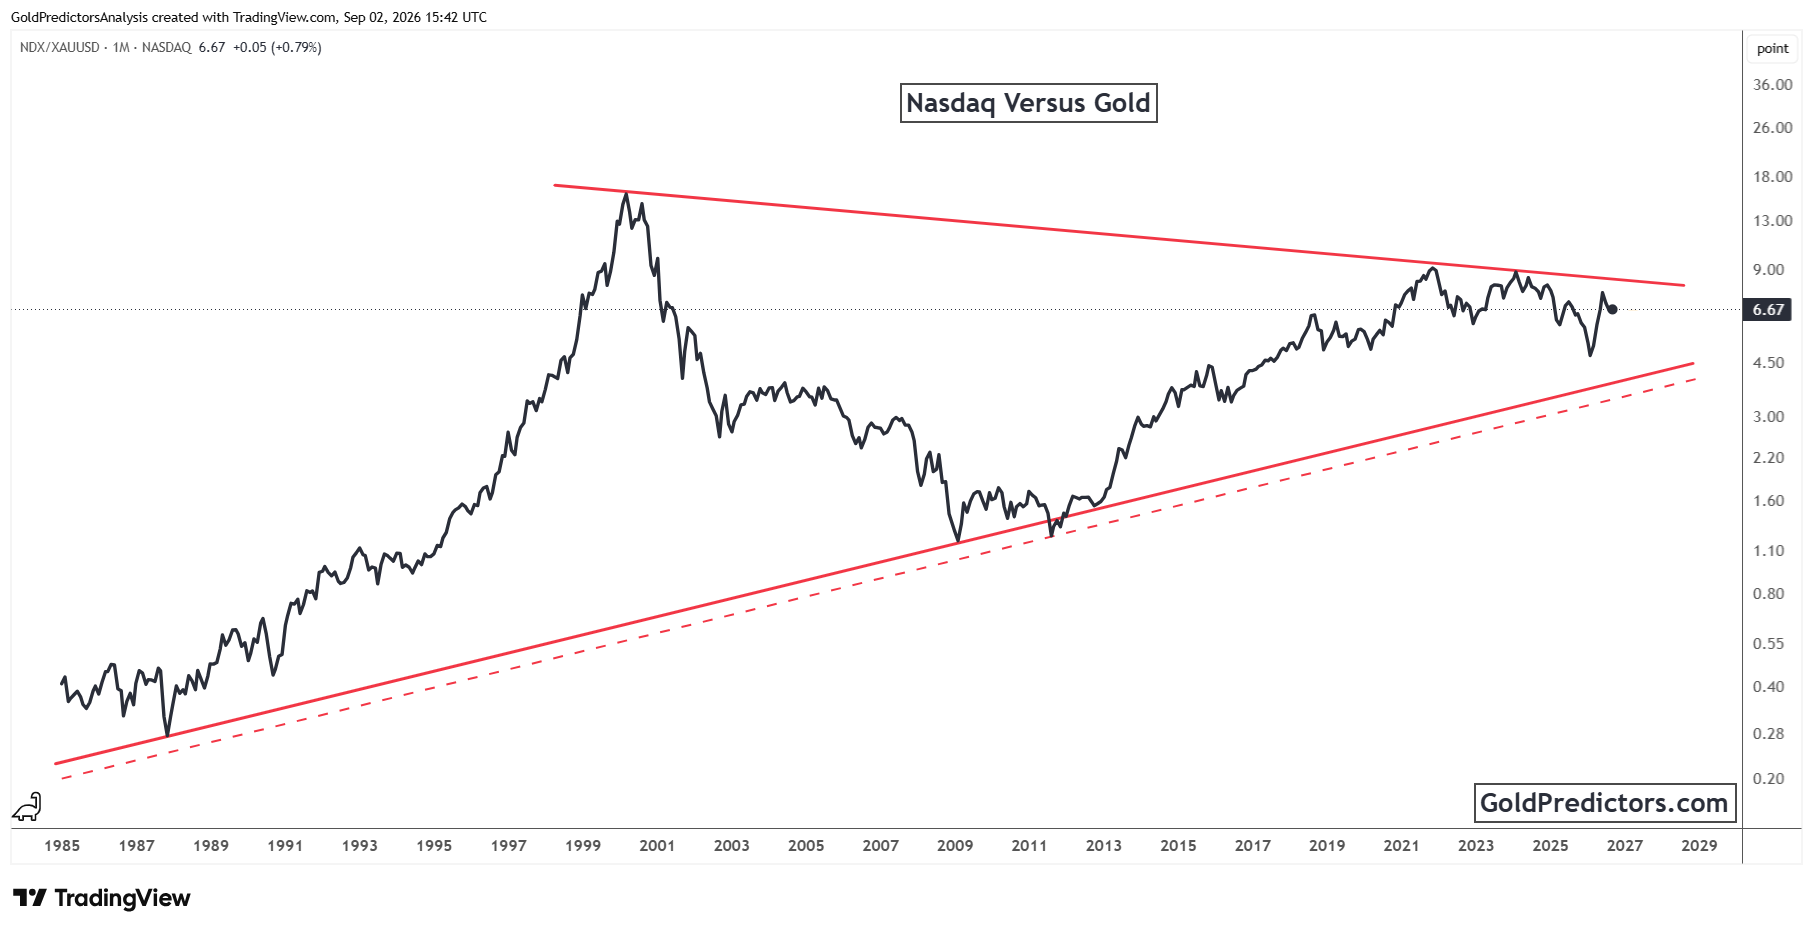
In 2012, the ratio started to turn higher from the rising support and began a sustained advance toward the descending resistance trendline. This advance showed that the Nasdaq was outperforming gold as the ratio moved higher. The ratio failed to break above the resistance trendline and later pulled back, indicating a period of stronger performance from gold relative to the Nasdaq. Recent price action continues to fluctuate below resistance while remaining well above the rising support line. This keeps the larger triangle structure intact.
The descending resistance trendline is now the most important technical area to monitor. A sustained break above this level could signal further strength in the Nasdaq relative to gold. However, continued rejection from resistance could keep the ratio inside the triangle and increase the possibility of another decline toward rising support.
Gold Price Outlook: Long Term Breakout Holds as Nasdaq-to-Gold Ratio Faces Resistance
Gold continues to hold a strong technical position despite the recent pullback. The major triangle breakout remains intact, and price stays well above the former resistance line. This keeps the larger structure supportive. Further weakness could extend the pullback, but the former triangle resistance remains an important support area.
At the same time, the Nasdaq-to-Gold ratio continues to face resistance within its triangle. The ratio remains below its long-term resistance trendline after failing to break higher. Its recent decline shows that gold has strengthened relative to the Nasdaq. However, the ratio continues to trade inside the large triangle pattern, with rising support still well below current levels.
These developments highlight the important technical areas that could influence gold’s next direction. Gold needs to remain above the former triangle resistance to keep the larger structure intact. Meanwhile, further weakness in the Nasdaq-to-gold ratio could indicate continued gold outperformance relative to the Nasdaq. However, a break above ratio resistance could shift relative strength back toward the Nasdaq.
Gold Predictors Premium Membership
Get exclusive short-term and swing trade ideas with precise entry levels, stop-loss, and target prices, including justification and analysis — all delivered directly via WhatsApp.
Our premium service includes deep technical analysis on gold and silver markets. We cover cycle analysis, price forecasting, and key timing levels.
Members also receive a weekly market letter with detailed analysis, commentary from our Chief Analyst, including actionable insights, trade timing, and direction forecasts for gold and silver.
Stay ahead of the market — join our premium community today.
Latest Post
Gold Price Forecast: XAU/USD Holds Long Term Breakout as Nasdaq-to-Gold Ratio Stays Below Resistance
Silver vs Copper: Can Silver Regain Strength against Copper?
Silver Price Forecast: XAG/USD Attempts Recovery as Silver-to-Platinum Ratio Holds Key Support
Gold Price Forecast: XAU/USD Holds Ascending Wedge Support as Gold Outperforms Palladium
Gold Price Forecast: XAU/USD Holds Key Support as Dow-to-Gold Ratio Remains Weak
Gold Price Analysis: XAU/USD Maintains Historic Breakout While Junior Gold Miners Show Relative Strength
Related posts