


Silver Price Forecast: Historic $50 Resistance Test Could Unleash Bull Market Rally
Silver (XAGUSD) approaches a key breakout zone following decades of structured price movement in an ascending channel. The metal is once again nearing the critical $50 resistance level that capped previous bull runs in 1980 and 2011. This test follows the formation of a multi-year rounded base and renewed momentum from its channel support. At the same time, silver’s strength relative to the S&P 500 is breaking out from a similar bottoming pattern, reinforcing the bullish case. Together, these absolute and relative signals suggest a structural shift that may drive substantial long-term upside.
Silver Tests Historic $50 Level in Well-Defined Ascending Channel Structure
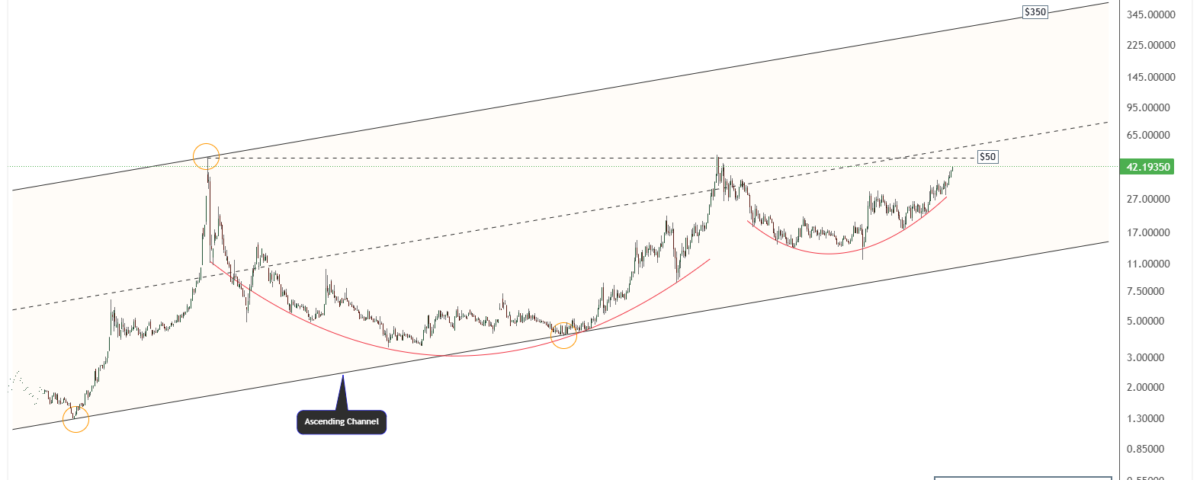
The silver chart below shows a well-defined ascending channel that has guided price action since the early 1970s. This long-term structure has consistently influenced silver’s price movement. Historical highs and lows have aligned with the channel’s upper and lower boundaries. Notable peaks occurred in 1980 and 2011, both reaching around the $50 level. Each of these highs was followed by prolonged corrections that shaped broad, rounded bottoms over several decades.

Importantly, silver bounced off the channel’s lower boundary during the 2001–2003 cycle, forming a solid long-term base. A similar accumulation phase has taken place between 2013 and 2023, creating a rounded base that mirrors earlier bullish setups. Currently, silver is trading near $42, bringing it close to the critical $50 resistance zone. If confirmed, a breakout above this level would represent a significant technical milestone and could set the stage for a strong upward move.
Consequently, if silver clears the $50 mark with confirmation, it would validate the long-term structure and likely trigger renewed bullish momentum. The ascending channel suggests that once resistance is broken, silver could target levels as high as $150, $225, and even $350 in the coming years. Overall, the alignment of the rounded base, ascending channel, and current momentum signals a strong and sustained bullish trend.
Silver’s Relative Strength against Stocks Signals Multi-Year Upside
The chart below shows the silver-to-S&P 500 ratio, revealing silver’s performance relative to stocks during major economic shifts. The ratio highlights phases when capital rotates from equities into precious metals or vice versa. Historically, silver has consistently demonstrated strong performance during periods of inflation and equity market downturns. As a result, this comparison provides valuable insights for long-term investors.
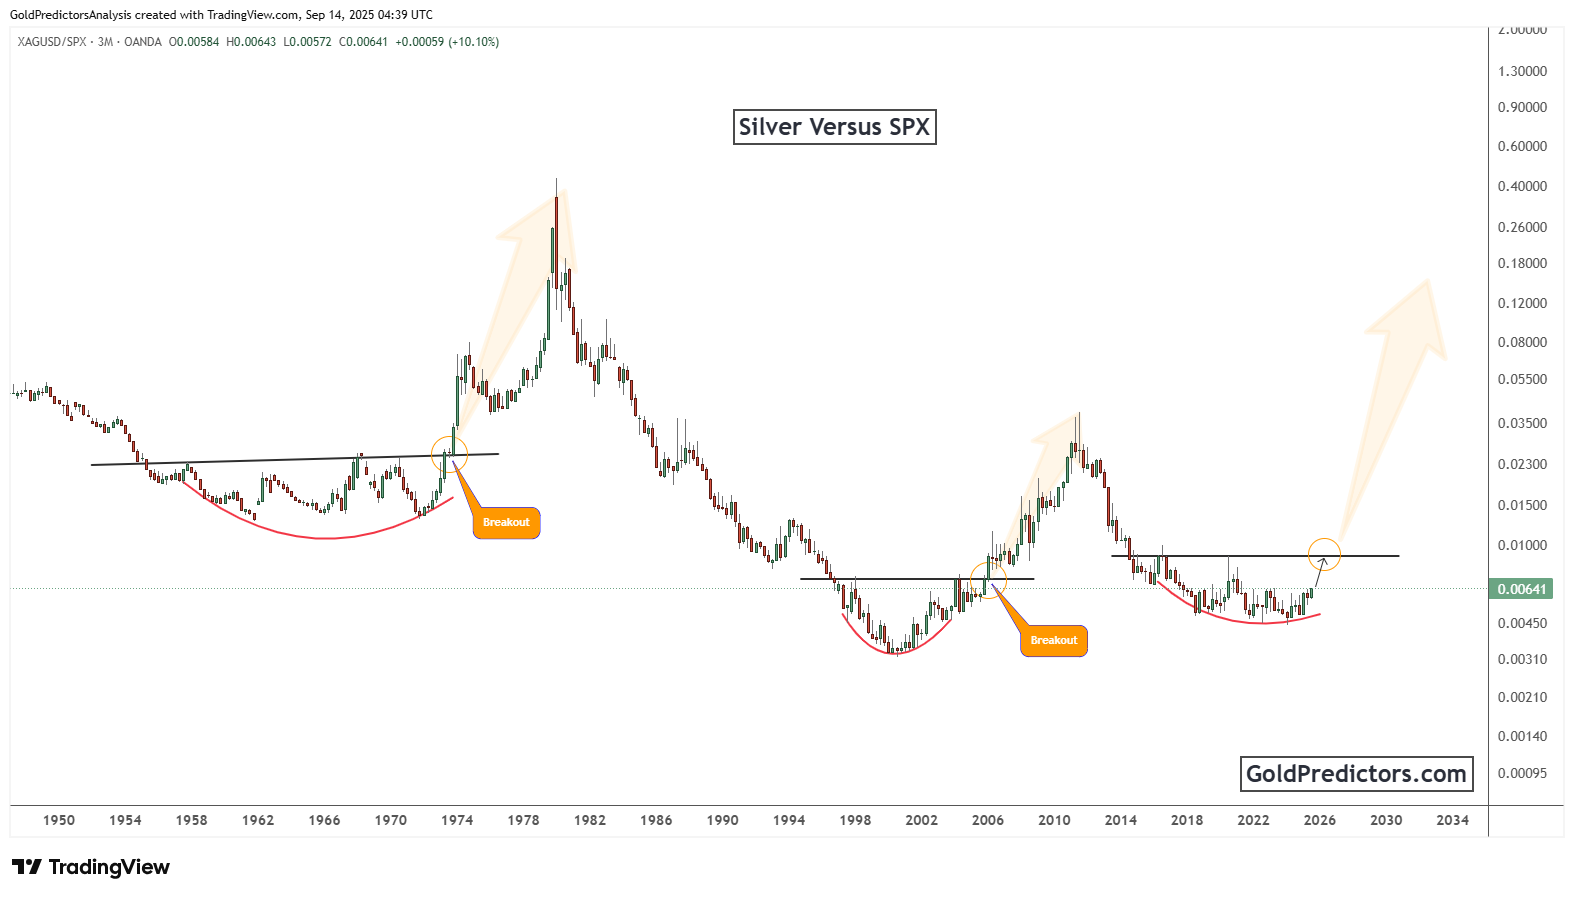
Furthermore, the chart shows three rounded bottoms, beginning in the early 1970s and repeating in the early 2000s. Another similar formation has emerged between 2018 and 2025. Notably, each of the previous bottoms led to powerful breakouts and significant silver outperformance against equities. The recurrence of these formations suggests a repeating cycle that could now be entering its next phase.
Currently, the ratio is attempting to break above a key neckline, mirroring the early stages of past surges. If this breakout holds, it would confirm a structural shift in favour of silver. Moreover, such a move would support silver’s relative strength and further validate its broader bullish outlook. Ultimately, the ratio provides additional confirmation that silver could be starting a multi-year phase of strength against equities.
Silver Outlook: Confirmed Breakout above $50 Could Unleash Long-Term Upside
Silver is now positioned at the edge of a significant breakout, backed by decades of structural support and repeating technical formations. The long-term ascending channel has guided silver’s price action reliably for over 50 years. Silver’s current test of the $50 resistance mirrors the historic peaks reached in 1980 and 2011. The rounded base built between 2013 and 2023 creates a strong foundation for continued bullish momentum.
At the same time, silver’s strength relative to the S&P 500 adds another layer of confirmation. The ratio chart reveals a repeating cycle of rounded bottoms, each followed by periods of silver outperformance. The current breakout attempt from this structure mirrors earlier transitions that marked major bullish phases in silver. A sustained breakout would further reinforce the shift toward greater allocation into hard assets.
Together, these absolute and relative technical signals build a compelling case for silver. A confirmed breakout above $50 would validate the entire long-term bullish structure and could unleash multi-year upside. The combined strength of structural support, cyclical rotation, and momentum signals a transformative phase ahead for silver.
Gold Predictors Premium Membership
Get exclusive short-term and swing trade ideas with precise entry levels, stop-loss, and target prices, including justification and analysis — all delivered directly via WhatsApp.
Our premium service includes deep technical analysis on gold and silver markets. We cover cycle analysis, price forecasting, and key timing levels.
Members also receive a weekly market letter with detailed analysis, commentary from our Chief Analyst, including actionable insights, trade timing, and direction forecasts for gold and silver.
Stay ahead of the market — join our premium community today.


