Gold Targets $4,000 After Healthy Correction From $3,500 Resistance | Gold Predictors - Forecasting Gold Prices

New York

London

Sydney

Tokyo

Log In

  • Register
  • Lost your password?
gold predictorsgold predictorsgold predictorsgold predictors
  • HOME
  • ABOUT US
    • About Us
    • Social Networks
    • Industry Links
    • Testimonials
    • News & Updates
  • RESEARCH
    • Scientific Trade Strategies
    • Gold Hub
    • Gold Importance
    • Silver Importance
  • GOLD HUB
  • GOLD ANALYSIS
    • Gold Analysis
    • Technical Analysis
      • Trend Identification
      • Phase Identification
      • Important Levels
      • Volatility Measurement
    • Gold Cycle
      • Short Term Cycles
      • Medium Term Cycles
      • Long Term Cycles
    • Price Action Analysis
      • Phase Identification
      • Historical Pattern Identification
      • Candlestick Pattern Identification
    • Fundamental Analysis of Gold
    • Gold Related Markets Analysis
    • Gold Seasonal
  • METHODOLOGY
    • Gold Analysis
      • Technical Analysis
      • Gold Cycle
      • Price Action Strategy
      • Fundamental Analysis
      • Gold Related Markets Analysis
      • Gold Seasonal
    • Measure Signal Strength
      • Weak Signal
      • Strong Signal
      • Confirmed Signal
    • Trading Decision
    • Trading Rules
      • Basic Trading Rules
      • Gold Predictors Trading Rules
    • Trade Examples
  • LIVE CHARTS
  • MEMBERSHIPS
    • Free Membership
    • Premium Membership
    • SignUp
  • MEMBERS AREA
    • Free Article
    • Premium Article
    • Long Term Reports
    • Forex Reports
    • Crypto Reports
  • HELP
    • FAQ
    • Contact Us
Login / Register

Gold Targets $4,000 After Healthy Correction From $3,500 Resistance
0
Published by admin at April 24, 2025
Categories
  • Free Articles
Tags
  • dollar
  • forex
  • gold
  • trading signal
  • US Dollar
  • US Dollar rally
gold pattern

Gold has long been viewed as a safe-haven investment during times of uncertainty. In recent months, its price has shown strong momentum and significant upward movement. Investors and traders are closely monitoring gold’s performance to gauge its next direction. According to the latest technical analysis, gold has broken above $3,350 and reached the key resistance at $3,500. A sharp correction has followed from this level, and the market is now seeking its next move. This article explores recent gold price trends to provide insight into where the market may head next.

Gold Breakout Above $3,500 Signals Potential Rally to $4,000

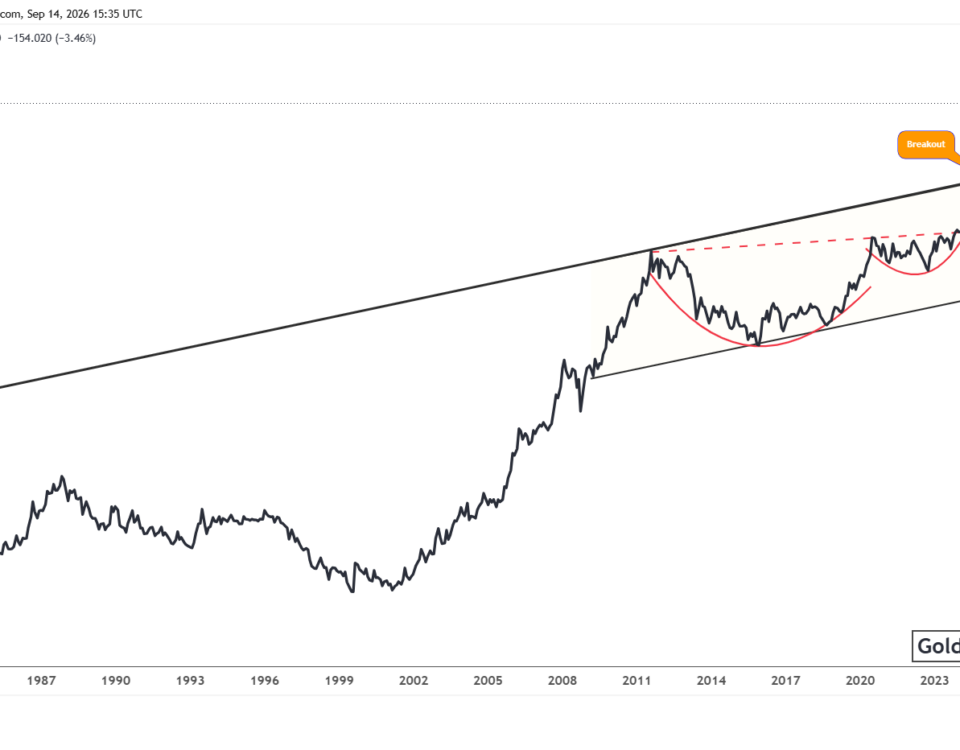
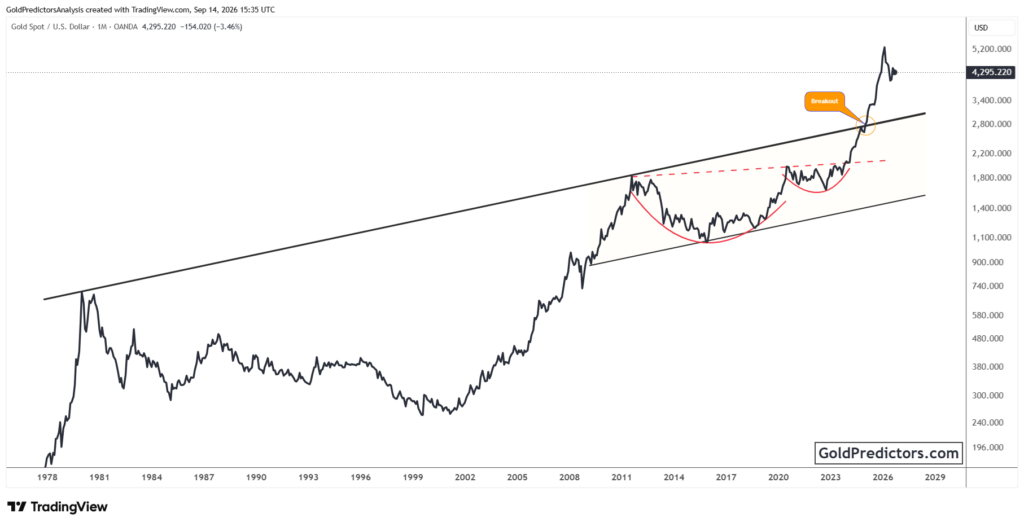
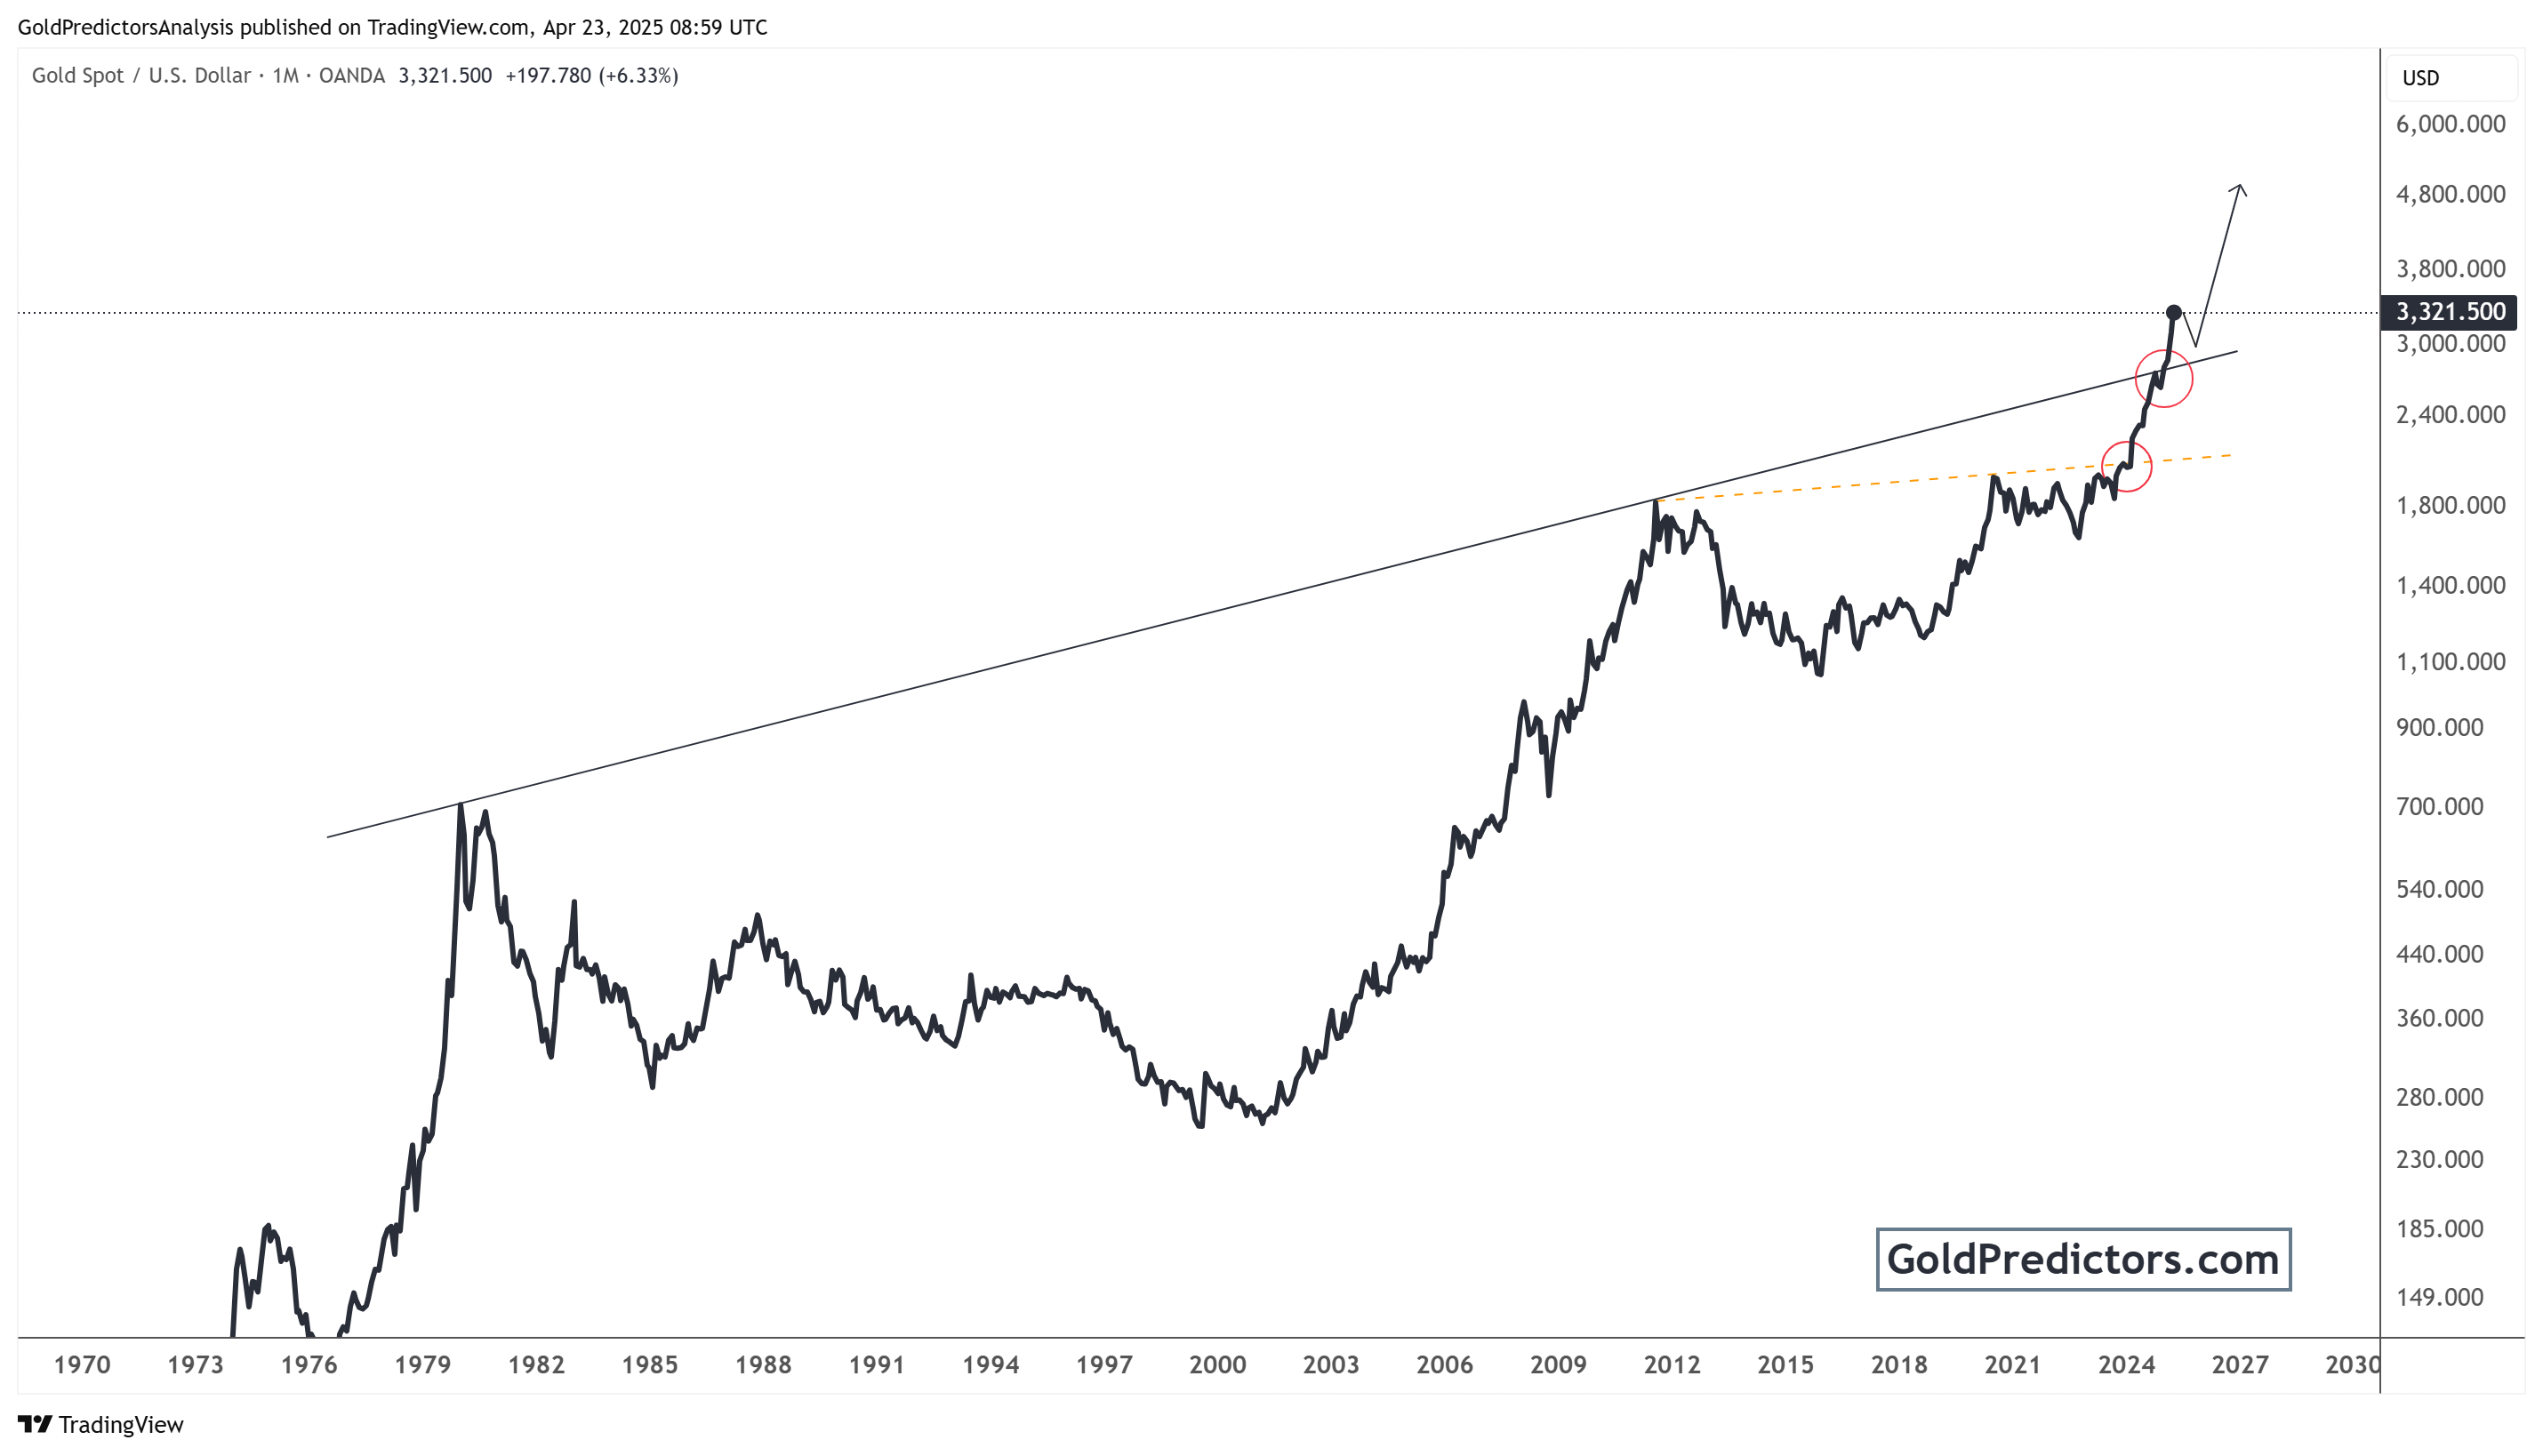
The monthly gold chart shows long-term price trends from 1970 to 2025. Historically, gold has moved in strong upward waves during times of inflation, currency devaluation, and geopolitical tension. In the 1970s, gold rose sharply and formed its first major peak. After a long correction, gold started another bullish phase in the early 2000s, reaching around $1,900 by 2011.
gold pattern

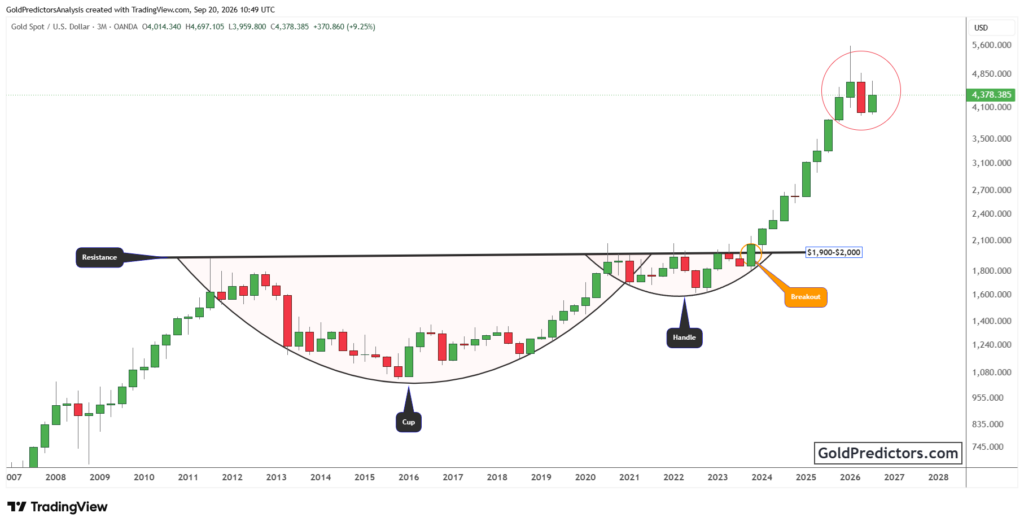
From 2011 to 2019, gold moved sideways. But since 2020, the price has gained momentum again. The chart clearly shows that gold broke a key horizontal resistance level marked with an orange dashed line near $1,900-$2000. This breakout led to a rapid price increase. Recently, gold has also broken above a major long-term trend line that acted as resistance for the past 40 years. This breakout was highlighted with red circles on the chart.

Currently, gold is trading at a strong price point. A price correction from this zone may set the stage for another surge in the gold market, potentially targeting the $4,000 and $6,000 levels. The black arrow on the chart shows a possible future path with a short-term correction followed by continued bullish momentum. This long-term breakout is very important. It suggests that gold may enter a super bullish cycle in the coming years if it holds above the breakout level.

Gold Price Holds Above Key Support as Uptrend Remains Intact

The weekly chart for gold shows a strong and steady upward trend. Gold has been moving inside a parallel ascending channel for over a year. Each dip has been followed by a recovery, which indicates strong buyer interest.

gold pattern

Recently, gold reached the upper red trend line resistance at $3,500. This price level has been marked with a pink arrow and a yellow circle. The price touched this resistance and slightly pulled back, now trading around $3,315. This small pullback is natural in any strong uptrend. The immediate support for this correction is at $3,280, while the overall pattern remains bullish as long as the price holds above the $3,000 level. If gold maintains this zone, it may build enough strength to break above the $3,500 mark.

Moreover, the trend within the channel is consistent and strong. Traders and analysts will be watching closely to see if gold can break above $3,500 in the next few weeks. If it does, the next targets could be $4,000.

Final Words

In conclusion, gold remains in a strong uptrend despite the recent pullback from $3,500. The price continues to hold above key support levels, suggesting that bullish momentum is intact. If gold maintains the $3,000–$3,280 zone, it could soon attempt another breakout. A move above $3,500 may open the path toward $4,000 and beyond, confirming a long-term bullish cycle.
Latest Post

Free Articles

Gold Price Forecast: XAU/USD Consolidates as Gold-to-Platinum Ratio Holds Key Support

Gold consolidates above its long-term breakout, while the Gold-to-Platinum ratio holds support and keeps the technical outlook intact …
Read More
September 20, 2026 / admin
Free Articles

Silver vs. Silver Miners: Will Support Define the Next Trend?

Silver holds its major breakout support while the Silver versus Silver Miners ratio returns to …
Read More
September 16, 2026 / admin
Free Articles

Gold vs Google: Is the Ratio Ready to Challenge Long-Term Resistance?

Gold holds above its long-term breakout trendline, while the Gold versus Google ratio remains below …
Read More
September 14, 2026 / admin
Free Articles

Silver Price Analysis: XAG/USD Holds Long-Term Support as Stocks vs Silver Ratio Rebounds

Silver holds above its historic breakout support, while the Stocks versus Silver ratio rebounds from …
Read More
September 8, 2026 / admin
Free Articles

Gold Price Forecast: XAU/USD Holds Long Term Breakout as Nasdaq-to-Gold Ratio Stays Below Resistance

Gold holds its long-term breakout while Nasdaq-to-Gold remains below resistance, supporting continued strength in gold …
Read More
September 2, 2026 / admin
Free Articles

Silver vs Copper: Can Silver Regain Strength against Copper?

Silver holds above key support while the silver-to-copper ratio shows renewed strength, supporting a positive …
Read More
August 26, 2026 / admin
Become a Premium Member

Related posts

Gold Pattern
September 20, 2026

Gold Price Forecast: XAU/USD Consolidates as Gold-to-Platinum Ratio Holds Key Support


Read more
Silver Pattern
September 16, 2026

Silver vs. Silver Miners: Will Support Define the Next Trend?


Read more
Gold Pattern
September 14, 2026

Gold vs Google: Is the Ratio Ready to Challenge Long-Term Resistance?


Read more

Comments are closed.

ABOUT US

  • About Us
  • Social Networks
  • Industry Links
  • Testimonials
  • Terms & Conditions

TECHNICAL ANALYSIS

  • Technical Analysis
  • Trend Identification
  • Phase Identification
  • Important Levels
  • Volatility Measurement

CYCLE ANALYSIS

  • Gold Cycle
  • Short Term Cycles
  • Medium Term Cycles
  • Long Term Cycles

PRICE ACTION ANALYSIS

  • Price Action Analysis
  • Phase Identification
  • Historical Pattern Identification
  • Candlestick Pattern Identification
© 2017 Gold Predictors. All Rights Reserved.
  • Remember Me
    Lost your password?
    Dont have an account?Sign Up