New Zealand Dollars Likely To Weaken
In last week’s report, we discussed the significance of US dollar levels and the formation of the EURUSD bottom. The US dollar encounters resistance and retreats to the support. EURUSD has bottomed out at the support level and is now bouncing off the major support level. We discussed the weakness of the New Zealand dollars by focusing on two instruments: GBPNZD and NZDCAD. The NZDCAD is falling, while the GBPNZD is rising. We continue to believe that these two pairs will move in the same direction. However the volatility may remain high during the summer doldrums.
Highlights
- The US dollar index bounced from long-term support and encountered resistance at the first junction. Sideways market range with a bearish edge.
- EURUSD pulls back to the long-term breakout point before resuming its upward trend. Sideways market range with a bullish edge.
- Based on our forecast from January 2021, the GBPNZD has been strong and is expected to shoot multiple thousands of pips higher.
- NZDCAD has been falling and is likely to fall further.
- Based on recent Australian dollar weakness, GBPAUD broke the bullish inverted head and shoulder pattern and is expected to rise in the coming weeks.
Best Instruments to Focus:
Long GBPNZD
Long GBPAUD
Short NZDCAD
Retracement of the US dollar
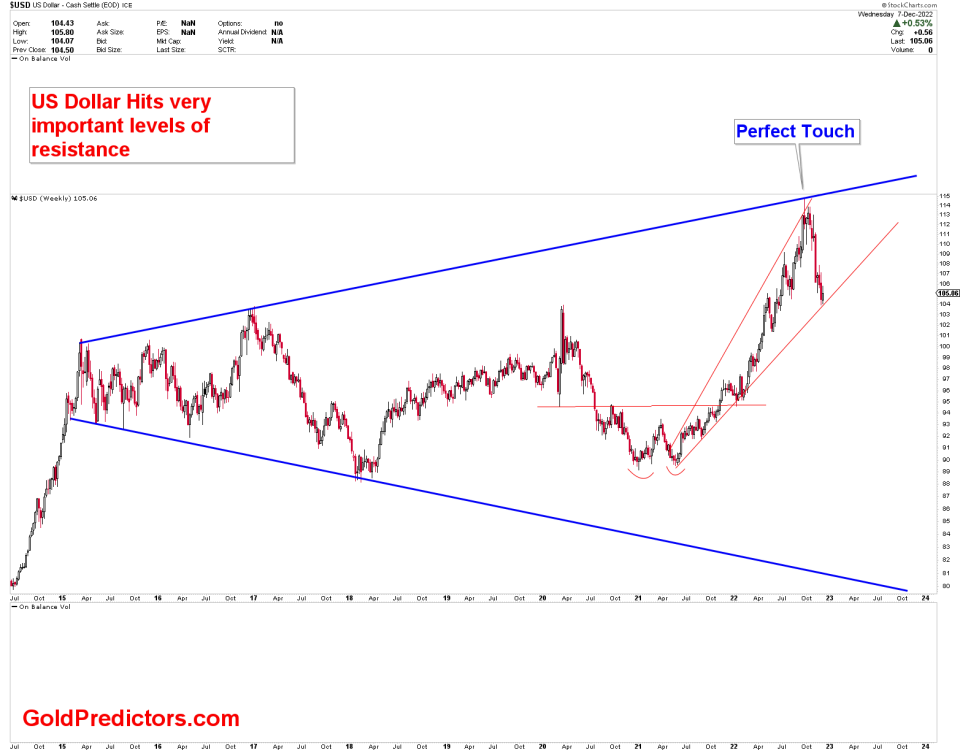
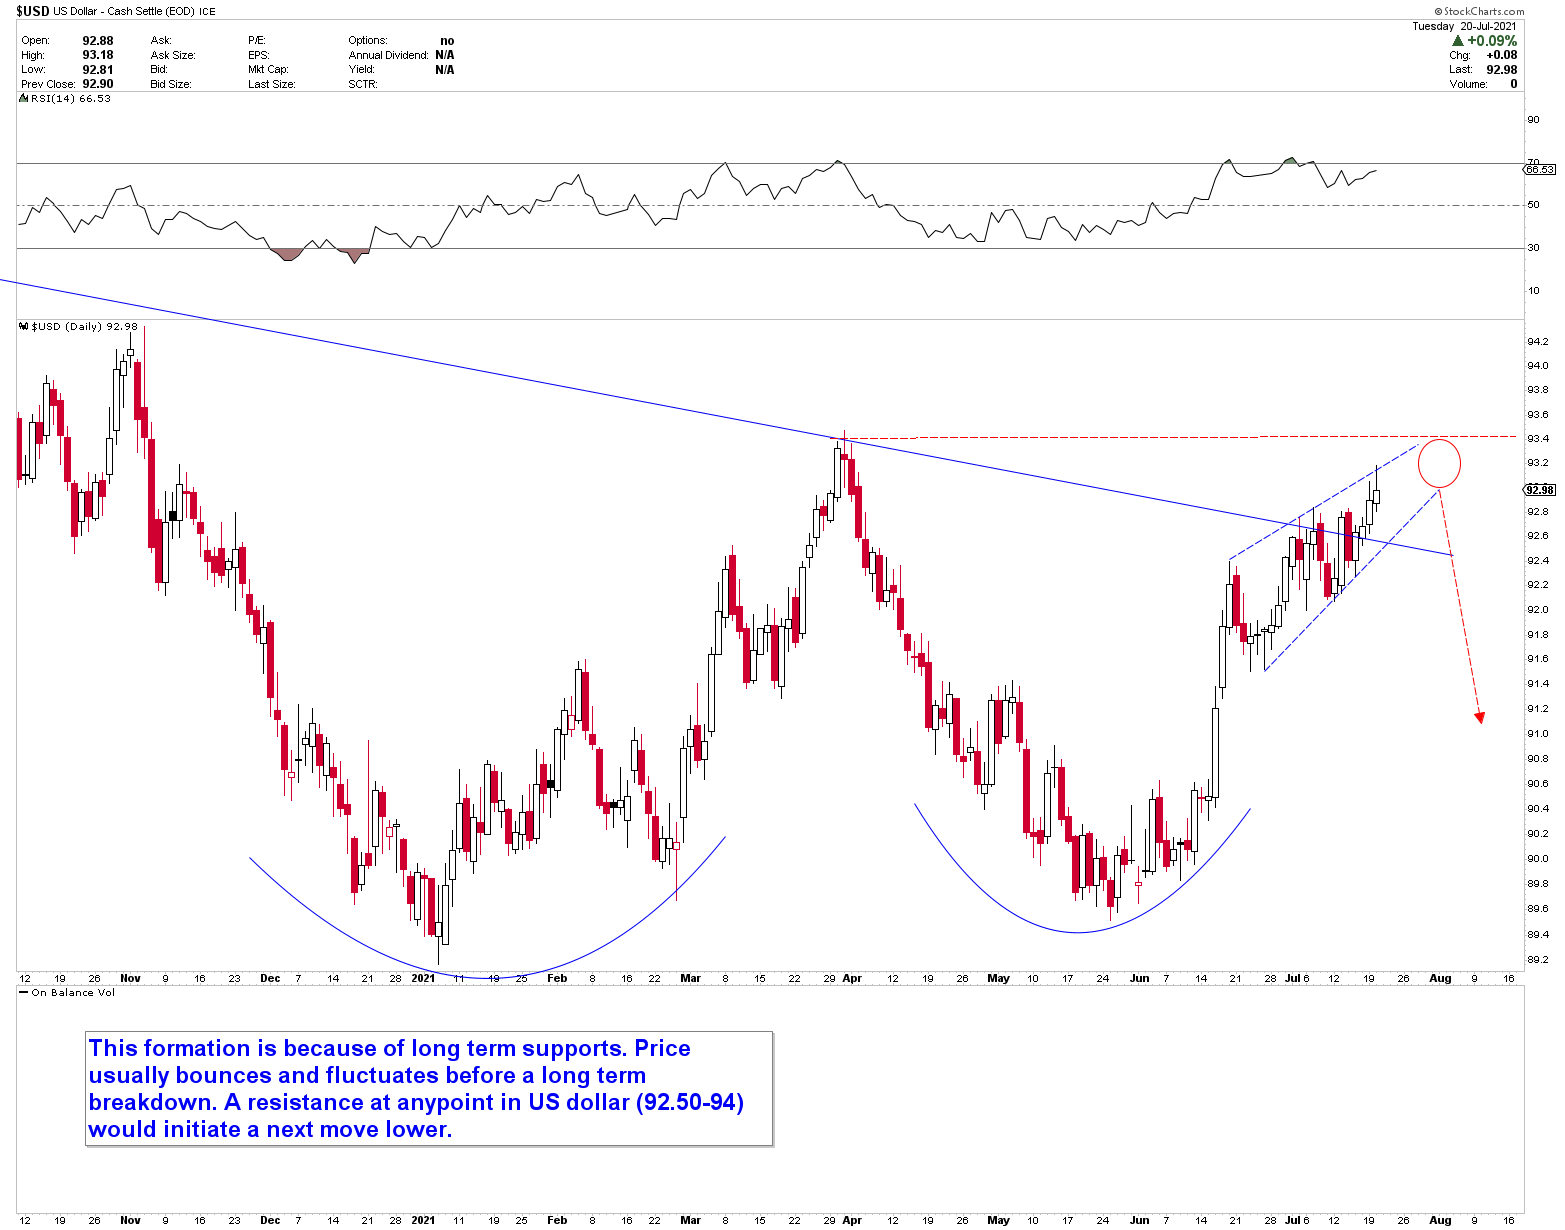
The chart below was included in the previous report. The US dollar encountered resistance and reversed lower. For the US dollar, this is a strong sideways zone. Because long-term support levels have been tested, the US dollar may remain in a sideways range before collapsing dramatically.
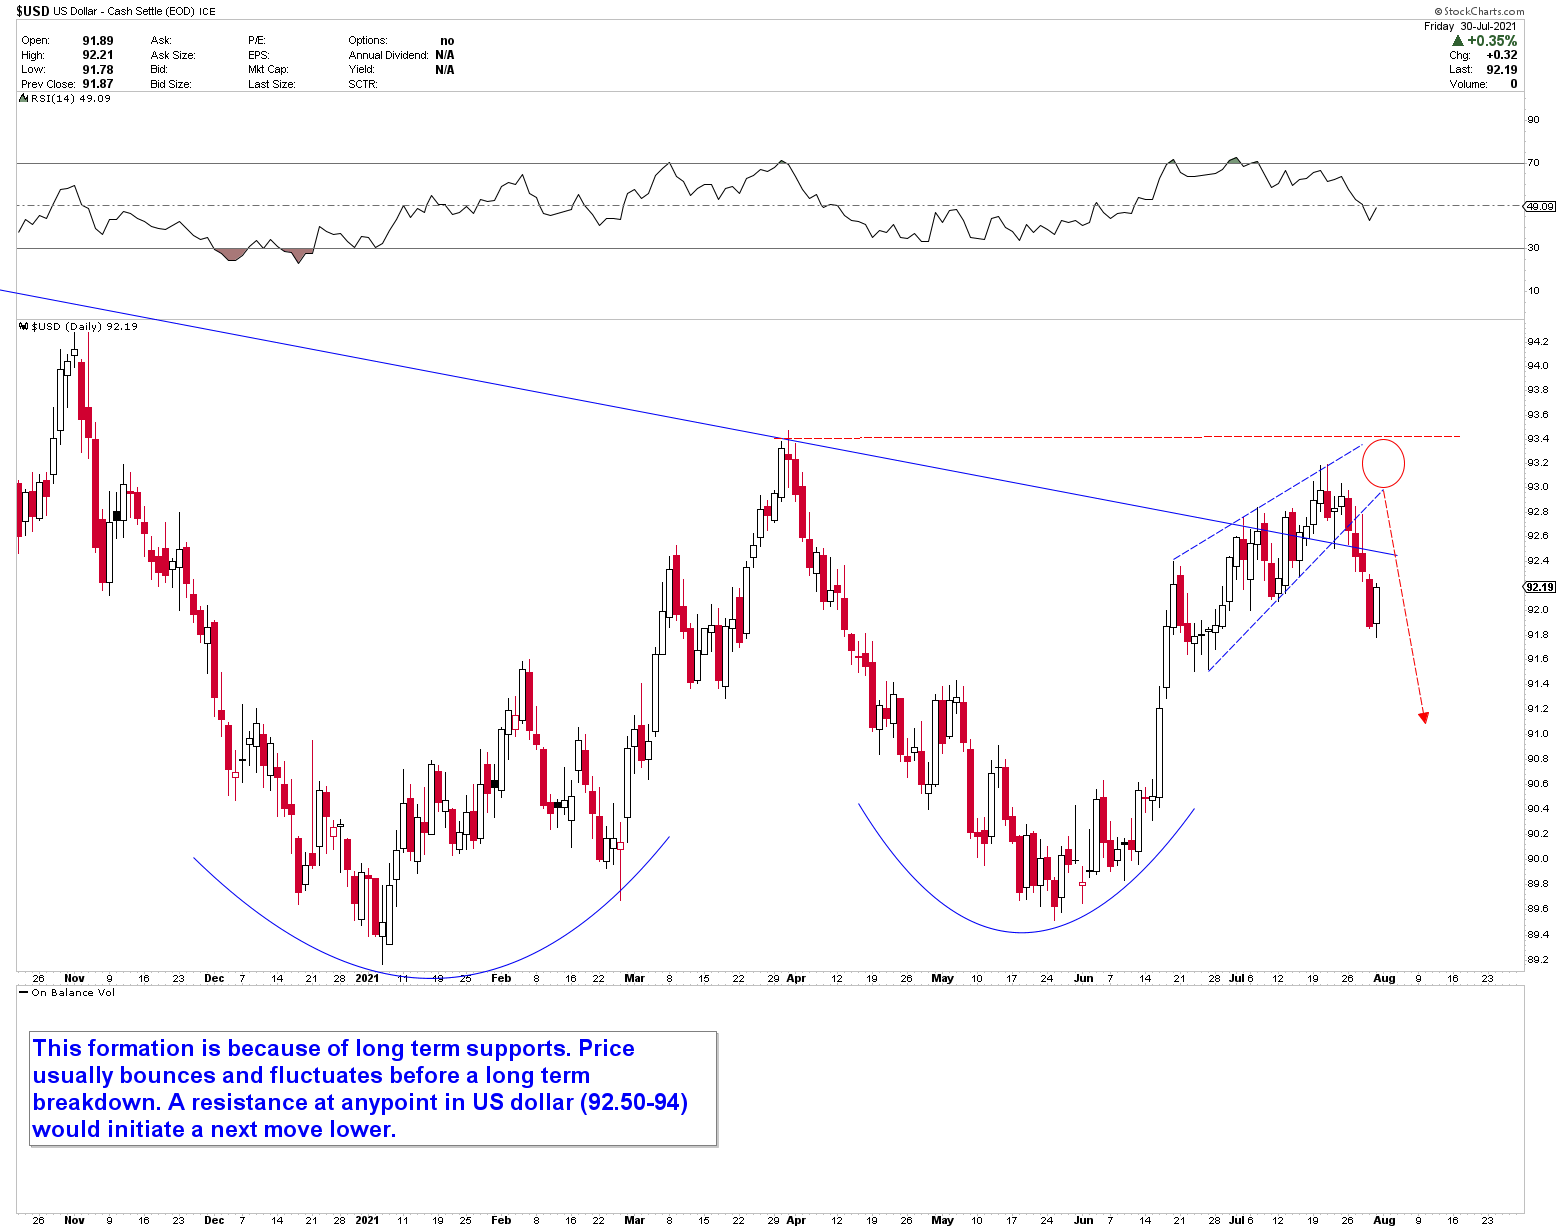
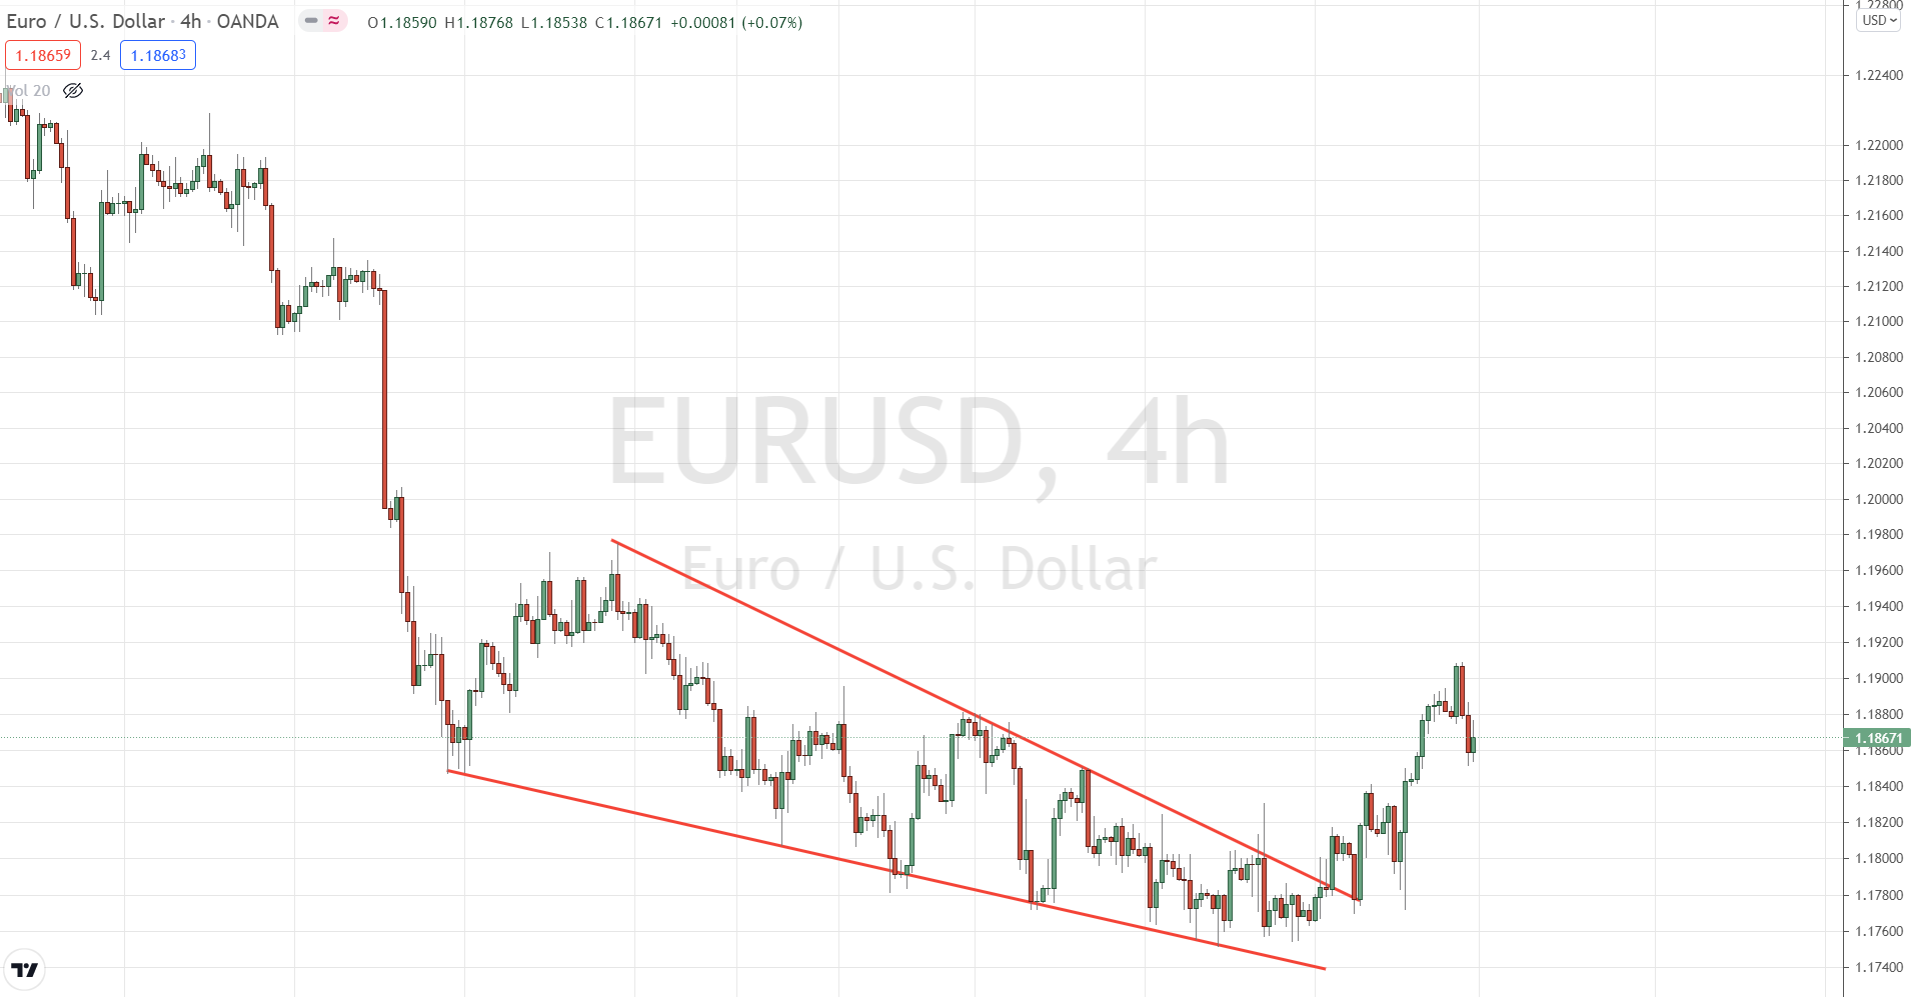
The rising wedge in the US dollar index was accompanied by a falling wedge in the EURUSD. Because a falling wedge is a bullish pattern, we were bullish on the EURUSD. Since the rising wedge in the USD index was broken, the falling wedge in the EURUSD has also been broken. These two patterns are likely to follow trends in both markets.

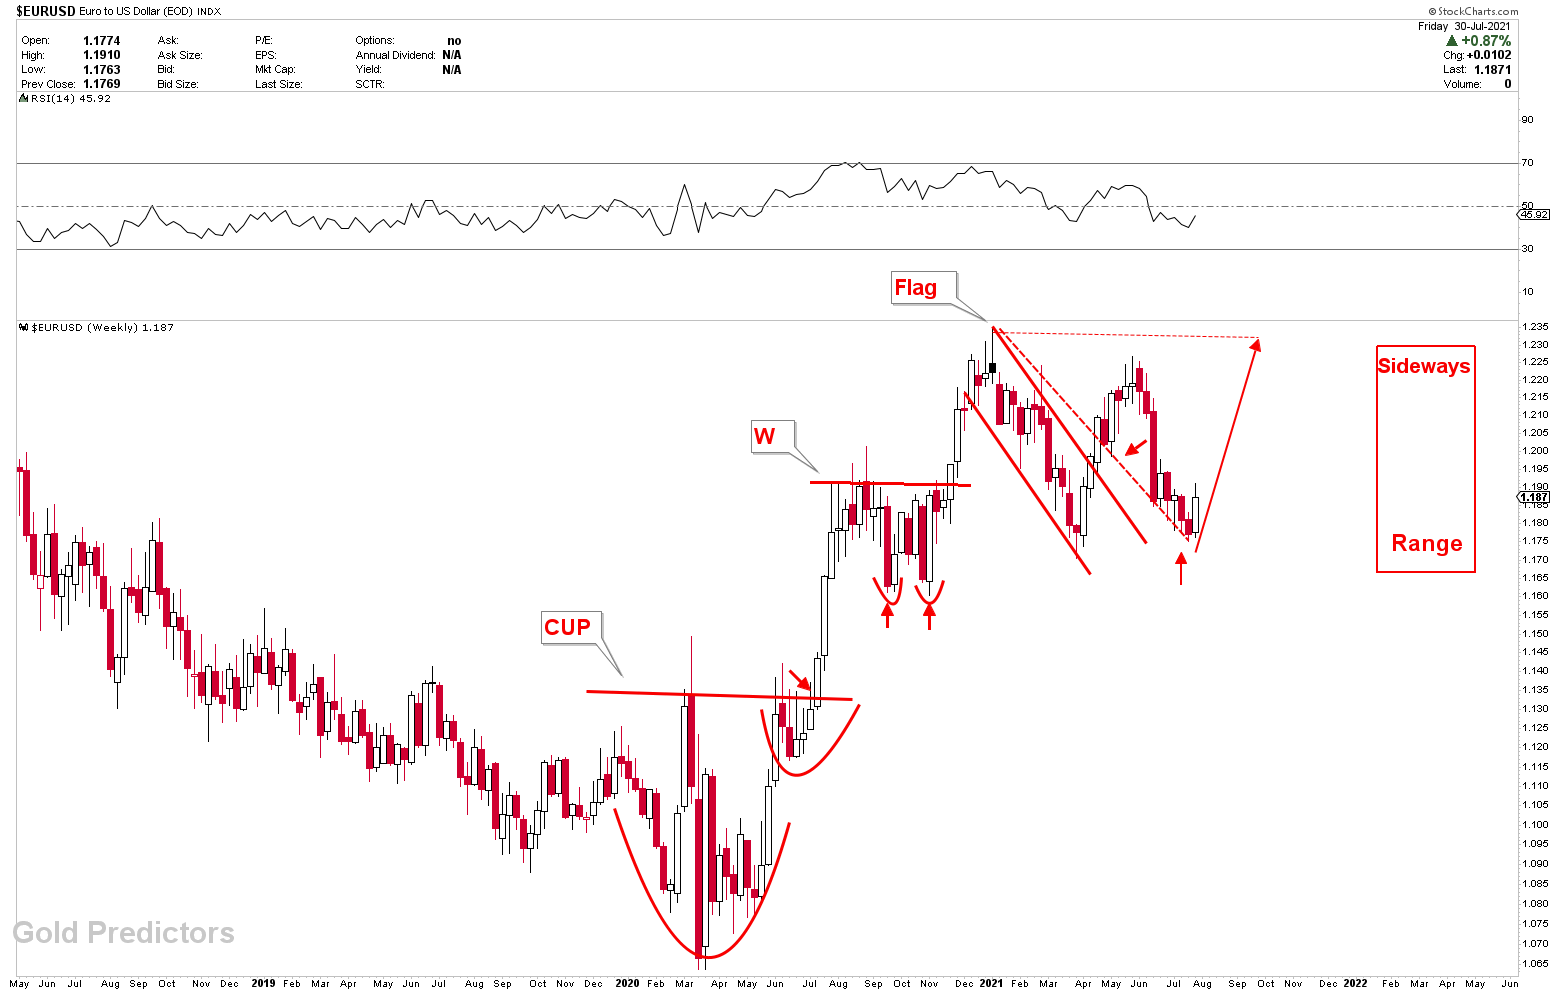
This can be seen by taking a long-term look at the EURUSD chart. The price has compressed near the bottom of the flag line. This is bullish parameter and indicate that the pair must bottom here before moving higher. Another favorable parameter was the bottom range of the sideways market of 1.17-1.23.
New Zealand Dollars Reaction
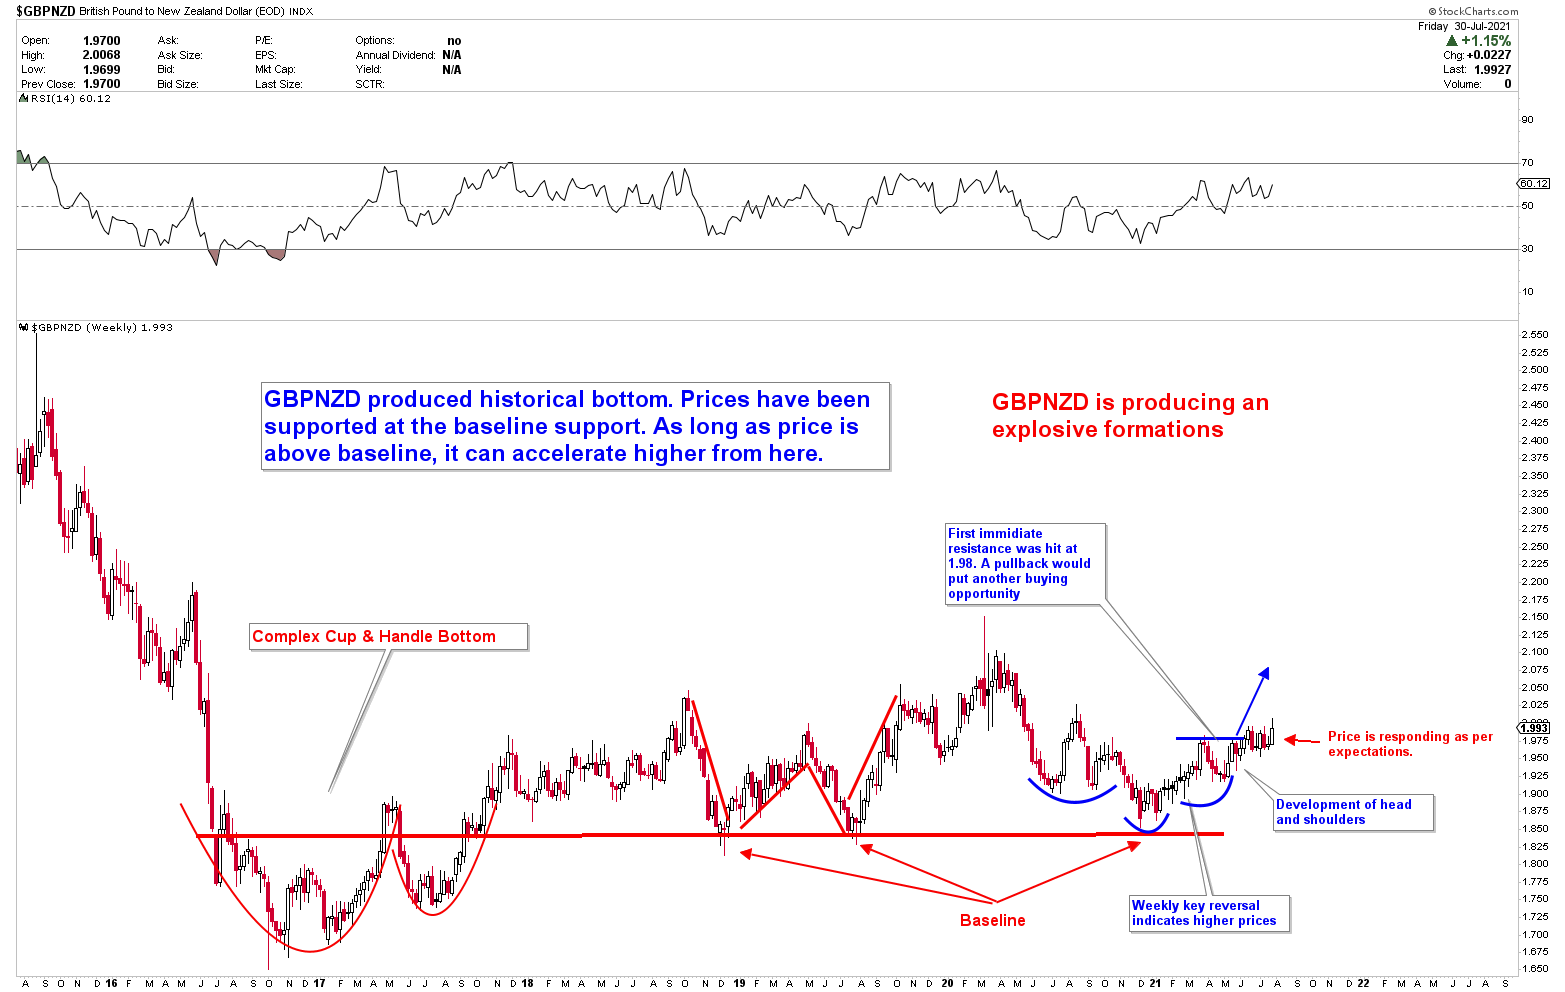
The GBPNZD outlook is depicted in the chart below. Bullish patterns first appeared in 2016-2017, with complex cup and handle patterns followed by a W above the baseline support. The recent development of a blue inverted head and shoulder above the baseline support suggests that this pair is likely to move thousands of pips higher. The pair has already gained 1000 pips since our prediction in January 2021. It still has a long way to go as long as baseline support holds.
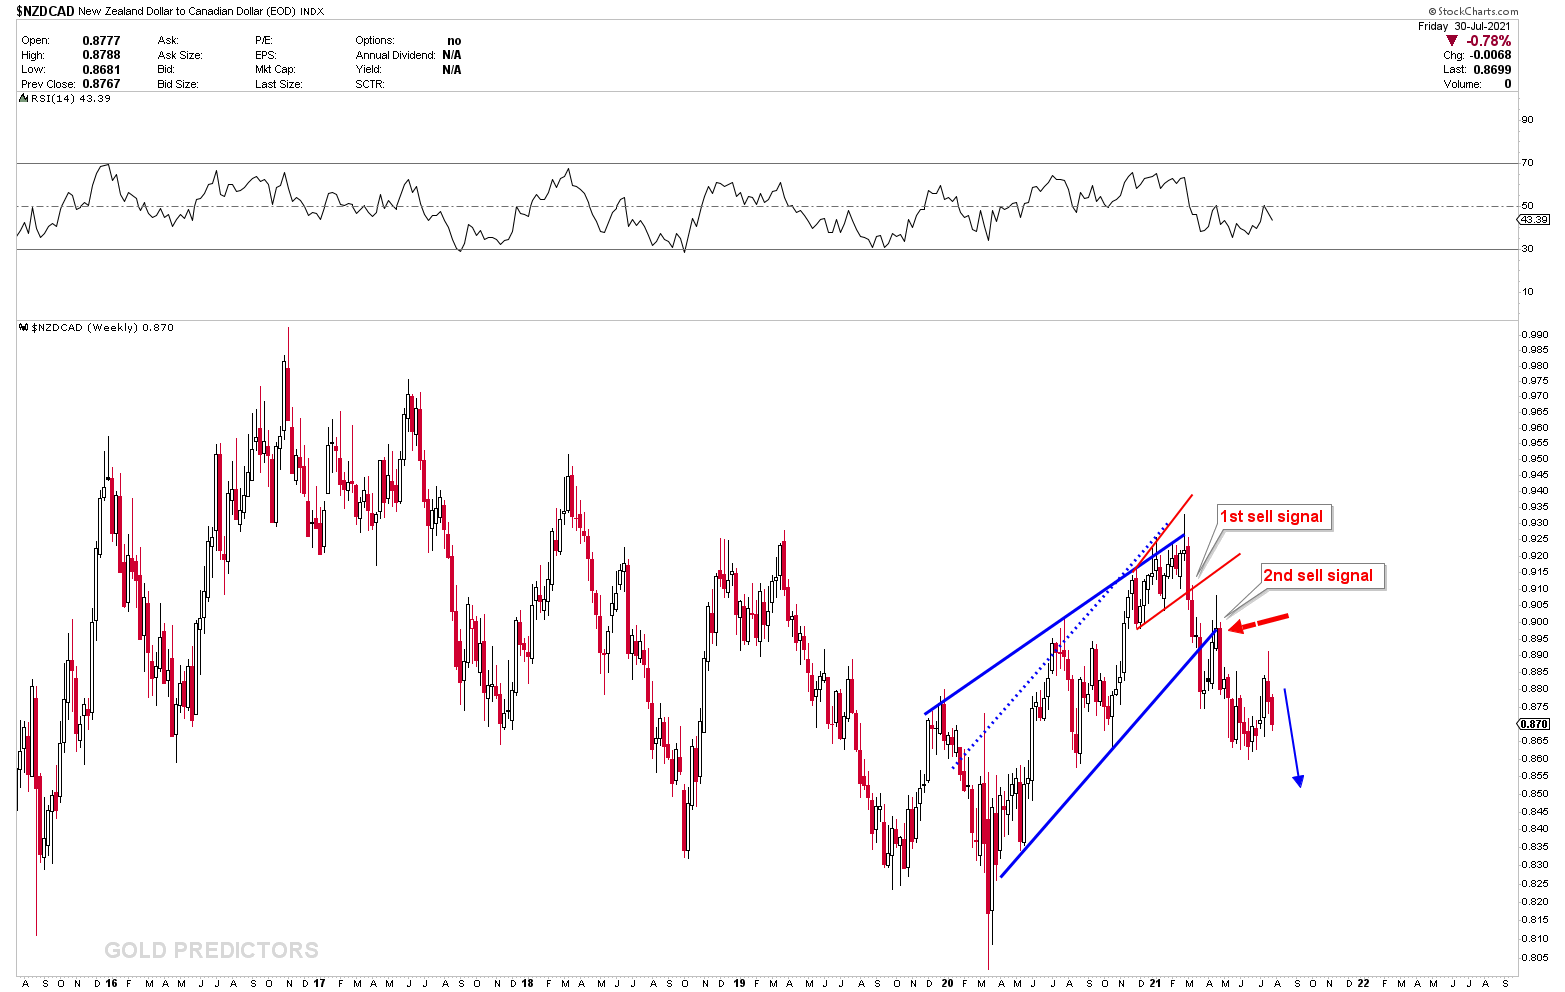
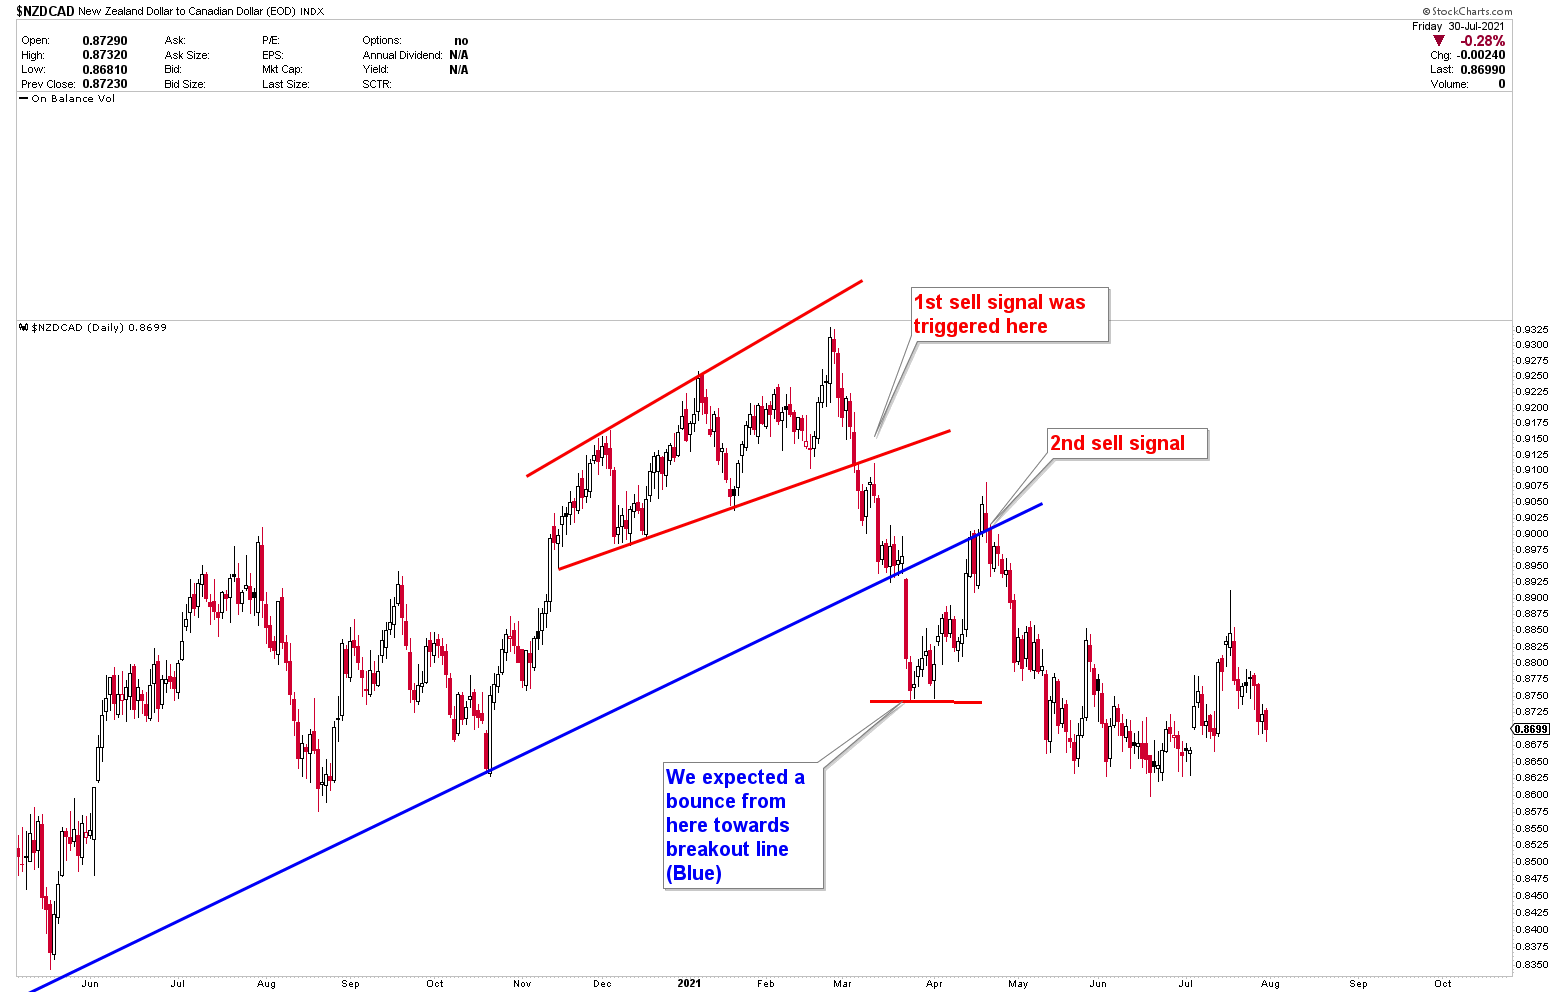
NZDCAD is another chart that shows the weakness of the New Zealand dollars. Because the Canadian dollar has been the stronger currency, NZDCAD must follow the downside path set by the NZD weakness. The blue rising wedge patterns on the chart support the bearish view, indicating that the instrument must drop further. A breakout of the red ascending broadening triggered the first sell signal. On other hands, a retest of the blue rising wedge triggered the second sell signal. The pair appears to be on the verge of a drop, and any strength should be viewed as a selling opportunity. The zoomed out version of the chart is shown in the next chart.
