


Gold vs Silver: New Bull Market Unfolds as Silver Strengthens against Gold
Gold (XAUUSD) has entered a powerful long-term bull phase after breaking decisively above its long-standing resistance zone. This breakout confirms a major structural shift and highlights renewed momentum across the precious metals space. Price continues to hold above key support, with strong technical positioning signaling further upside potential. Meanwhile, a clear breakdown in the gold-to-silver ratio signals a potential leadership shift toward silver, which now shows signs of relative strength. These developments mark the early stages of a broader revaluation cycle in gold and silver.
Gold Confirms Structural Breakout with Bullish Long-Term Setup
The gold chart below shows a decisive breakout from a multi-year consolidation phase. After years of consolidation below $2,000, the price broke out decisively above horizontal resistance and surged past $4,000. This breakout confirms a major structural shift in the market and signals the start of a powerful long-term bull trend.
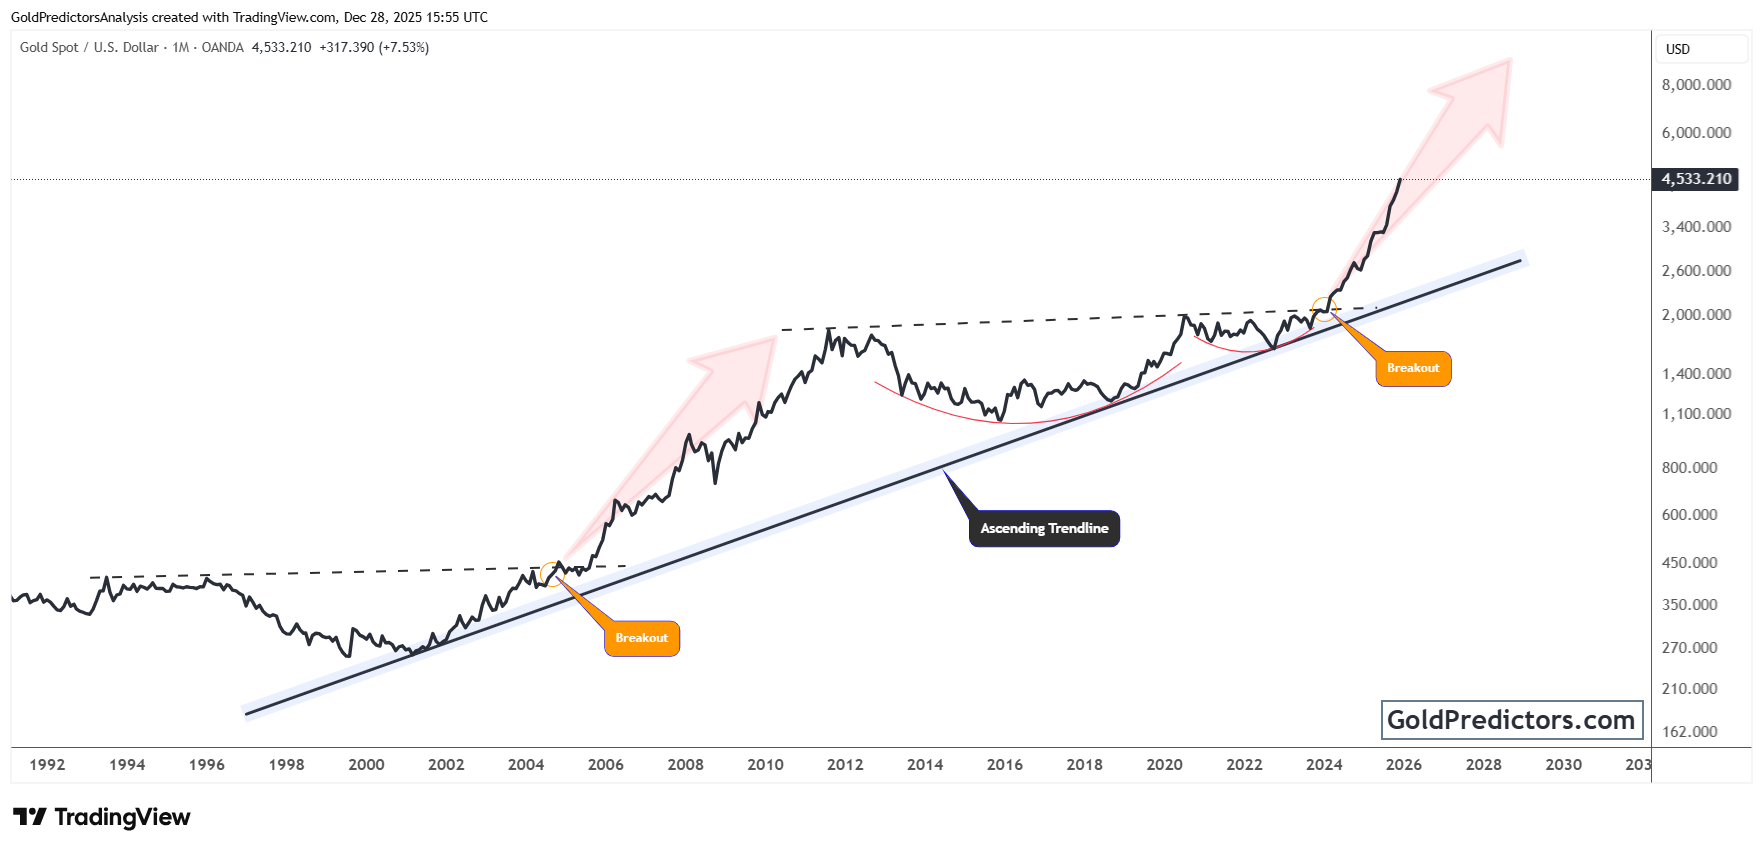
Notably, the multi-decade rising trendline has consistently provided a reliable support base for gold’s long-term uptrend. It held through previous corrections and now serves as a foundation for further upside. Previous breakouts from this trendline have resulted in strong rallies, highlighting its continued importance as a key support level.
Gold continues to trade in a strong technical position following its decisive breakout. The move above multi-year resistance reflects sustained strength, with price and volume signaling continued demand and market conviction. As long as gold holds above $4,000, the breakout setup remains intact. The next major target lies significantly higher, potentially in the $6,000 to $8,000 range, as shown by the extended projections on the chart.
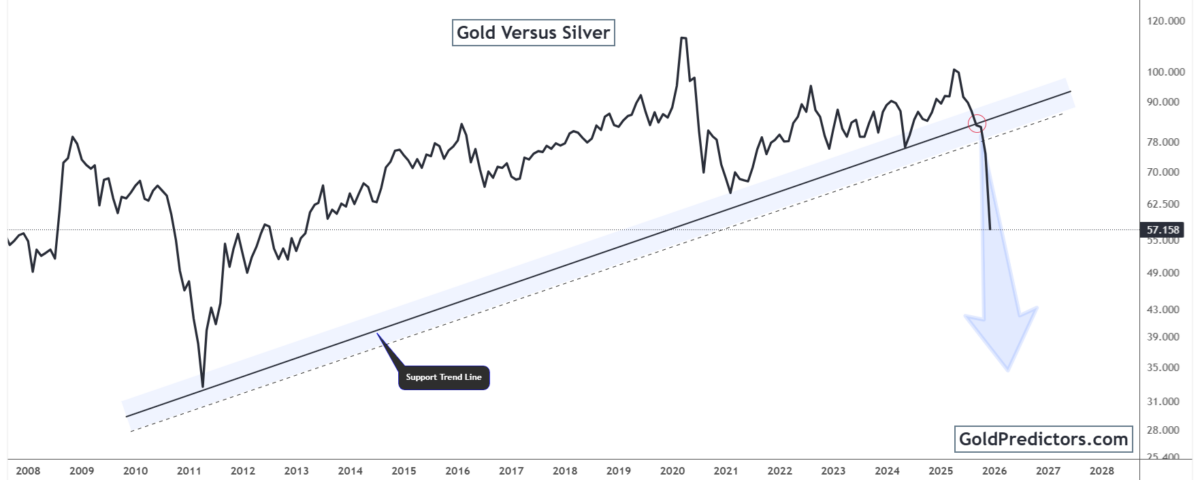
Gold-to-Silver Ratio Breakdown Signals Silver Outperformance Ahead
The chart below shows a bearish breakdown in the gold-to-silver ratio. This ratio had followed a steady uptrend since 2011, reflecting gold’s relative strength over silver. However, recent price action has broken decisively below the decade-long support trendline. This shift suggests a potential rotation into silver, setting the stage for relative outperformance in the months ahead.

The gold-to-silver ratio faced a strong rejection near its recent highs, followed by a decisive breakdown below its long-standing support line. This move confirms fading bullish momentum and suggests the start of a potential long-term reversal. The ratio is now trading near recent lows, with technical signals pointing to further downside potential.
Moreover, the breakdown in the ratio suggests silver may begin to outperform gold in the periods ahead. Historically, similar breakdowns have preceded strong capital rotation into silver. If this pattern holds, silver could enter a sustained phase of relative strength, especially during periods of rising inflation or easier monetary policy. This shift also strengthens the case that silver’s recent move marks an early phase of renewed momentum in the hard-asset space.
Conclusion: Precious Metals Enter Structural Bull Phase with Silver Gaining Ground
Gold and silver are both showing strong technical foundations, suggesting that a new long-term cycle may be underway. Gold has broken through multi-decade resistance, confirming a structural breakout. This momentum reflects growing demand for real assets as markets react to shifting policies and global uncertainty. With the long-term trendline holding firm, gold stands on a solid foundation for continued upside.
At the same time, the breakdown in the gold-to-silver ratio signals that silver may begin to outperform. The loss of upward momentum in the ratio, combined with a clear violation of long-standing support, points to a rotation into silver. Historically, these moves have triggered sustained capital inflows, especially during inflationary periods or times of monetary easing. This evolving trend highlights a shifting dynamic within the precious metals space, where silver could lead the next phase of upside.
These developments signal a broader shift in the valuation of hard assets. Long-term price structures in both gold and silver confirm the technical strength behind this move, while macro conditions remain firmly supportive. The combination of structural breakouts and a weakening gold-to-silver ratio suggests that gold and silver are entering a new phase of sustained market leadership.
Gold Predictors Premium Membership
Get exclusive short-term and swing trade ideas with precise entry levels, stop-loss, and target prices, including justification and analysis — all delivered directly via WhatsApp.
Our premium service includes deep technical analysis on gold and silver markets. We cover cycle analysis, price forecasting, and key timing levels.
Members also receive a weekly market letter with detailed analysis, commentary from our Chief Analyst, including actionable insights, trade timing, and direction forecasts for gold and silver.
Stay ahead of the market — join our premium community today.


