


Gold vs. Dollar: Structural Breakdown Signals Major Trend Shift
Gold (XAUUSD) has surged past a major long-term resistance line, completing a generational cup-and-handle pattern that began forming in 1980. This breakout confirms the end of a multi-decade consolidation and marks the start of a powerful upward trend.
At the same time, the U.S. Dollar-to-Gold ratio has broken down from a key support level, highlighting gold’s rising strength not just in nominal terms but also relative to fiat currency. These structural shifts signal a broader reevaluation of gold’s role in the global monetary system, positioning it as a leading store of value in the current macroeconomic environment.
Gold Breaks Multi-Decade Resistance, Completing Generational Cup-and-Handle Formation
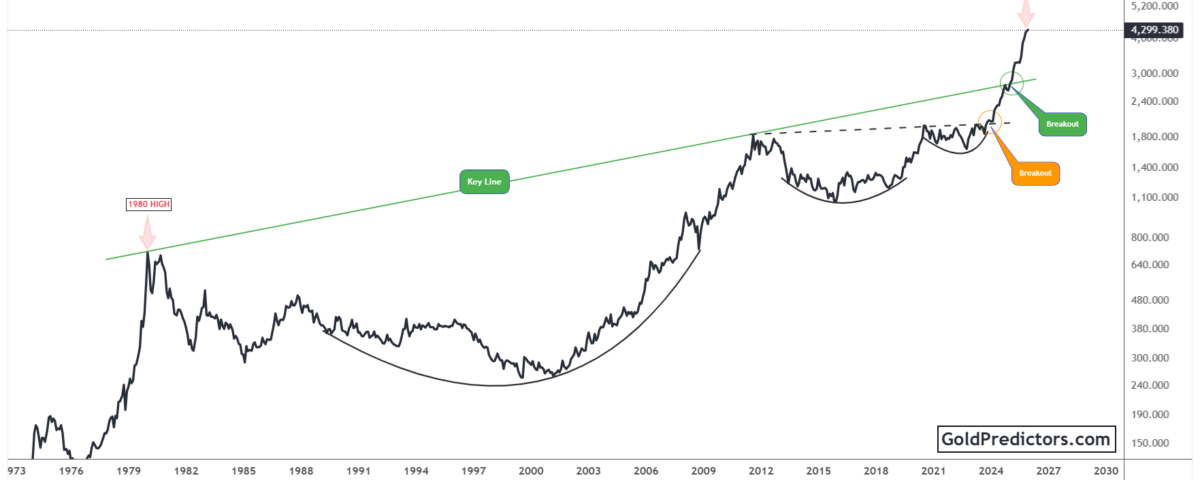
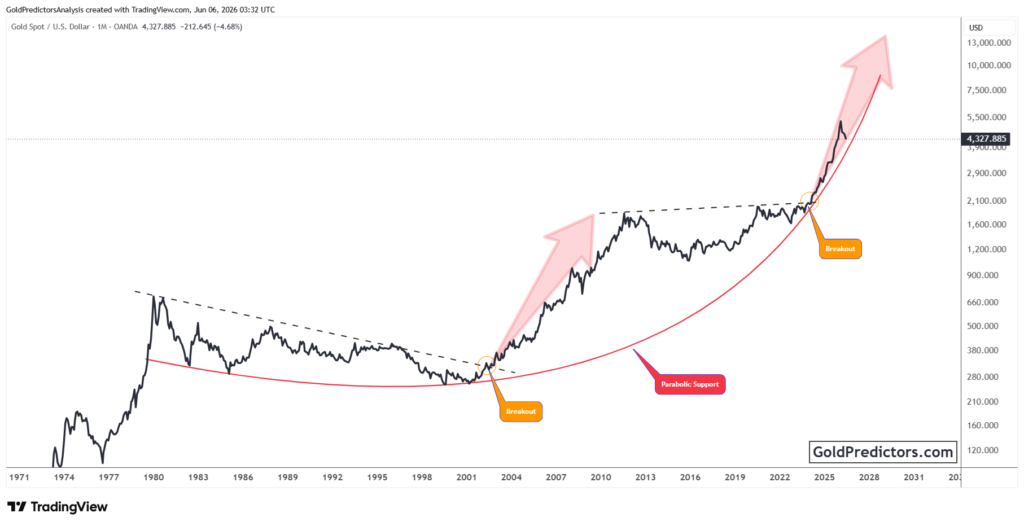
The gold chart below shows a decisive breakout above a long-standing resistance line that connects the 1980 high with the 2011 peak. This breakout confirms the completion of a massive cup-and-handle formation that developed over several decades. The green “Key Line,” which acted as a structural ceiling for over 40 years, has now been breached. Gold’s move above this multi-decade barrier validates the long-term bullish setup and opens the door to sustained upside in uncharted territory.

The initial rounded base, spanning from 1980 to 2011, represents a long period of structural compression. This was followed by a smaller base from 2012 to 2020, forming the classic “handle” of a cup-and-handle formation. Afterwards, a secondary rounded base developed just beneath resistance, acting as a launchpad for the breakout. The resolution of this final base in 2024 marks the end of a prolonged consolidation cycle and the beginning of a stronger, sustained uptrend.
Notably, the latest breakout above both horizontal and long-term resistance has triggered fresh momentum. Gold has surged beyond the $4,000 level, driven by strong momentum, confirming that renewed buying interest is now fueling the trend. This breakout emerged after two significant technical moves, one through the handle zone and another above the neckline. Both moves cleared major resistance zones that had capped price action for years. The combination of decisive breakouts and long-term structural compression supports the development of a lasting bullish trend.
Gold Outpaces Dollar as Key Ratio Cracks Below Support
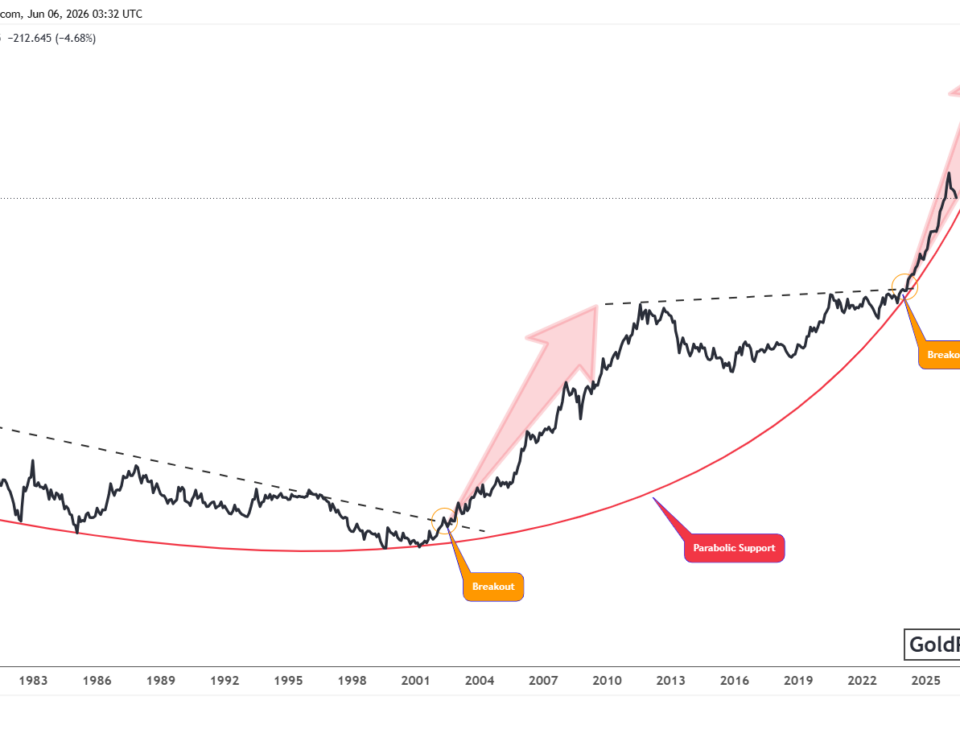
The chart below shows a sharp breakdown in the U.S. Dollar relative to gold, confirming gold’s rising structural dominance. This ratio has broken down from a long-standing wedge pattern that had been forming since 2008. The recent move below key support signals a decisive shift in the Dollar’s relative strength against gold.

Eventually, the ratio made several failed attempts to push higher, gradually forming a long-term descending structure. These repeated rejections led to a slow decline that ultimately resulted in a decisive breakdown in 2024. The breach of support has since triggered a sharp downward move, as highlighted by the red directional arrows. The ratio now trades below key levels, with no clear technical support in sight.
Gold’s sharp outperformance reflects strength not only in nominal terms but also in real terms against fiat currency. The breakdown in the dollar-to-gold ratio highlights weakening purchasing power and declining confidence in fiat systems. Historically, breakdowns of this nature have marked the early stages of major gold bull markets. The combination of a falling ratio and rising gold prices points to a long-term shift toward real assets. This environment signals a broader revaluation of gold’s role as a stable store of value in an increasingly fragile monetary system.
Conclusion: Shift to Hard Assets Accelerates as Gold Breaks Key Levels
Gold has completed a decisive breakout from a decades-long consolidation, resolving a generational cup-and-handle formation and clearing multi-decade resistance. This breakout marks a significant structural shift, indicating that historical price ceilings no longer limit the price of gold. The transition from long-term compression to sustained upward momentum suggests a new phase of strength. With multiple foundational bases now established, gold has entered open territory and moved beyond the technical barriers that contained its price for over 40 years.
At the same time, the U.S. Dollar-to-Gold ratio has broken down from a critical support zone. The failure to maintain this level reflects growing weakness in fiat-based valuations and signals a decline in purchasing power relative to gold. The breakdown also highlights rising macroeconomic stress and declining confidence in traditional monetary systems. It also points to increasing demand for assets that preserve real value. This sharp divergence strengthens gold’s position as a preferred store of value in the current macro environment.
Overall, these developments indicate a structural shift in market preferences, with growing interest in tangible assets, such as gold. As inflation concerns persist and trust in fiat currencies weakens, capital continues to shift toward real assets. Gold’s rising strength, both technically and fundamentally, suggests it is reclaiming its central role in long-term value preservation.
Gold Predictors Premium Membership
Get exclusive short-term and swing trade ideas with precise entry levels, stop-loss, and target prices, including justification and analysis — all delivered directly via WhatsApp.
Our premium service includes deep technical analysis on gold and silver markets. We cover cycle analysis, price forecasting, and key timing levels.
Members also receive a weekly market letter with detailed analysis, commentary from our Chief Analyst, including actionable insights, trade timing, and direction forecasts for gold and silver.
Stay ahead of the market — join our premium community today.
