Gold vs Bitcoin: Is Gold Building Long-Term Strength against Bitcoin?
Gold (XAUUSD) prices remain in a corrective phase after reaching long-term channel resistance. The broader technical structure remains intact despite the ongoing pullback. The current correction also reflects a pattern observed during previous market cycles. At the same time, the Gold-to-Bitcoin ratio has broken above long-term resistance and continues to hold above the breakout level. These developments support a constructive long-term technical outlook for gold despite the current correction.
Gold Technical Analysis: Correction Unfolds Within Long-Term Ascending Channel
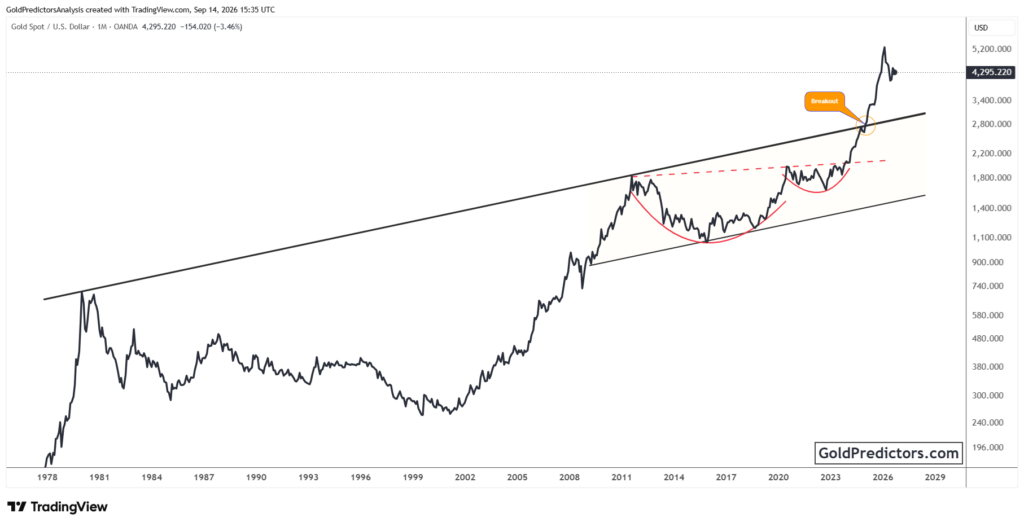
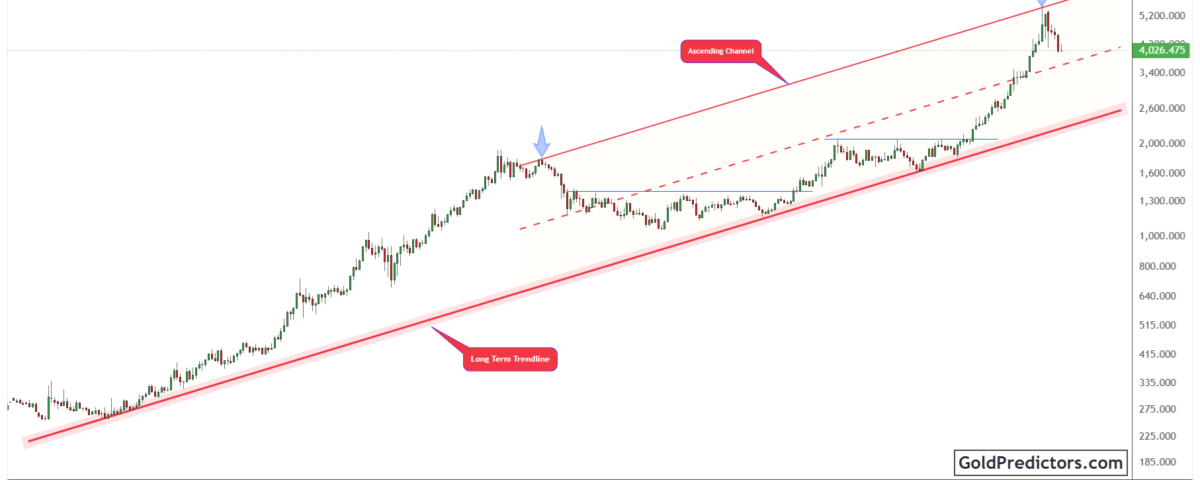
The gold chart below shows a long-term ascending trendline that has guided price action for more than two decades. This trendline has provided support during several major corrections and has helped maintain the broader bullish structure. Every significant decline has remained above this support before the metal resumed its advance. This repeated behavior highlights the strength of the long-term trend and supports a constructive broader outlook.
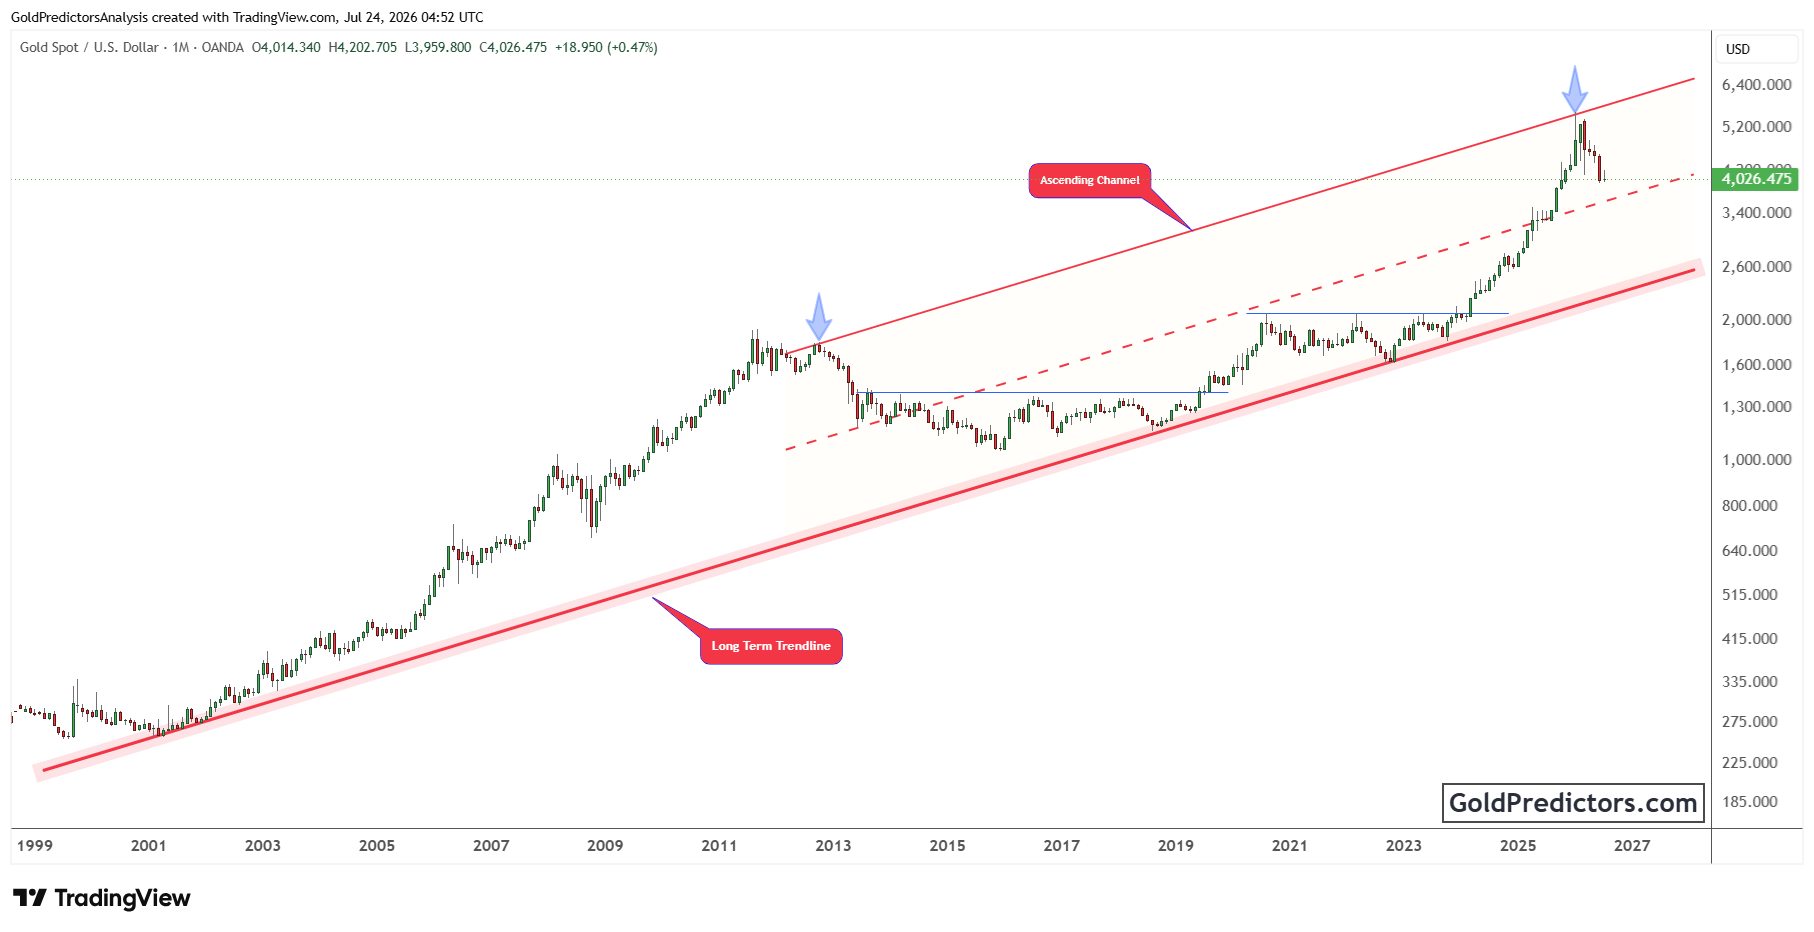
The chart also shows a long-term ascending channel that has guided gold prices over many years. The upper boundary previously acted as resistance and was followed by a corrective phase. The latest rally followed a similar pattern. Price climbed rapidly to the upper boundary and then eased after encountering resistance. The recent decline reflects a normal correction after an extended advance rather than a confirmed reversal of the broader trend.
Gold now trades below the channel’s upper boundary after rejecting resistance. At the same time, it remains within the long-term ascending channel that has guided price across previous market cycles. The current pullback has not altered the broader technical structure. A sustained recovery could eventually allow price to test the channel’s upper boundary again, while a deeper pullback could extend the current corrective phase.
Gold vs Bitcoin Analysis: Ratio Breakout Signals Improving Relative Strength
The chart below shows the Gold-to-Bitcoin ratio, which has remained in a sustained long-term downtrend since 2013. A descending resistance trendline consistently capped recovery attempts, with each rebound failing below this level and keeping the broader bearish structure intact. This persistent weakness reflected Bitcoin’s sustained outperformance relative to gold throughout the previous market cycle.
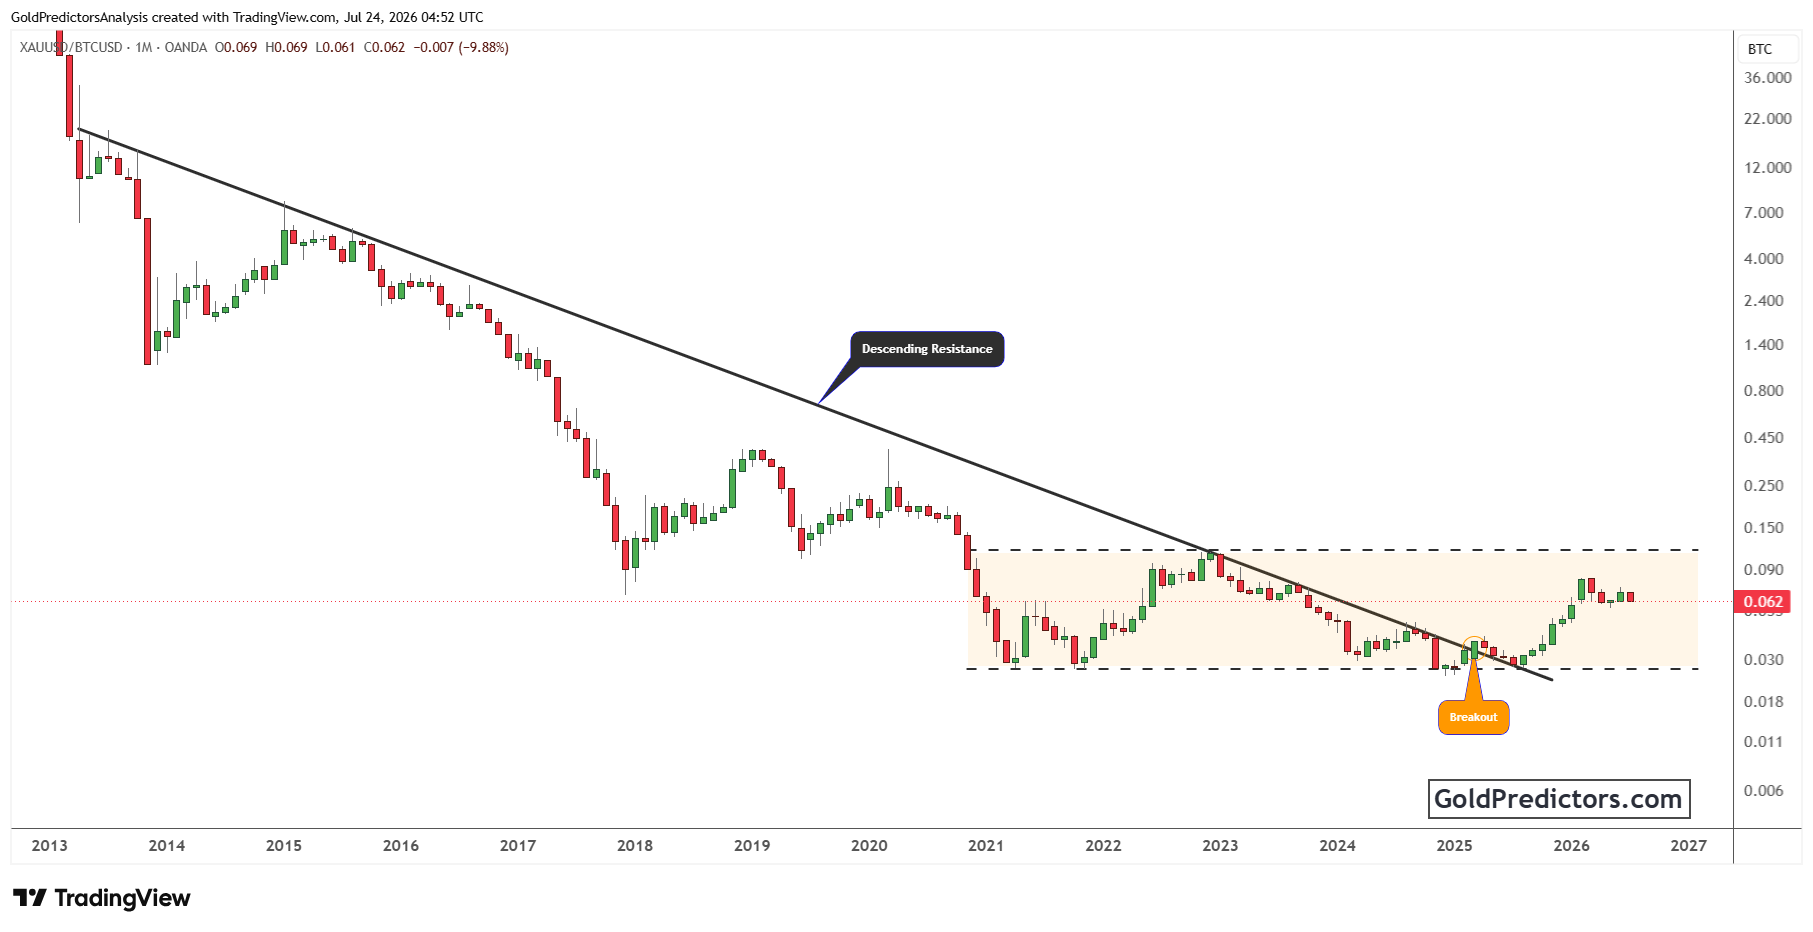
However, the ratio recently moved above this resistance, signaling that the long-term bearish structure has weakened. The breakout ended the multi-year downtrend and indicated a shift in the broader technical outlook. Since then, the ratio has remained within a broad consolidation range instead of falling back below the former resistance. This price action suggests the breakout remains intact as the market establishes a new trading range.
The ratio continues to trade above the former resistance, suggesting that gold has begun to improve its relative performance against Bitcoin. Holding above this breakout level would support the positive shift in the broader technical structure. In contrast, a sustained move back below the breakout zone would weaken the current outlook. For now, price action remains above the breakout level, supporting the broader technical picture.
Gold and Bitcoin Outlook: Correction Unfolds as Gold Improves Relative Strength
Gold prices entered a corrective phase after reaching long-term channel resistance. The broader technical structure continues to hold despite the ongoing pullback. The current correction also follows a pattern seen during previous market cycles. Price continues to trade within the long-term ascending channel, keeping the broader technical outlook constructive.
At the same time, the Gold-to-Bitcoin ratio continues to hold above its long-term breakout level. This breakout signals that gold has started to strengthen relative to Bitcoin after years of underperformance. Holding above the former resistance keeps the broader technical outlook constructive and supports the current trend shift.
These developments continue to support a positive long-term outlook for gold despite the current correction. The ongoing pullback appears consistent with previous market cycles rather than a confirmed trend reversal. A recovery toward channel resistance and continued strength in the Gold-to-Bitcoin ratio would provide further confirmation of the broader technical structure.
Gold Predictors Premium Membership
Get exclusive short-term and swing trade ideas with precise entry levels, stop-loss, and target prices, including justification and analysis — all delivered directly via WhatsApp.
Our premium service includes deep technical analysis on gold and silver markets. We cover cycle analysis, price forecasting, and key timing levels.
Members also receive a weekly market letter with detailed analysis, commentary from our Chief Analyst, including actionable insights, trade timing, and direction forecasts for gold and silver.
Stay ahead of the market — join our premium community today.