


Gold Price Forecast: Structural Breakout Meets Monetary Repricing
Gold (XAUUSD) is entering a powerful new phase in its long-term bull market. The metal has broken above key resistance levels while staying firmly within its decades-long ascending channel. Technical momentum is building, supported by bullish patterns and strong follow-through. At the same time, gold is gaining strength relative to the expanding money supply. These signals point to a broader shift in market behaviour and rising confidence in gold as a long-term store of value.
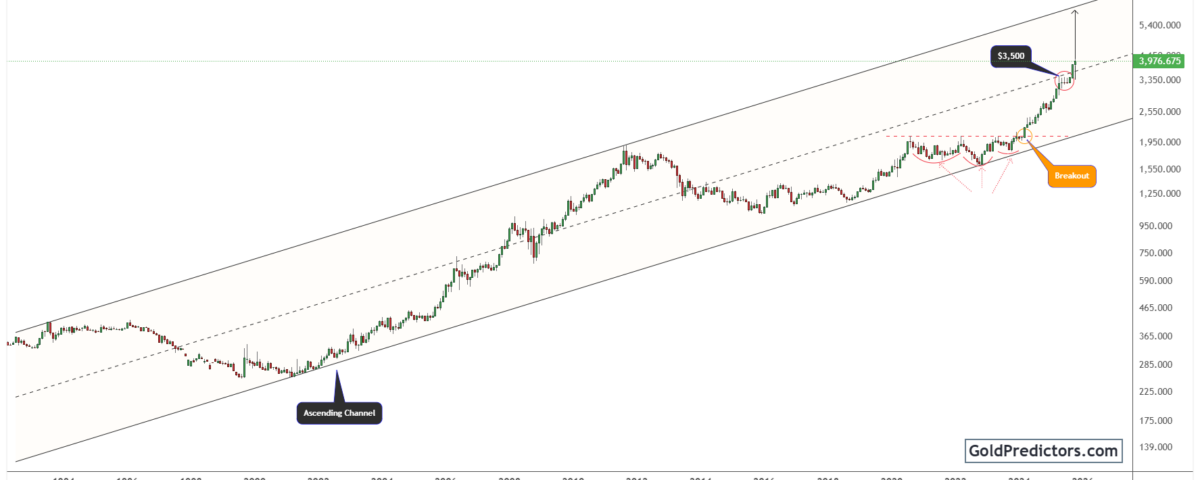
Gold Rally Accelerates Within 30-Year Channel, Signals Long-Term Revaluation
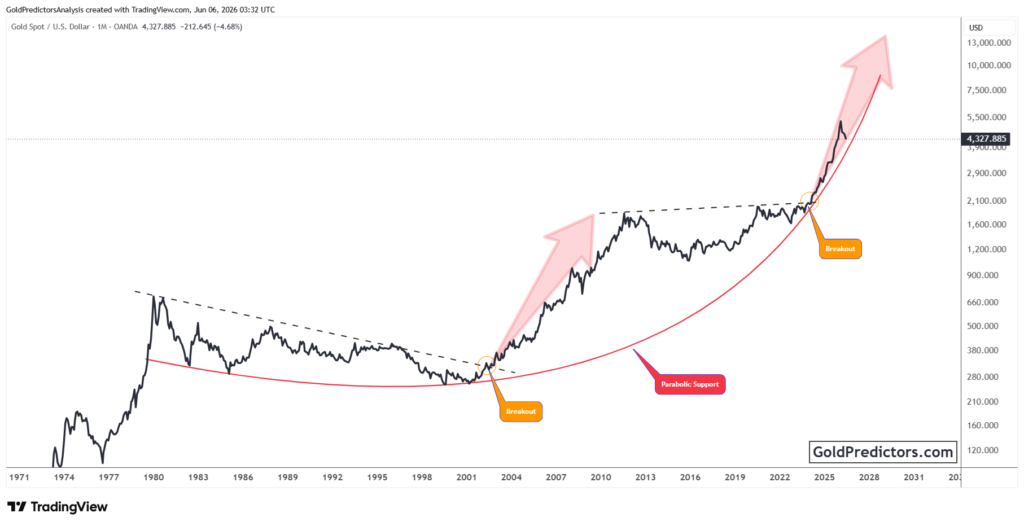
The gold chart below shows a well-defined ascending channel that has guided price action for more than three decades. This channel began forming in the early 1990s and has since served as a guide for gold’s major uptrends and corrections over the decades. Gold has consistently respected the channel boundaries, with each major rally and correction unfolding within this broader rising structure.
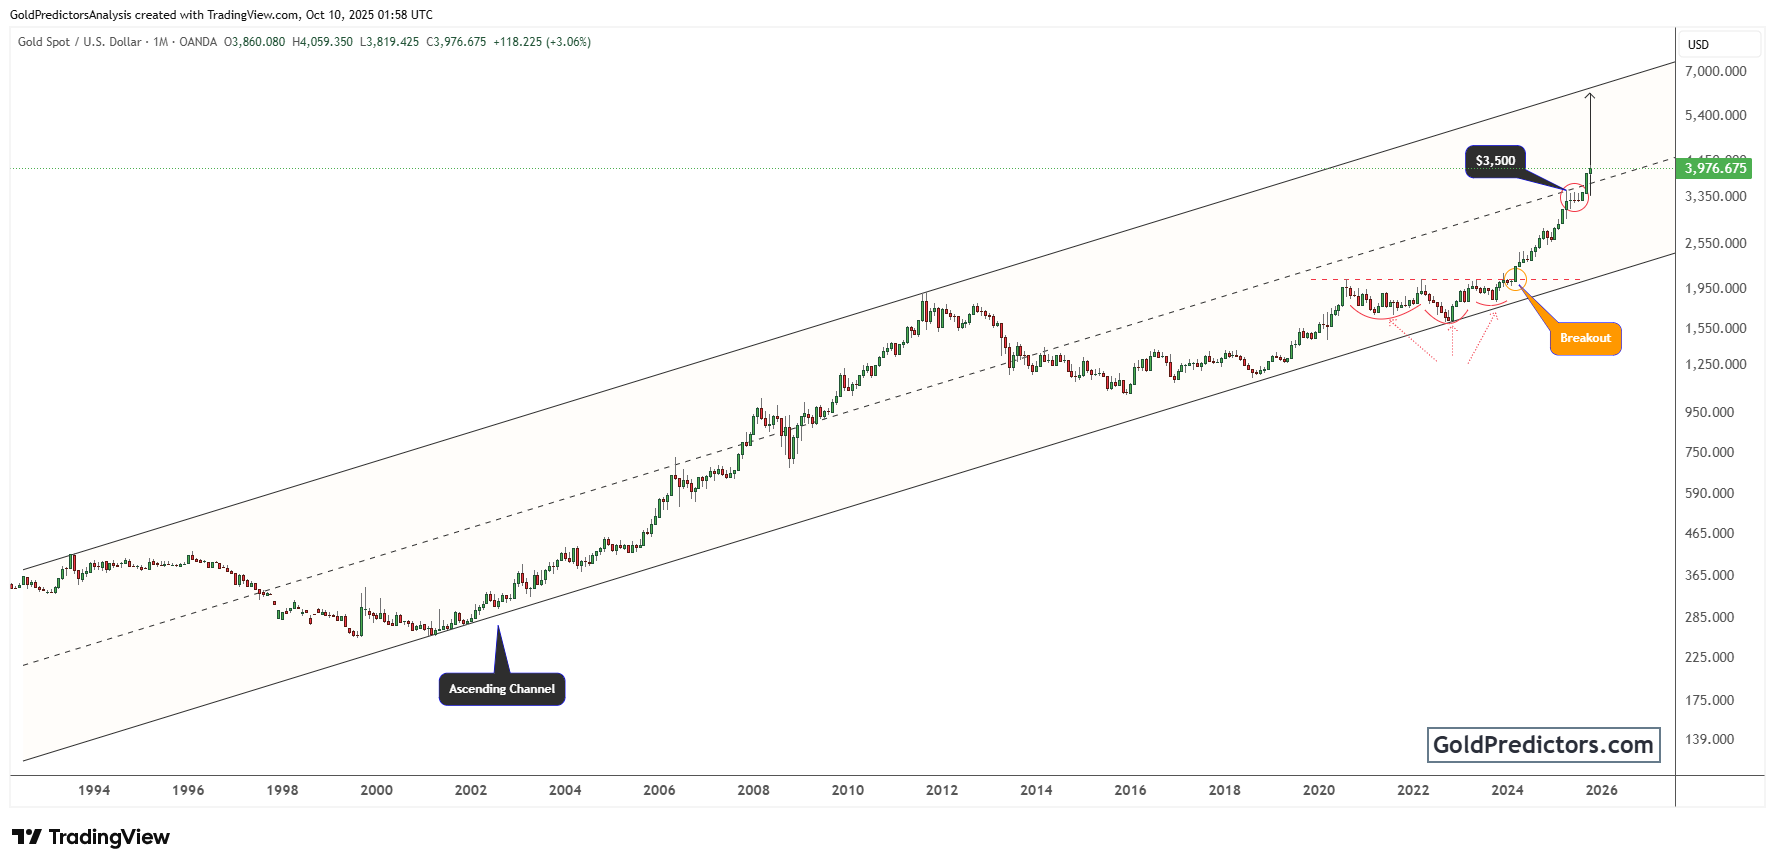
Gold confirmed a major breakout after reclaiming the $2,000 level and pushing decisively above the channel’s midpoint. The breakout gained further strength as the price cleared the $3,500 zone, a key horizontal resistance aligned with the channel’s midline. This alignment of key levels added strong technical validation to the move. The breakout then triggered a sharp increase in momentum, confirming the continuation of the uptrend.
Moreover, the chart shows a clear sequence of bullish continuation setups, beginning with a broad accumulation base and followed by a clean validation of the breakout. These formations reflect sustained buying interest and rising conviction in the prevailing uptrend. With gold now trading above both horizontal resistance and the channel’s midpoint, attention turns to the upper boundary as the next primary technical target. This zone outlines the path toward extended upside potential, with long-term projections reaching above $6,000 zone.
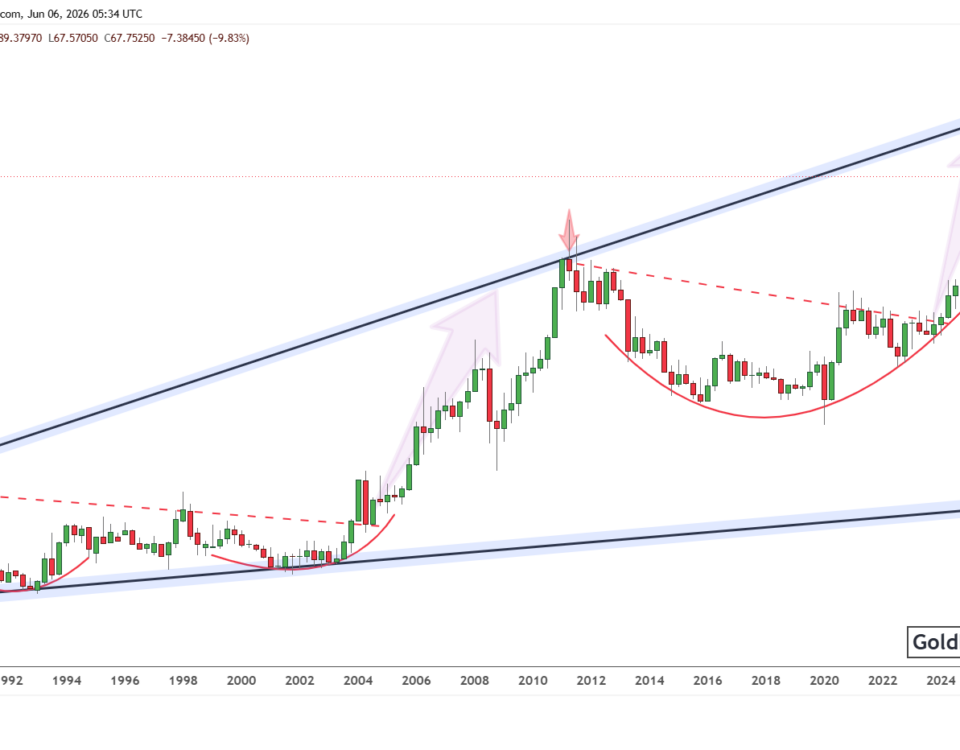
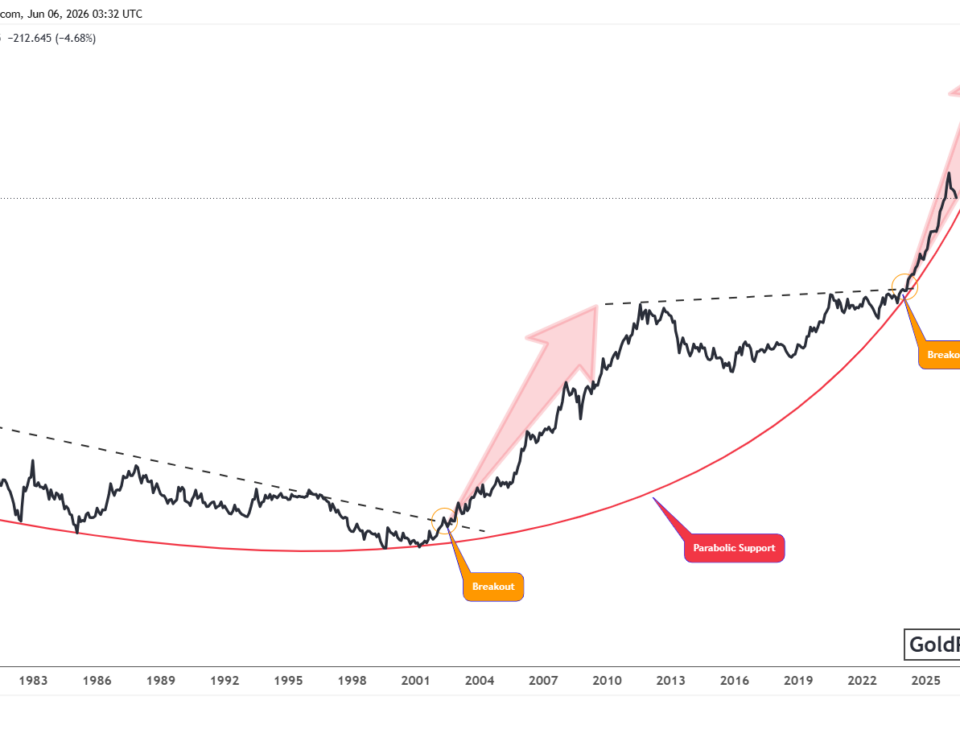
Gold-to-M2 Ratio Breaks Wedge, Signals Hard Asset Rotation
The chart below shows gold’s strength relative to the M2 money supply, providing a unique perspective on how the metal performs against monetary expansion. After peaking in 1980, the ratio entered a multi-decade downtrend, carving out a large falling wedge pattern. Following an extended period of compression, the ratio has started to break higher, pointing to a potential change in the broader monetary landscape.

Notably, the wedge formation contains two distinct rounded bases formed during extended consolidation periods. These formations indicate long-term buying interest and structural strength, despite the backdrop of rising money supply. The recent breakout above the wedge’s upper boundary signals a significant structural shift. Gold is now growing not only in nominal terms but also gaining real value relative to the expanding U.S. dollar supply.
Currently, the ratio is approaching the 0.20 level, which served as a significant resistance point during a prior peak in gold’s relative strength. A confirmed move above this zone would signal a stronger monetary revaluation in gold’s favor. This change may indicate weakening confidence in fiat currencies and growing interest in inflation-protected assets. It could also point to a larger movement of capital from paper-based instruments into gold.
Gold Outlook: Breakout Aligns with Macro Tailwinds, Signals Structural Repricing
Gold continues to show strength across technical and macroeconomic indicators. The breakout inside the multi-decade channel reflects accelerating momentum within the broader bullish structure. Technical formations, including consolidation bases and retest signals, confirm the strength of the upward setup. As gold maintains its position above critical resistance, the upper range of the channel becomes the next logical target, projecting potential gains toward $6,500 or higher.
At the same time, gold’s performance relative to the M2 money supply signals a deeper monetary shift. The breakout from the falling wedge in the gold-to-M2 ratio highlights growing demand for real assets in an era of expanding liquidity. Gold is not only rising in nominal terms but also regaining value against the U.S. dollar supply, signaling a potential revaluation of its role in the monetary system.
Overall, these technical patterns signal a broader shift driving gold’s long-term revaluation in the face of macroeconomic instability. Concerns about fiat currency stability, persistent inflation risks, and rising demand for hard assets are driving capital into gold. This sustained flow of capital highlights gold’s role as a reliable store of value in an increasingly unstable environment.
Gold Predictors Premium Membership
Get exclusive short-term and swing trade ideas with precise entry levels, stop-loss, and target prices, including justification and analysis — all delivered directly via WhatsApp.
Our premium service includes deep technical analysis on gold and silver markets. We cover cycle analysis, price forecasting, and key timing levels.
Members also receive a weekly market letter with detailed analysis, commentary from our Chief Analyst, including actionable insights, trade timing, and direction forecasts for gold and silver.
Stay ahead of the market — join our premium community today.
