


Gold Price Breakout: Major Decade‑Long Channel Breach Points to $5,000 Target
Gold (XAUUSD) has broken out of a decade-long ascending channel, confirming a powerful shift from slow structural buildup to aggressive upward momentum. This breakout follows the formation of an inverted head and shoulders pattern and marks the beginning of a steep rally phase. With price now above long-standing resistance and approaching key extension zones, gold is trading in open territory.
At the same time, the gold-to-platinum ratio has held firm above critical support, signaling continued leadership for gold across the precious metals space. These developments point to a clear shift into a stronger, more accelerated phase.
Gold Breaks Out of Decade-Long Channel with Sharp Move toward $5,000
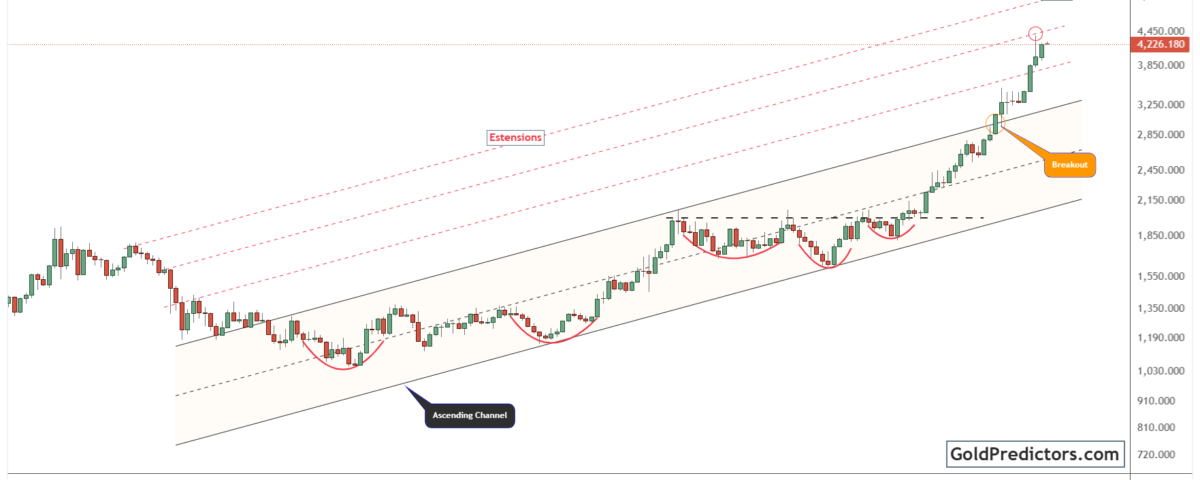
The gold chart below shows a decisive breakout from a long-term ascending channel. This channel guided price action for over a decade, serving as both dynamic support and resistance. Within this structure, gold formed several rounded base patterns, each setting the stage for renewed upward momentum. The price moved steadily higher between 2019 and 2021, remaining within the boundaries of the channel.

Following a prolonged consolidation, gold formed an inverted head and shoulders pattern. The breakout began as the price moved decisively above the neckline, confirming a major structural shift. Momentum accelerated quickly, launching gold into a steep rally phase. As the rally continued, the price moved through key resistance levels and approached the upper red-marked extension zones. These extensions represent the next resistance levels, with the $5,000 region standing out as a key technical and psychological objective.
Gold is moving higher with strength and now faces limited overhead resistance. This price behavior reflects a clean transition from gradual buildup to rapid breakout momentum. With price trading above long-standing levels, the breakout has converted former resistance into a firm support base. This shift leaves gold well-positioned to move toward higher extension targets.
Gold-to-Platinum Ratio Stabilizes Above Key Support, Confirming Bullish Gold Outlook
The chart below shows the gold-to-platinum ratio, highlighting key shifts in relative strength across precious metals. The structure shows a broadening formation that began in 2014, defined by higher highs and wider price ranges. During this period, gold consistently outperformed platinum, as seen in the upward-sloping trend line and successive higher highs. The ratio peaked above 3.5 before pulling back sharply, signaling a potential shift in the relative momentum.
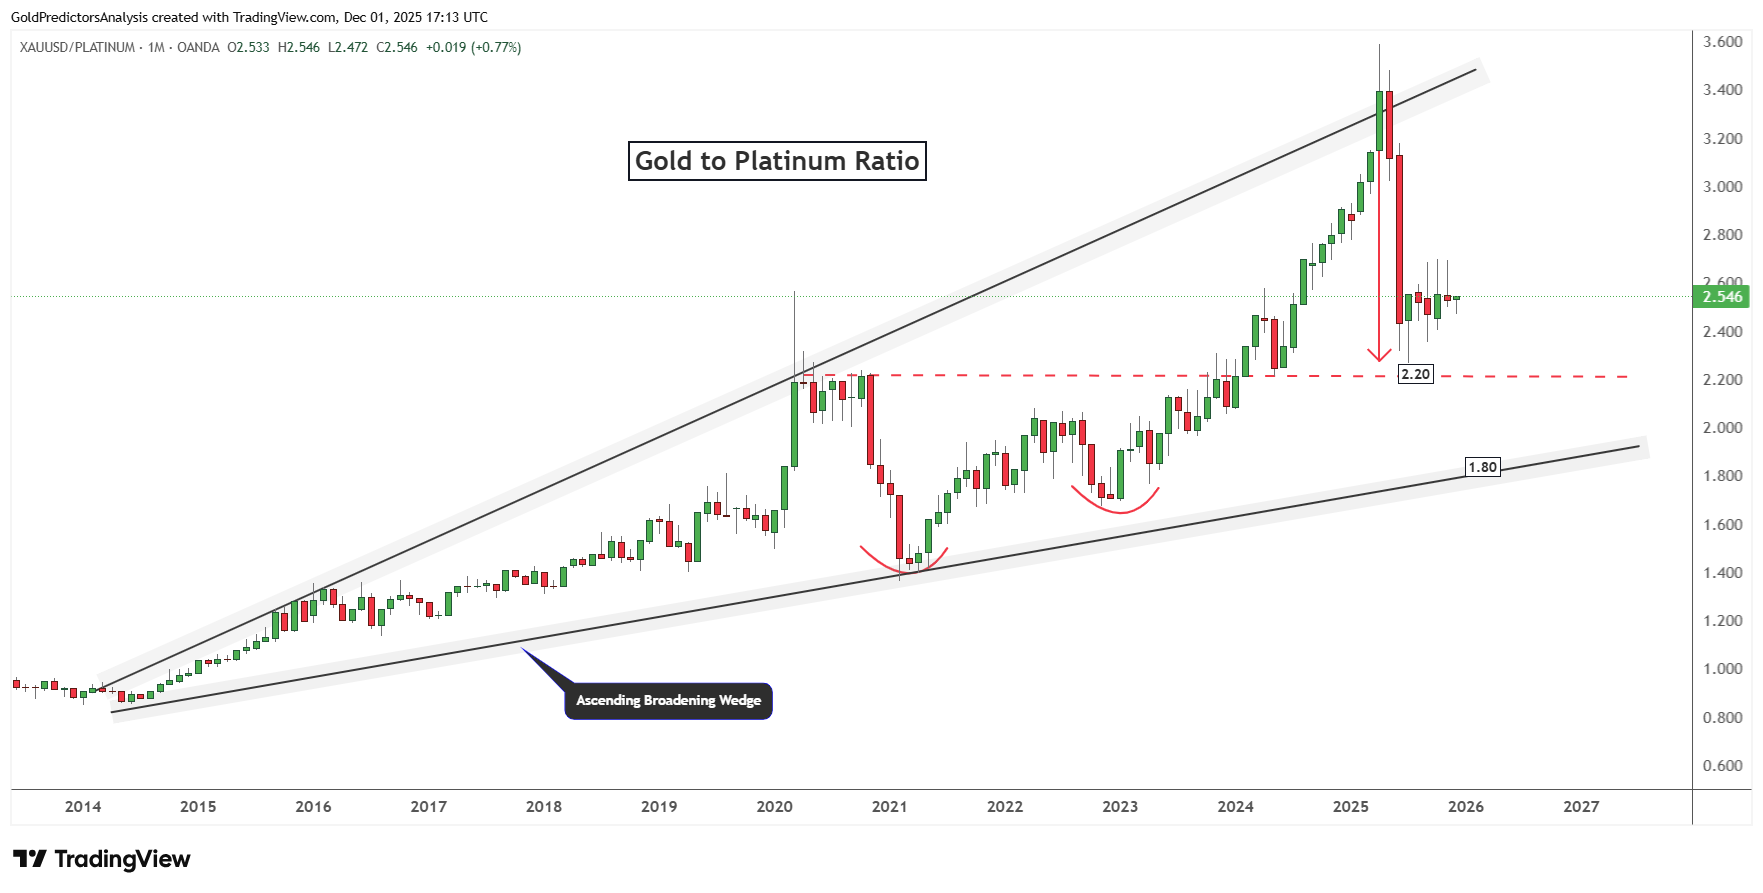
Following the sharp decline, support emerged near 2.20, which had served as a key breakout point. This horizontal level acted as resistance during a prolonged consolidation phase, with price holding beneath it for several months. After a brief dip, the ratio recovered and now trades near a key level. The recovery supports the ongoing bullish structure and highlights continued long-term momentum.
Moreover, the chart shows several mini rounded bottoms within the wedge, each forming before strong upward moves. As long as the ratio holds above 2.20, gold remains in a position of leadership relative to platinum. If the current rebound continues, the upper boundary of the wedge could come back into play. A breakout above this zone would confirm gold’s continued strength across the precious metals complex.
Conclusion: Gold Holds Momentum, Targets Higher Extension Zones
Gold remains in a strong technical position following its breakout from a decade-long channel. This move confirms a shift from long-term consolidation to sustained upside acceleration. The breakout not only cleared major resistance levels but also converted them into firm support, indicating that gold’s structural uptrend is well intact.
At the same time, the gold-to-platinum ratio remains above key support near 2.20, maintaining its broader bullish structure. While the recent rebound has been modest, the stability above this level signals ongoing relative strength in gold. If the ratio builds on this base, it could bring the upper boundary of the broadening wedge back into focus.
Overall, these developments suggest that gold could continue to target higher extension zones while maintaining its leadership across the metals space. With both nominal price action and the gold-to-platinum ratio aligned, the broader outlook remains firmly bullish. As momentum builds, gold appears set to enter a new phase of long-term strength.
Gold Predictors Premium Membership
Get exclusive short-term and swing trade ideas with precise entry levels, stop-loss, and target prices, including justification and analysis — all delivered directly via WhatsApp.
Our premium service includes deep technical analysis on gold and silver markets. We cover cycle analysis, price forecasting, and key timing levels.
Members also receive a weekly market letter with detailed analysis, commentary from our Chief Analyst, including actionable insights, trade timing, and direction forecasts for gold and silver.
Stay ahead of the market — join our premium community today.


