


Gold Next Way
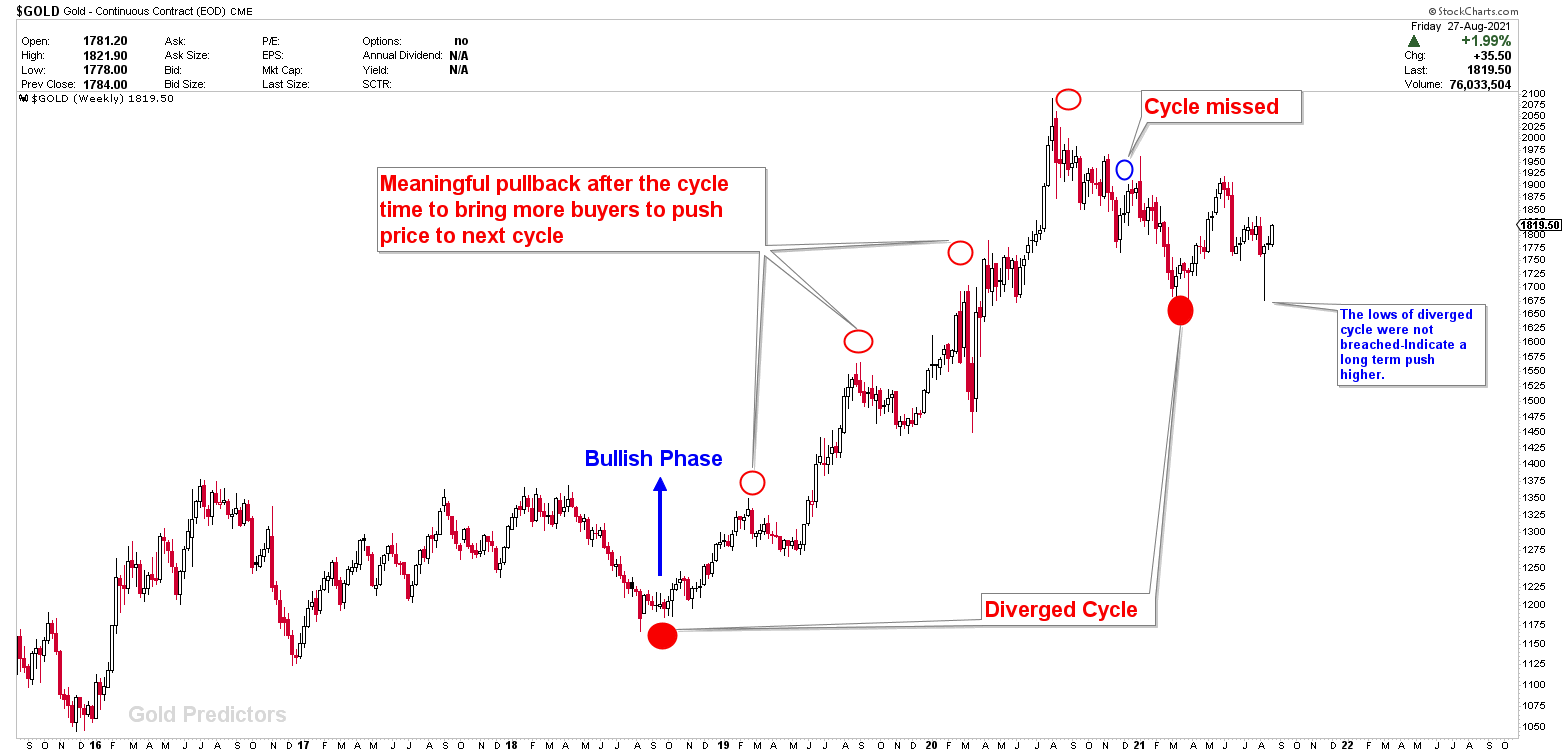
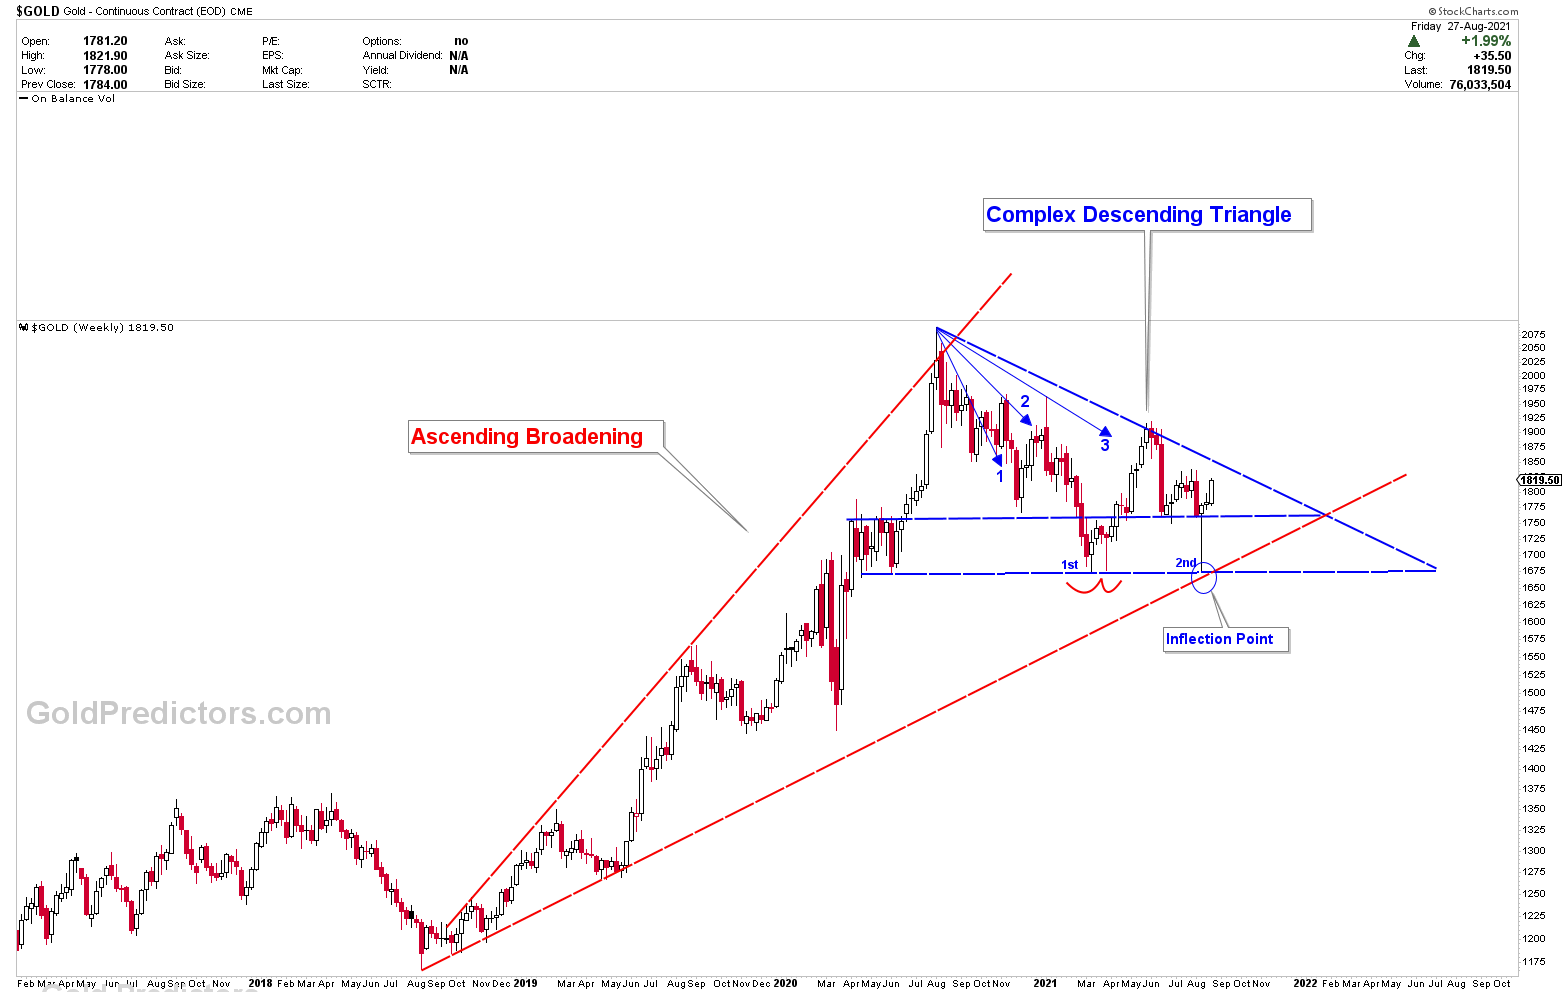
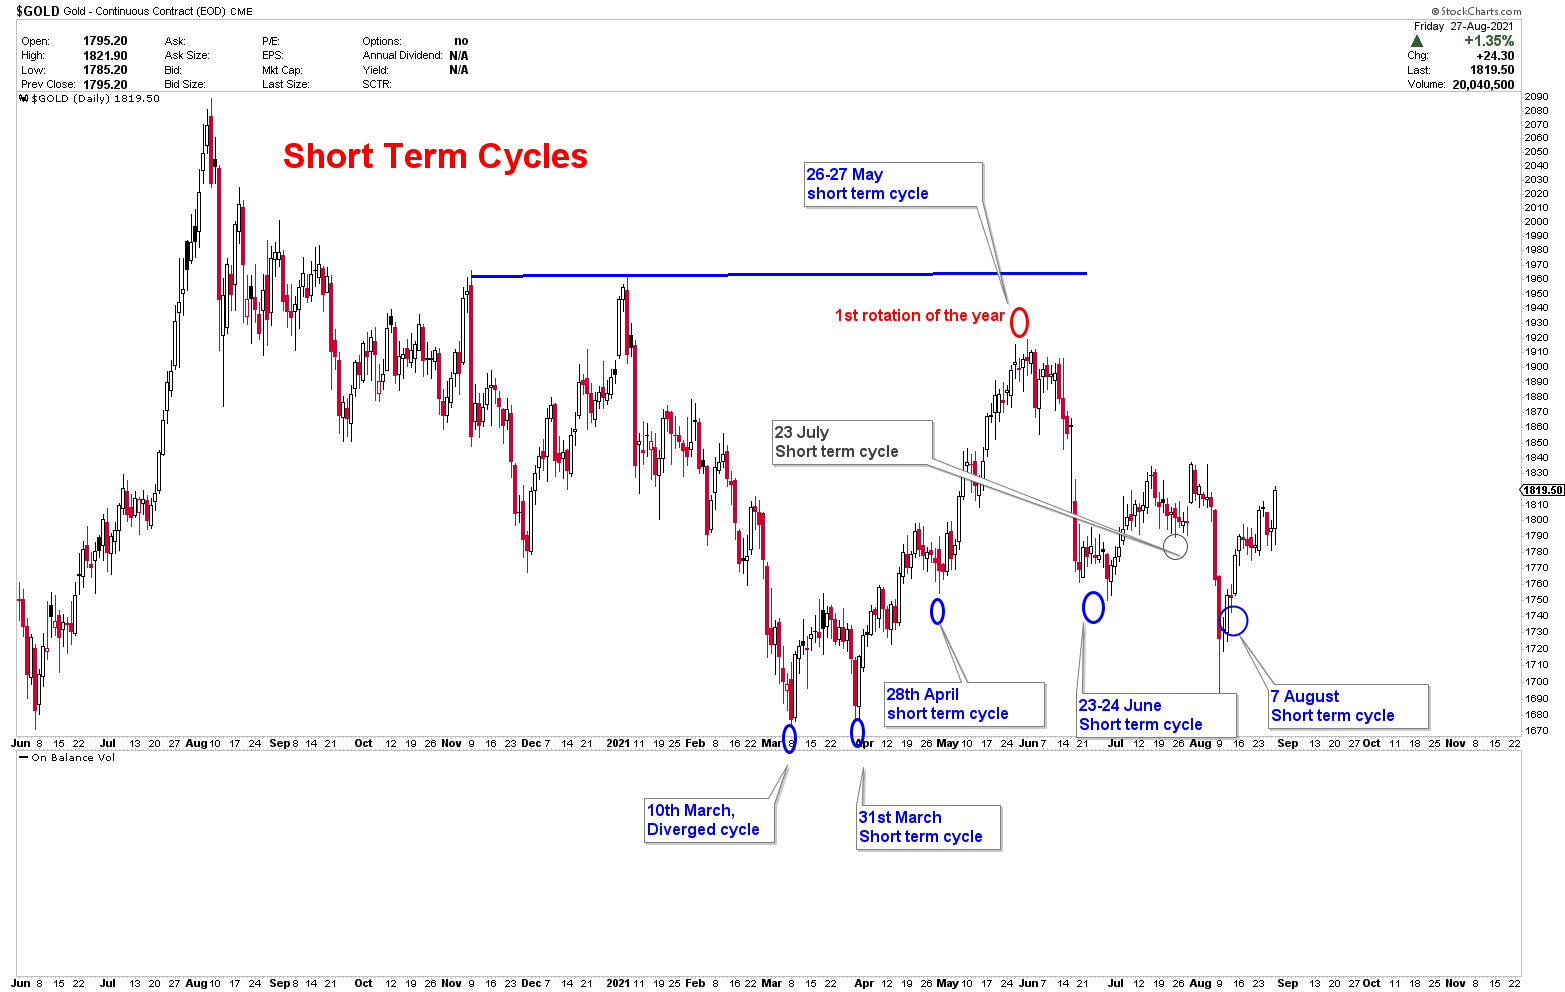
For the past few months, we have been anticipating the gold next way to develop at the inflection point. The inflection point of $1,675-$1,680 was identified in March 2021. The March lows, which developed on our identified diverged cycle, took gold to $1,915. Another drop to $1,680 inflection took place after $1,915 resistance. The drop to $1,680 did not break the diverged cycle’s lows. And a sharp reversal above $1,765 produced a sharp bottom with high volatility. The chart below shows that diverging cycle emerge every few years.
The diverged cycle occurs when the periods of the short-term cycle, medium-term cycle, and long-term cycle collide. Where a bottom is formed, taking prices significantly higher. The unique feature of this cycle is that after the lows are formed, prices exhibit extremely wide ranges for a few months before moving to much higher levels. Prices are currently moving in the $1,700-$1,900 range, and any break in this would send gold to new highs, regardless of what other analysts predict.
Inflection Point & Gold Next Way
The chart shows where the bullish forces began. The premium members understand the meaning of quick reversal. As we discuss many other aspects of the prices with the levels of entries and exits. The inflection point at $1,680 also coincided with a retest of the descending broadening wedge. This is where a kick in the price sent gold higher.
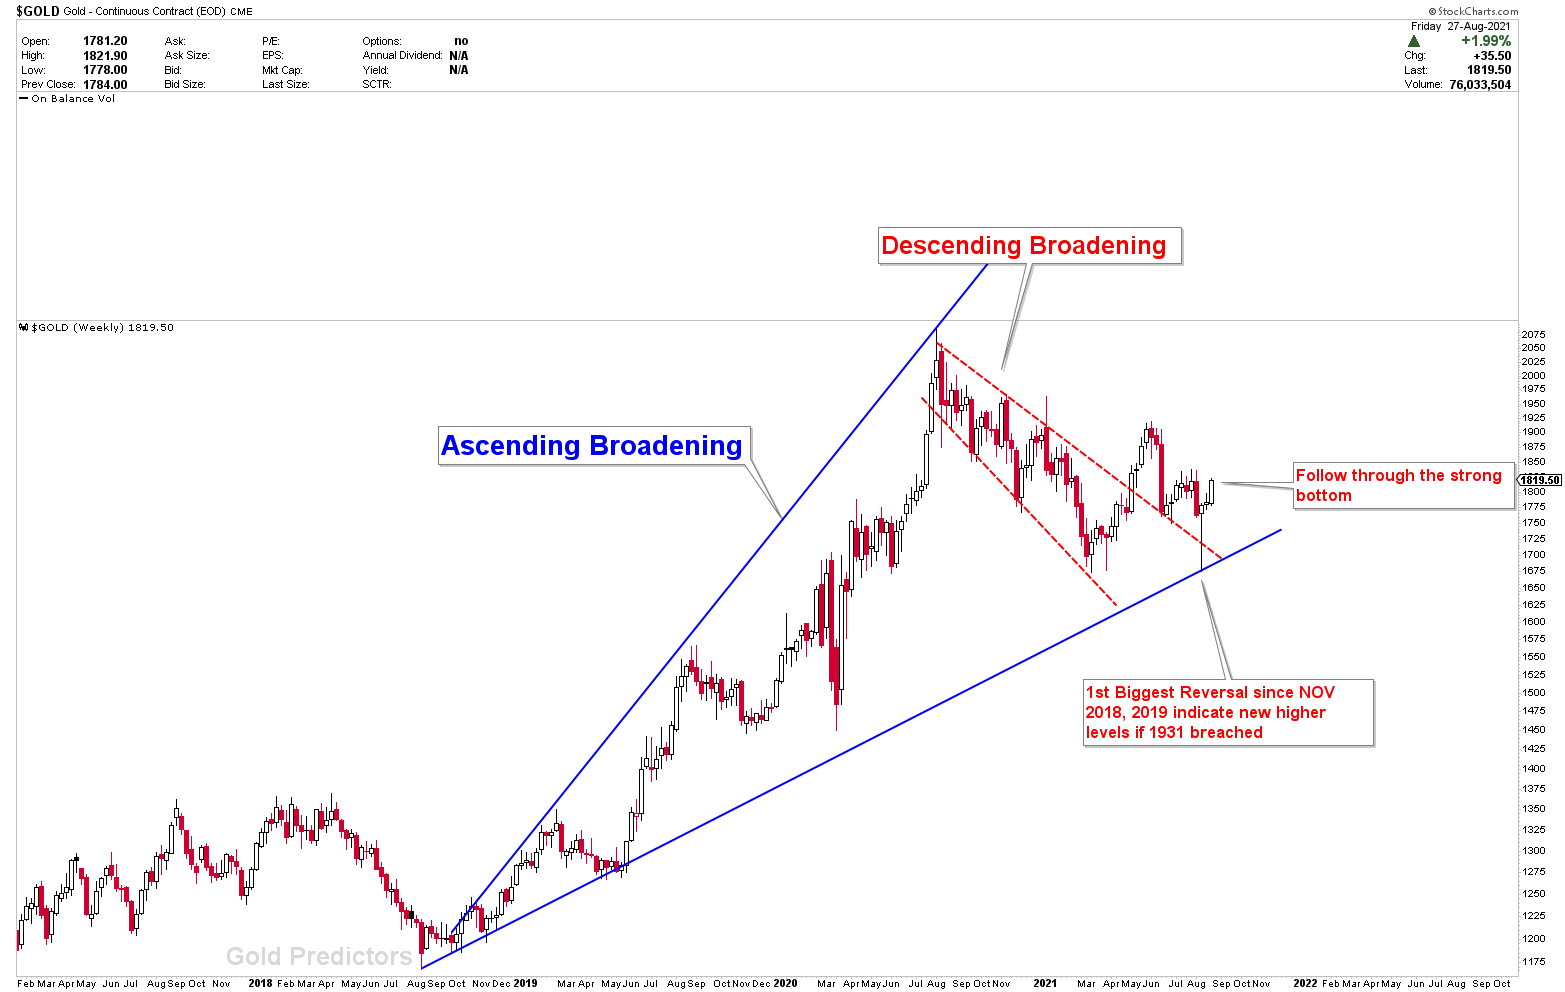
Another chart that demonstrates the complexity of wide ranges and why the bottom has yet to be confirmed. The premium article will go over a detailed explanation of the charts with important levels.
Gold Short-Term Cycles
We’ve been discussing with premium members about key dates where the bottom is likely to fall. So far, all of the dates have yielded 95% accurate results. On August 7th, we recognised the start of the next short-term cycle. Because the 7th of August was a holiday, the bottom was at $1,680 when the markets reopened on Monday. Our special team calculates all of the short-term cycles, medium-term cycles, and diverged cycles using a deep algorithm. We will determine the next short-term cycle for premium members, as well as when the markets are likely to reach a bottom or a peak.
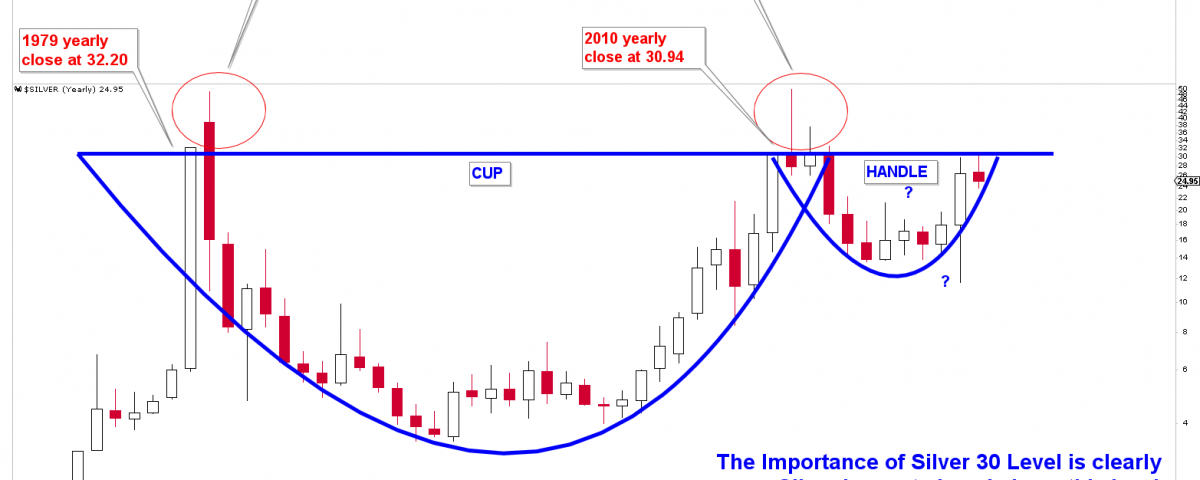
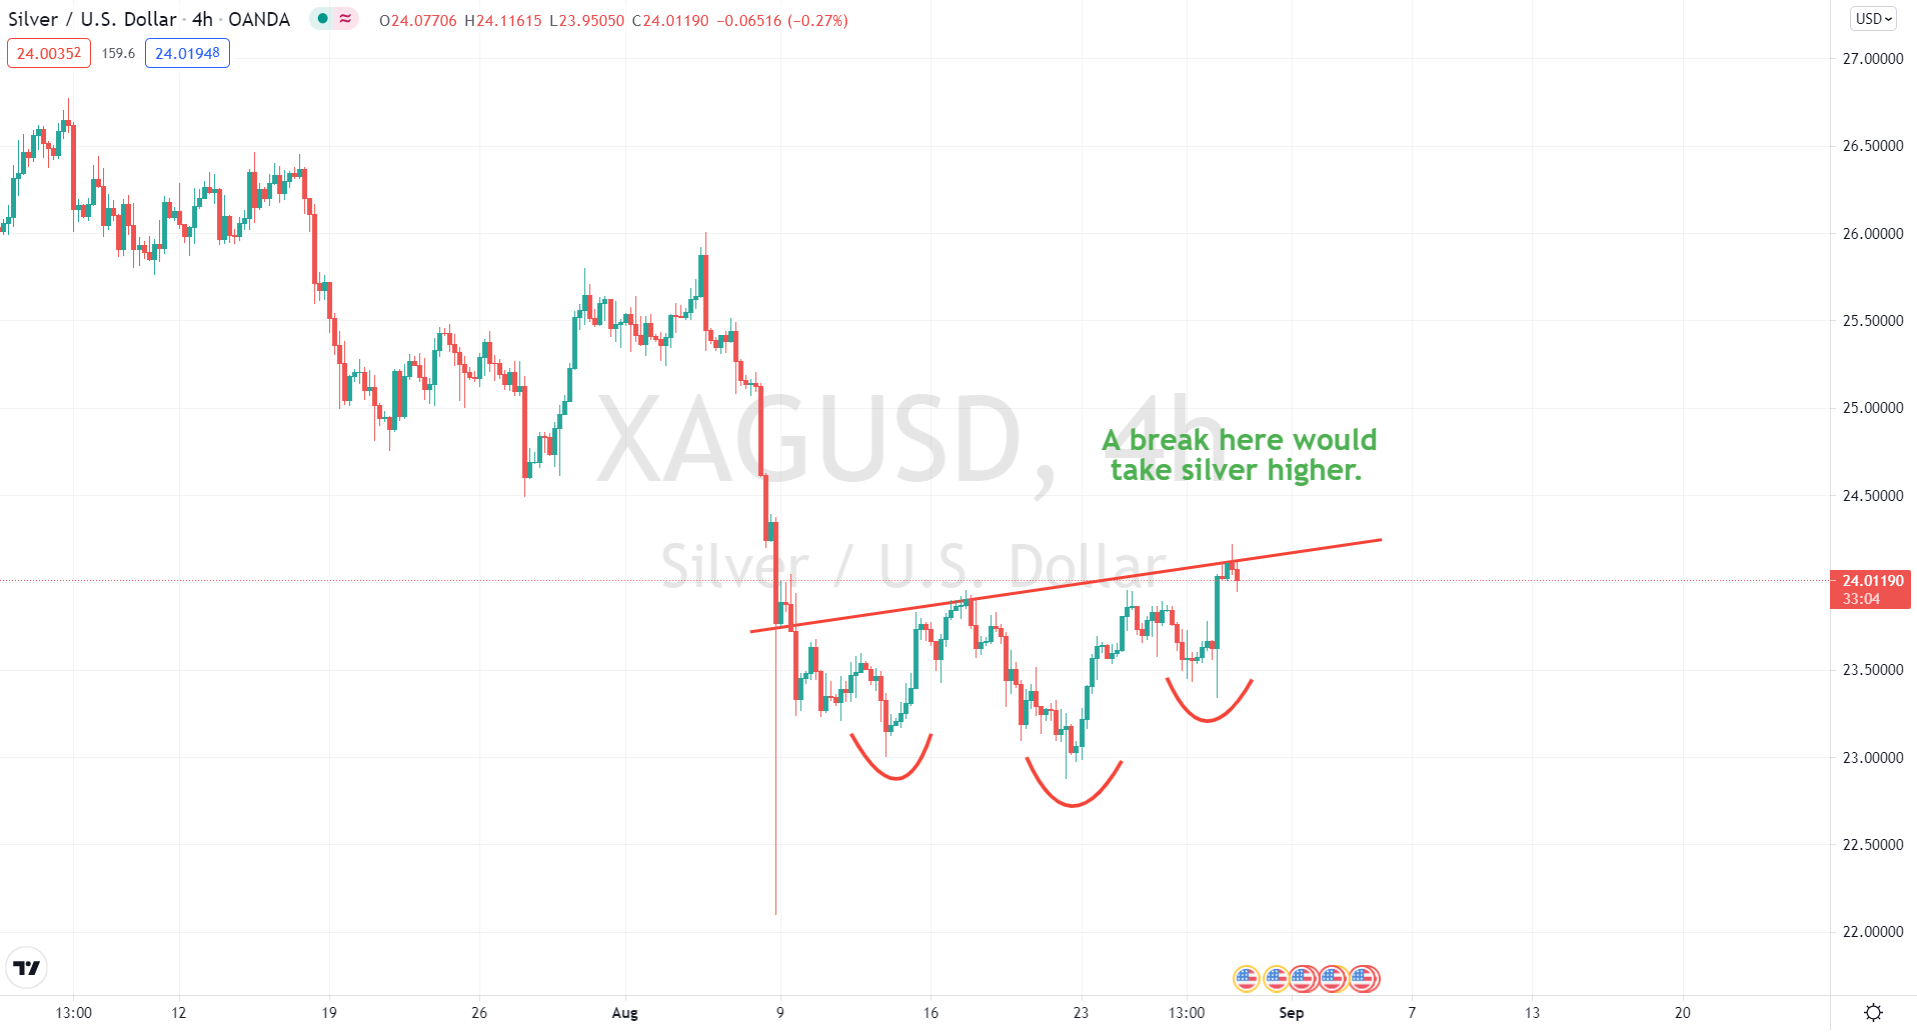
Silver Short Term Development
We identified an inverted head and shoulders in silver where prices need to produce resistance at the neck line. Prices are likely to follow this barrier before the next move because resistance was formed at the defined levels.
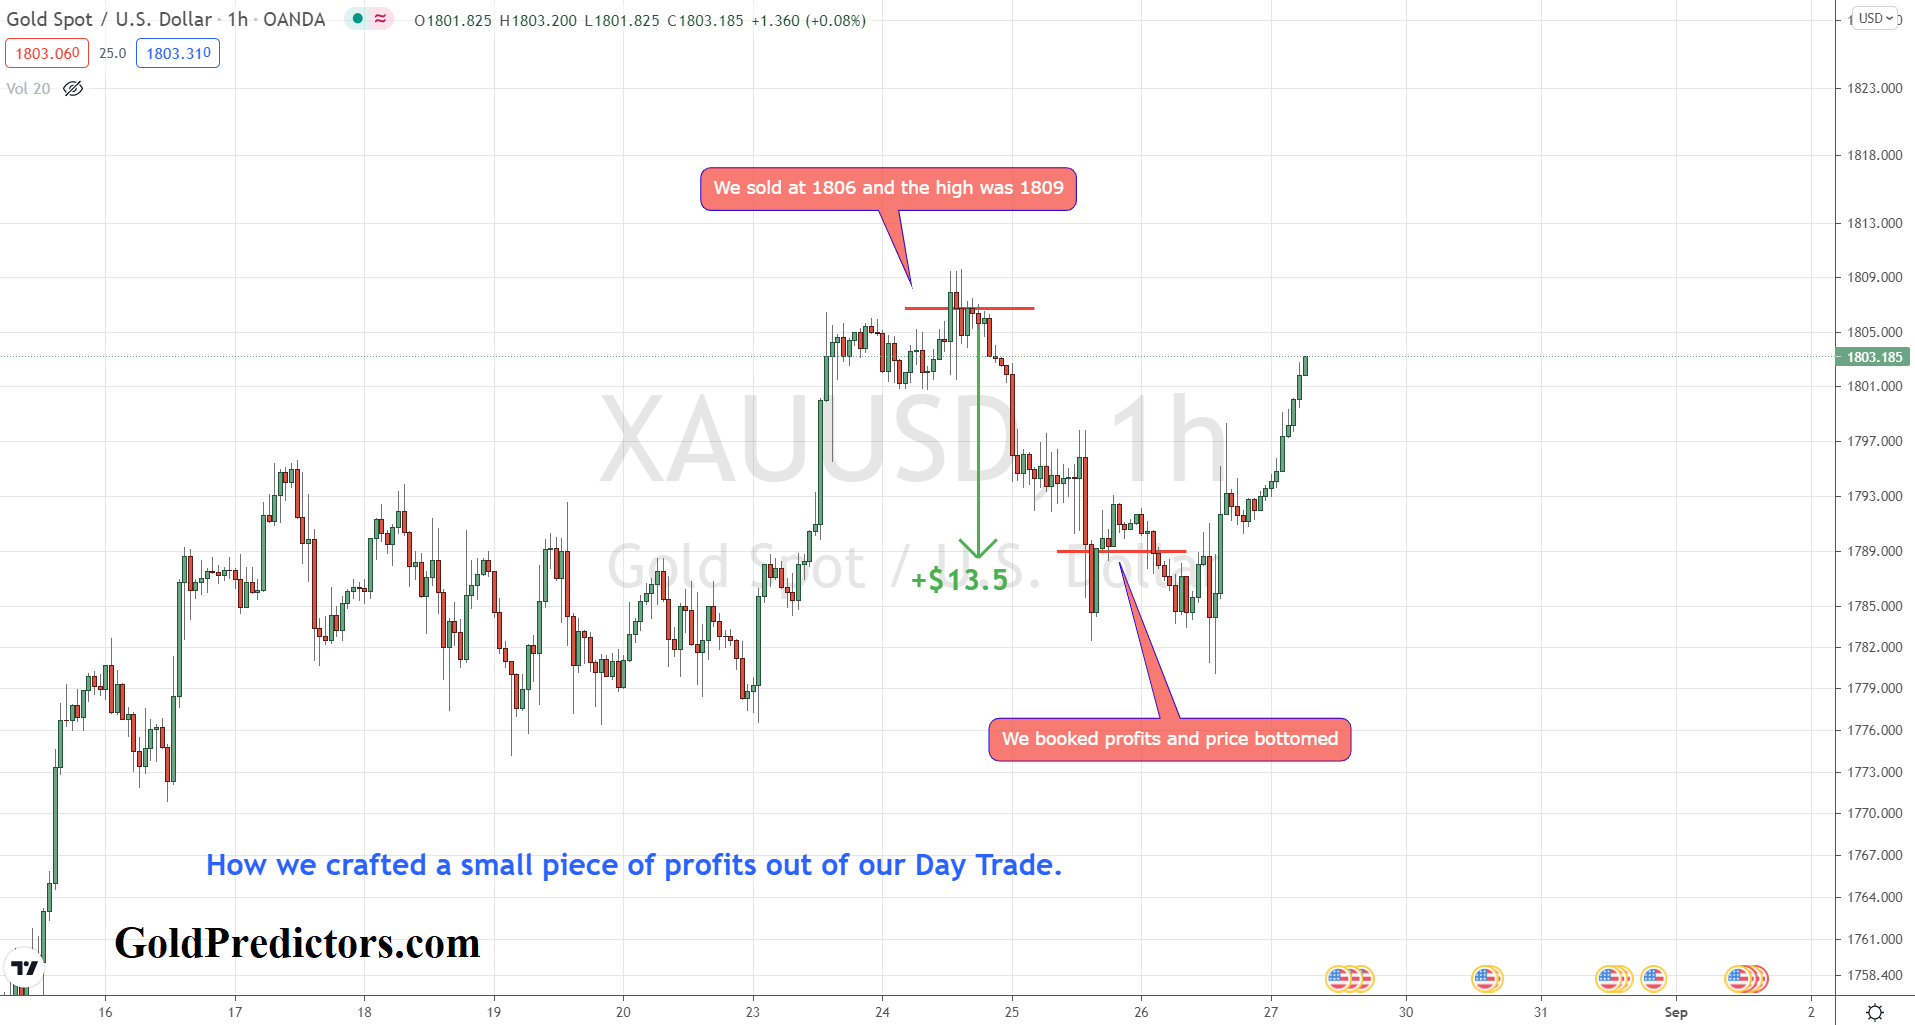
How to Trade Gold Swings?
Due to large swings in both directions, short-term trading in the commodity and forex markets has become extremely risky. However, we chose a sweet trade, which was delivered to our premium members via WhatsApp message. When we sold, the price dropped, but when we booked profits, it shot up. The profits were small, but the opportunity to pick a small piece of trade in a bullish market was fantastic. We are looking for more entries because a healthy environment for both metals is about to develop soon. We like to enter conservatively to pick big moves.
To receive Free Updates, Please Register as a Free Member


