Gold Breakout and Dollar Decline: Why Gold Could Rally Toward $6,000

Gold has entered a new phase of its bullish cycle, supported by technical breakouts and a weakening US dollar. The technical charts show significant changes in long-term trends. Investors and traders should pay close attention to these signals, which may indicate where the gold market is heading next. This article explores the historical resistance breakout in gold prices and the ongoing decline of the U.S. dollar compared to gold. These factors offer compelling insights into future price movements.
Gold Breakout Above Decades-Long Resistance Signals Start of Multi-Year Bull Market
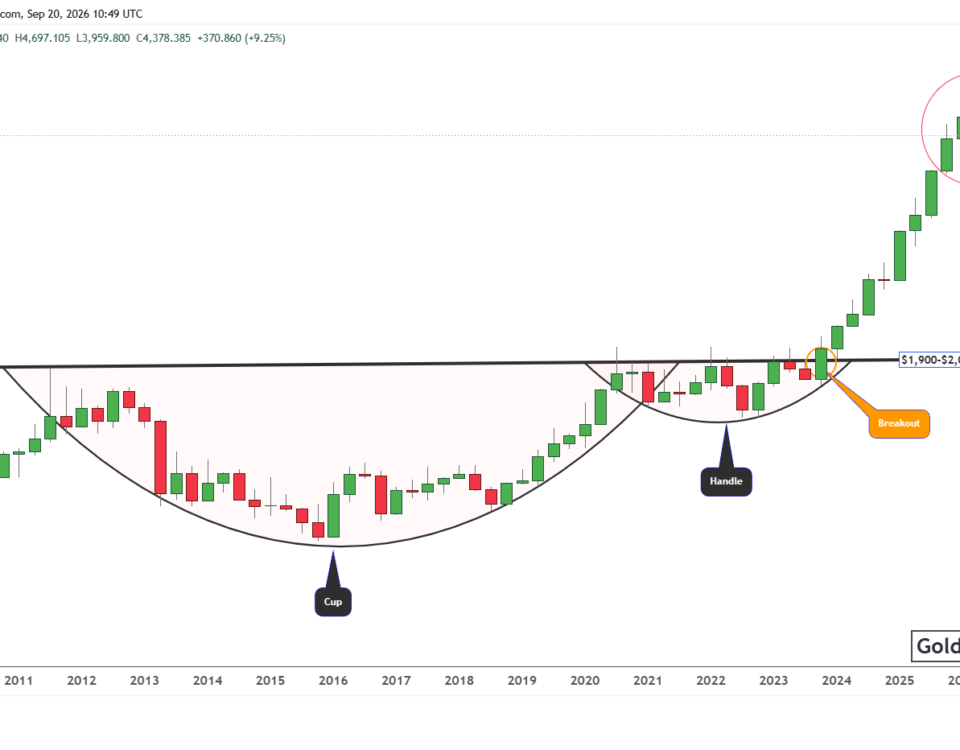
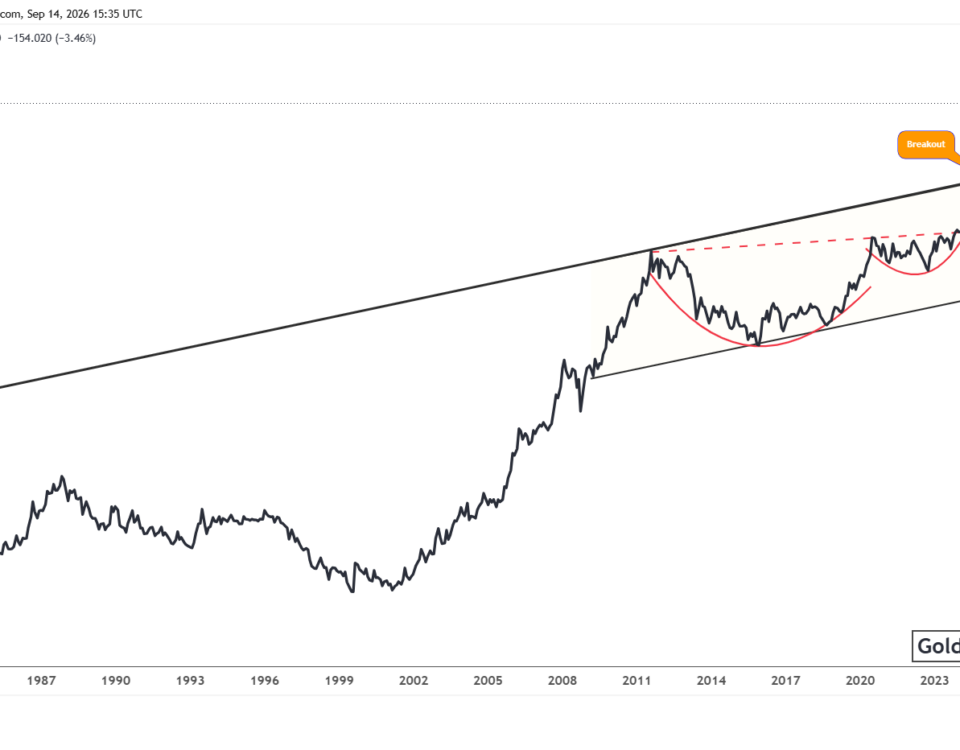
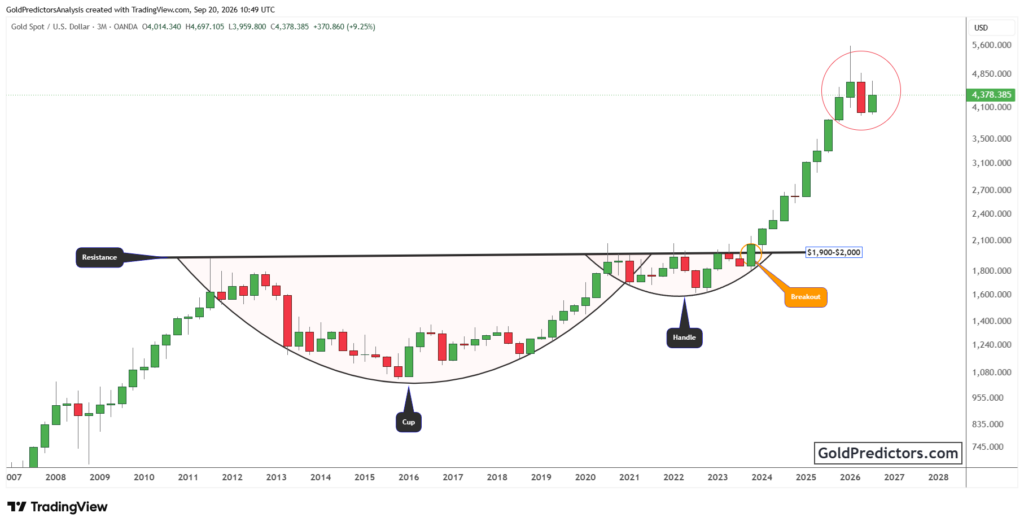
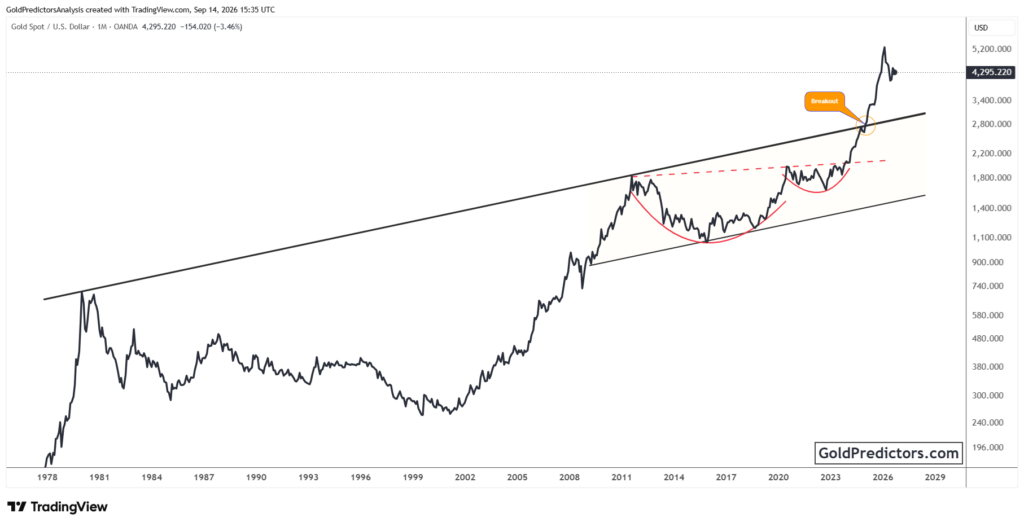
The gold chart below shows price movement over several decades, revealing key historical trends and primary breakout levels from 1971 to 2025. The gold price faced resistance from a key trend line for decades, starting from the 1980 peak. This resistance line capped gold’s upward movement several times over the years. However, gold has now broken out decisively above this line. The breakout occurred after a prolonged cup-and-handle pattern, a strong bullish signal in technical analysis.
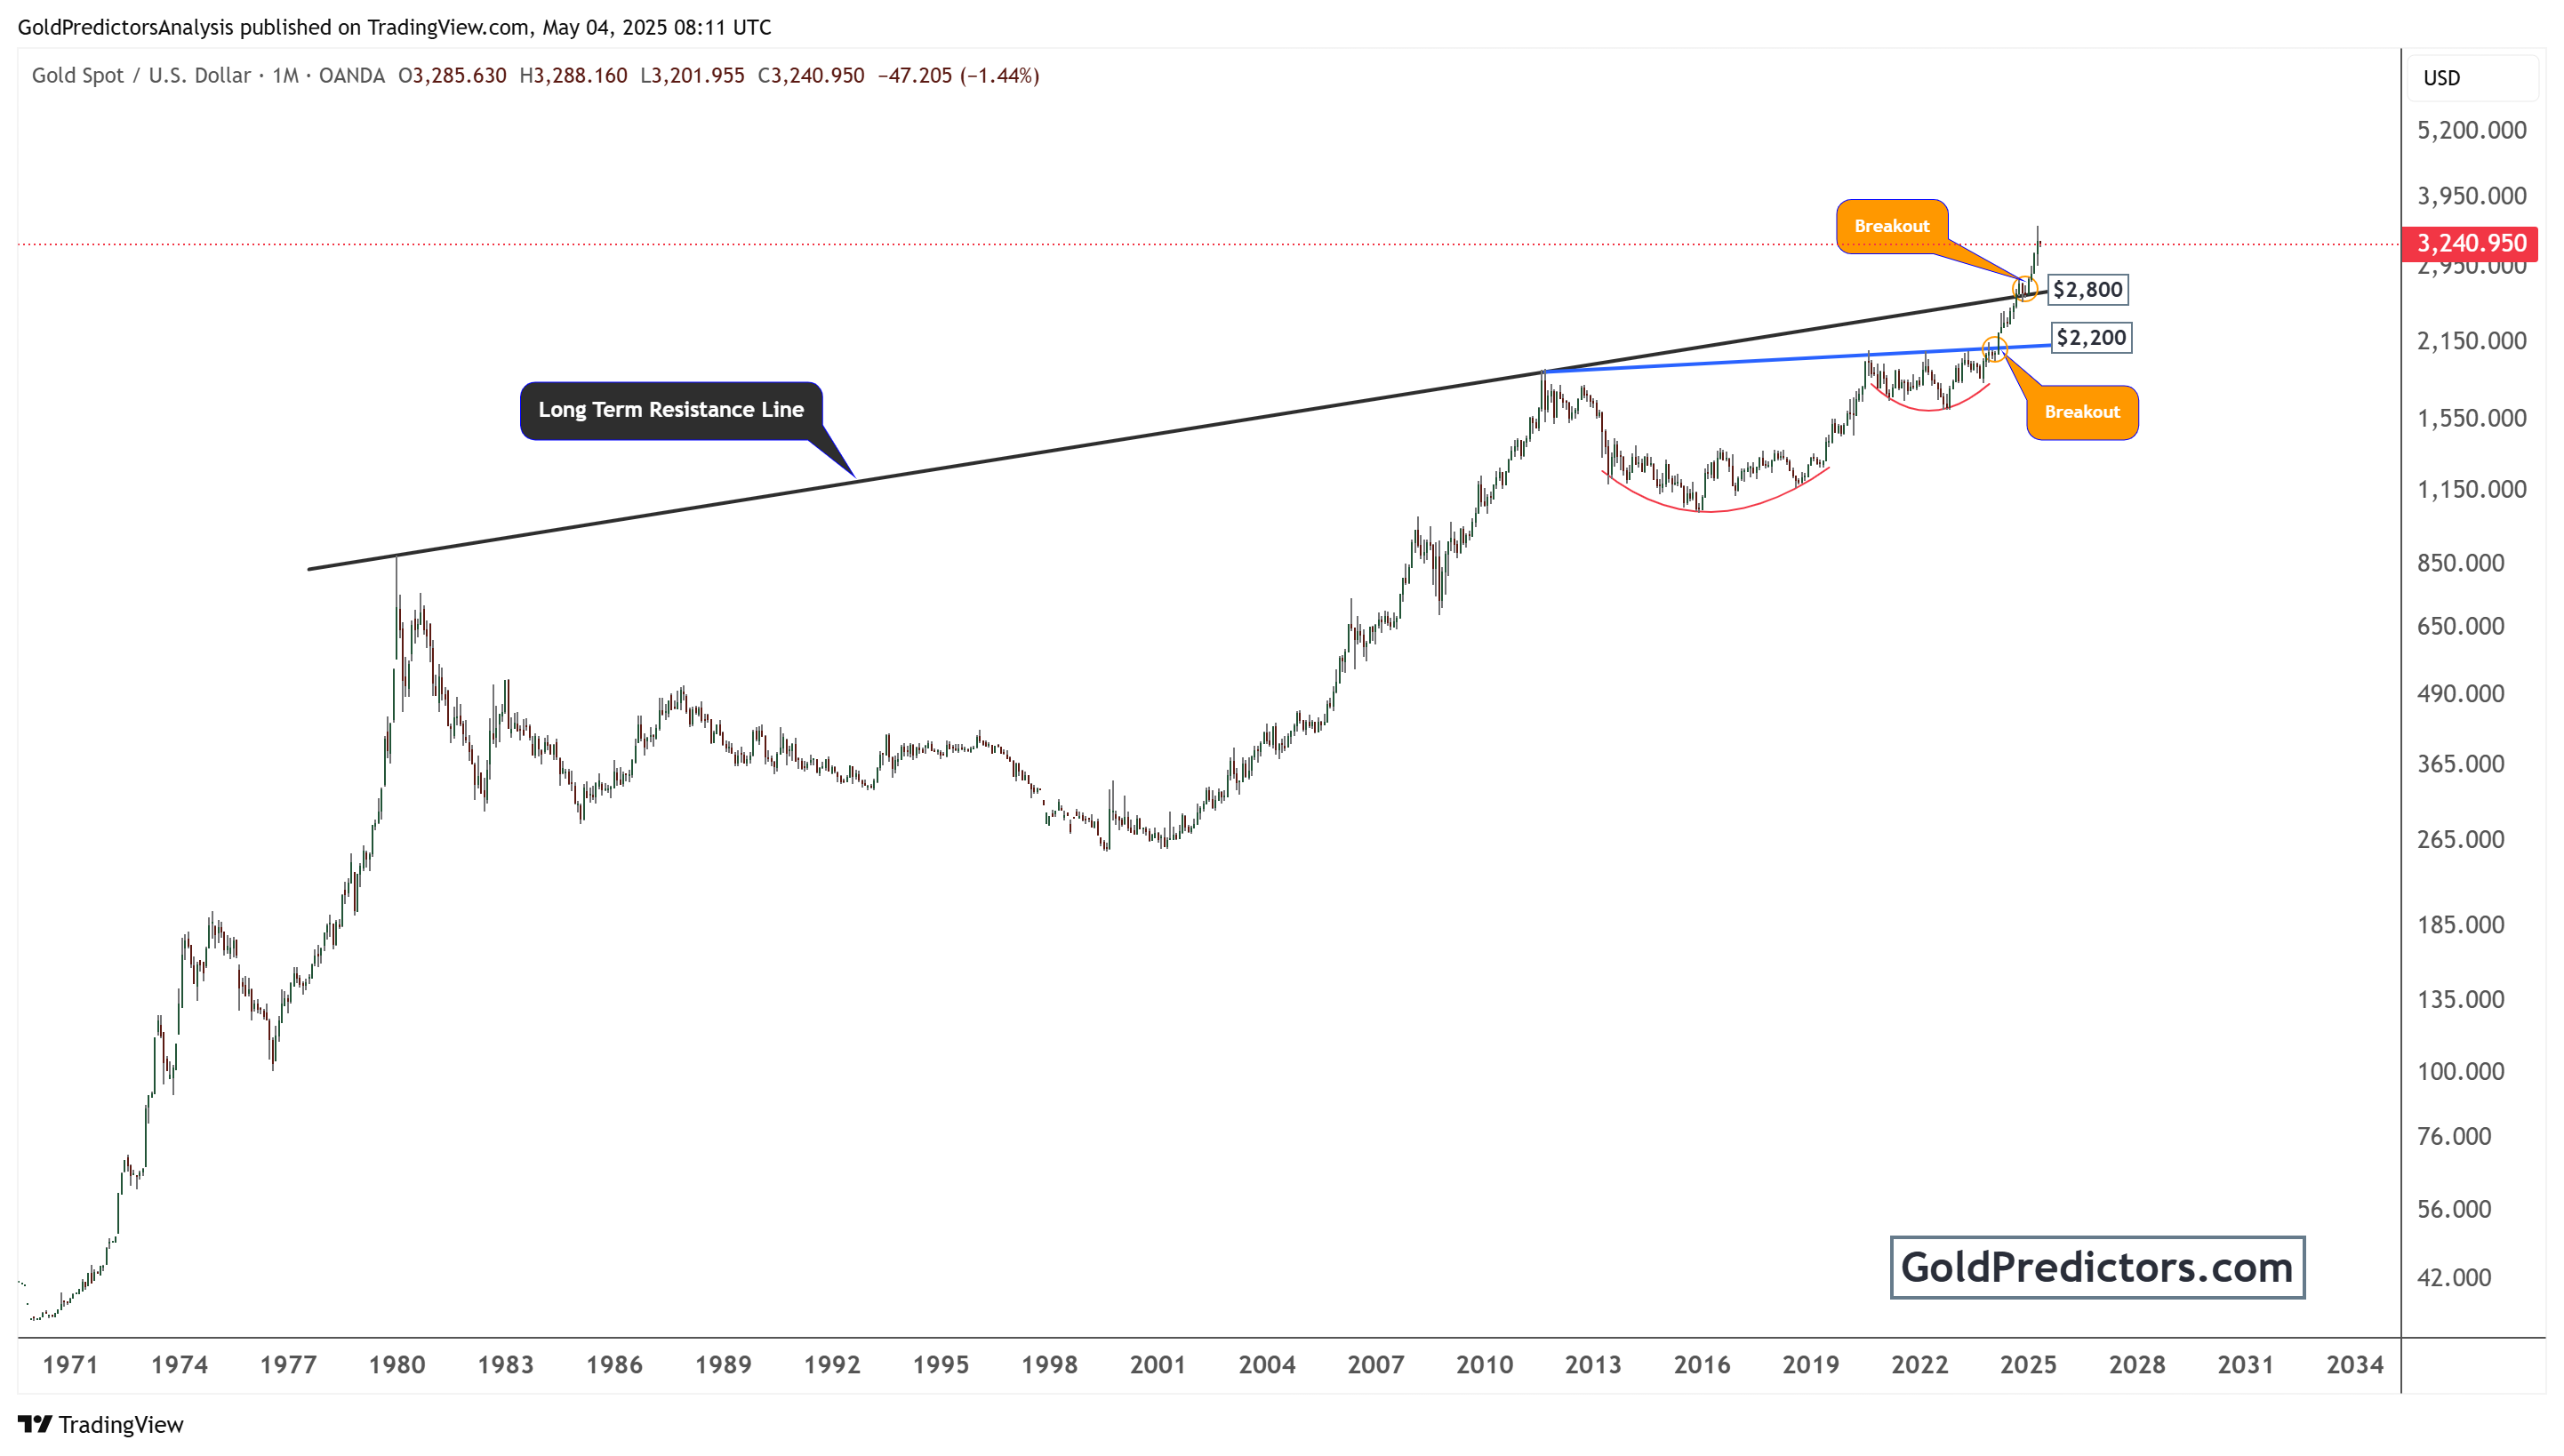
Gold price breaks the $2,200 and $2,800 levels, which were the psychological and structural resistance. These price levels were ceilings in previous rallies of 2011 and 2020. As of May 2025, gold is trading above $3,200, confirming that the breakout is not a false move but part of a larger trend.
This breakout could signal a multi-year bull market. Historical patterns suggest that such breakouts often lead to sustained rallies. The breakout also aligns with macroeconomic trends such as inflation fears, rising geopolitical tensions, and increased central bank gold purchases. All these factors are fueling investor interest in gold as a haven.
Dollar-to-Gold Ratio Collapse Reinforces Bullish Gold Market Forecast
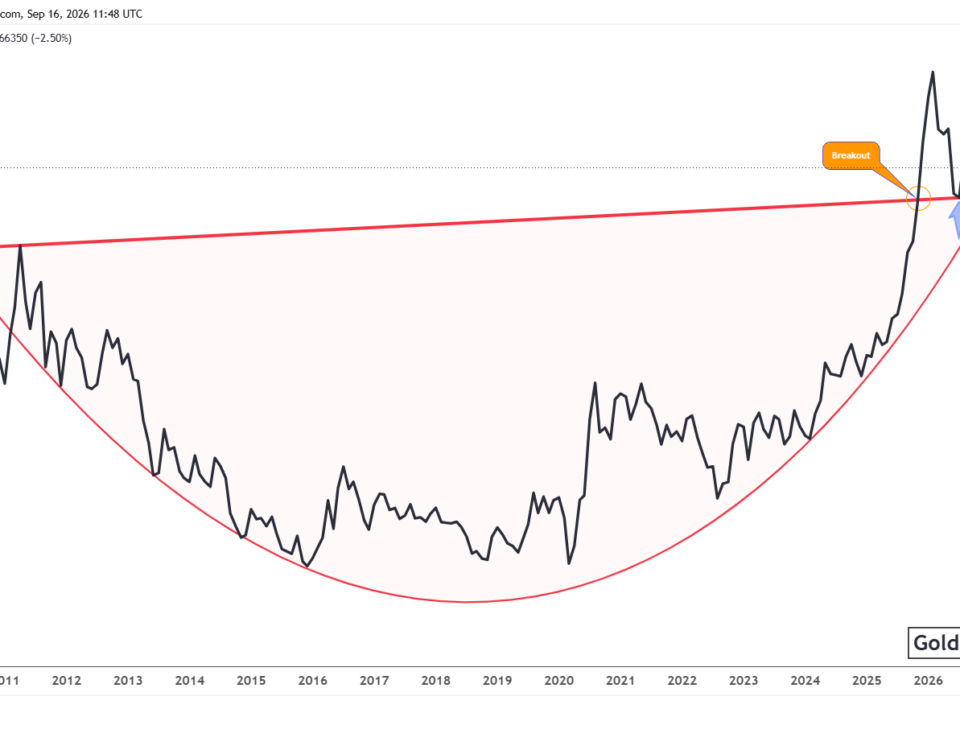
The monthly chart below compares the US dollar and gold using the DXY/XAUUSD ratio, covering 1967 through 2025. It shows how the dollar performed relative to gold and identifies three distinct decline phases. Each phase features a breakout from key technical patterns, signalling a shift in the long-term trend.
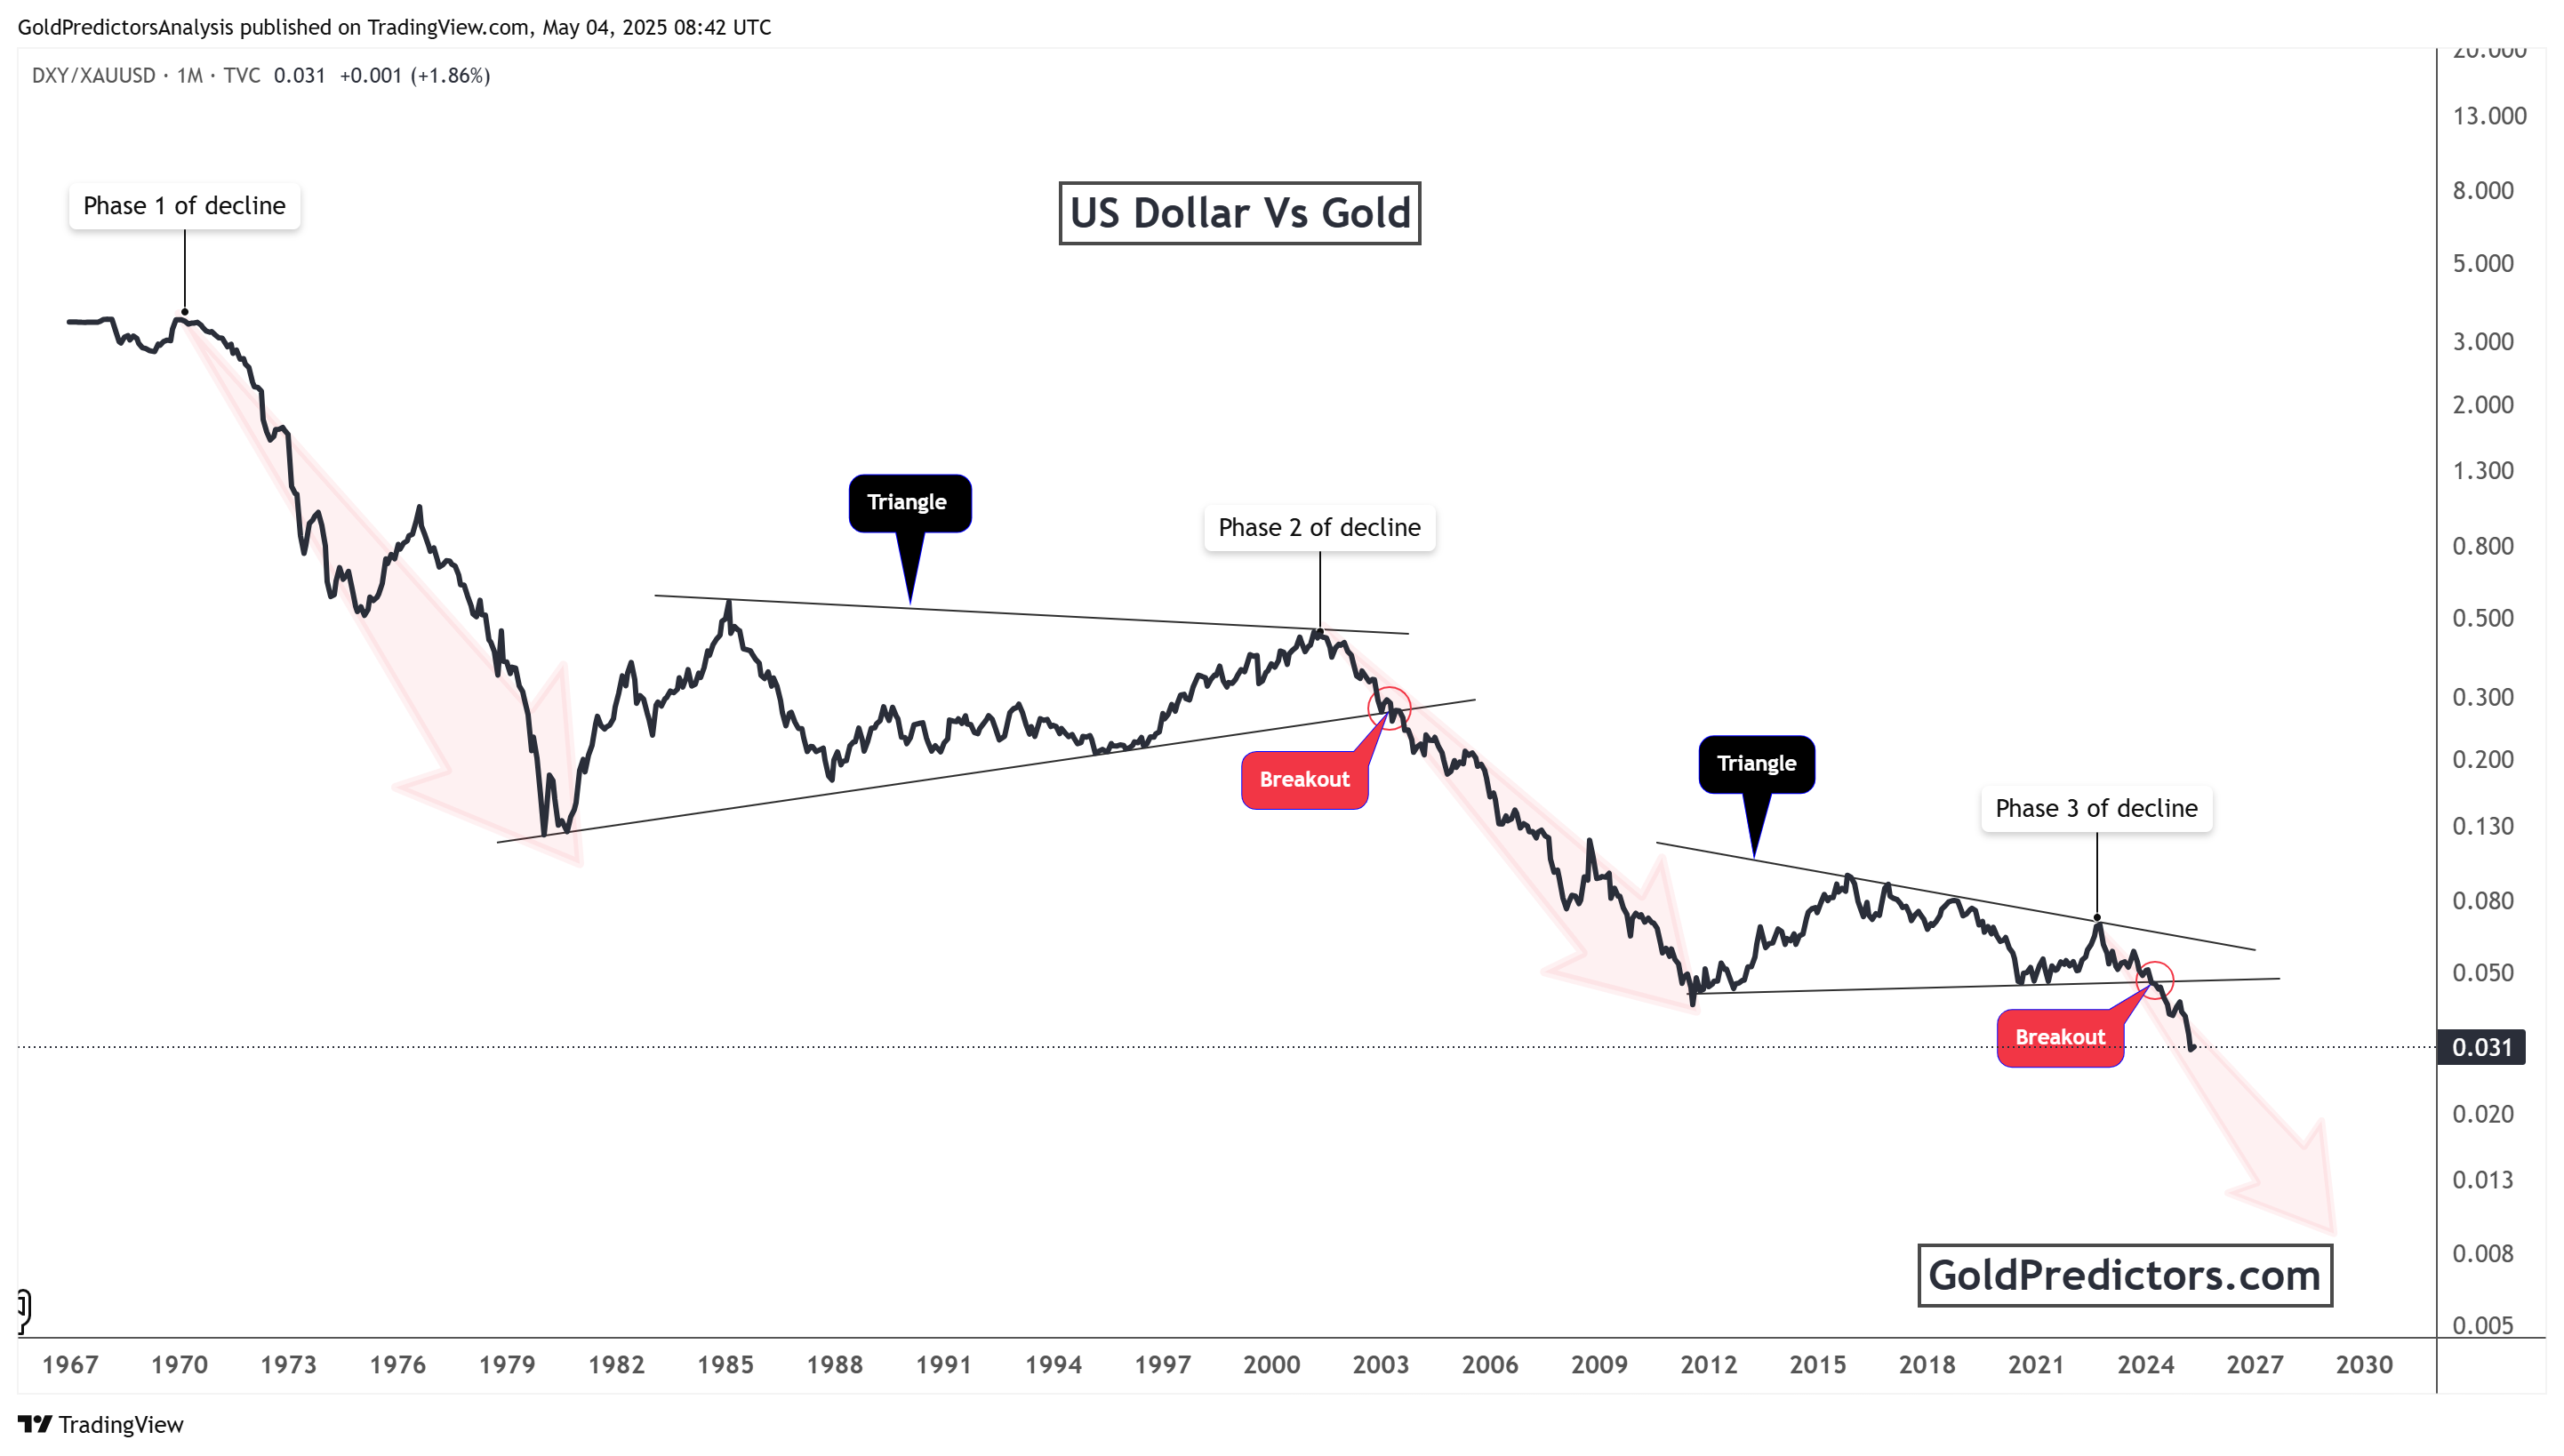
Phase 1 started in the early 1970s and continued into the early 1980s. The dollar fell sharply during this time as gold prices surged after the US abandoned the gold standard. The chart formed a descending triangle in Phase 2, which unfolded between the mid-1980s and early 2000s. The dollar broke down around 2002 and entered another significant decline, confirming a bearish trend.
Phase 3 marks the current stage. From 2012 to 2024, the chart developed another triangle pattern. The dollar broke below this pattern recently, signalling a new wave of weakness relative to gold. The ratio has dropped to 0.031, one of the lowest levels in history, and could fall even further. This ongoing dollar weakness boosts gold’s appeal, as investors look to protect value. The chart clearly shows that when the dollar weakens, gold tends to strengthen, preserving its long-term inverse relationship.
Gold Breakout and Dollar Decline Set Stage for Long-Term Rally Toward $6,000
Overall, gold has entered a powerful upward trend. Notably, the breakout above long-standing resistance levels signals a significant shift in market dynamics. Furthermore, technical patterns confirm that gold may continue rising for years.
At the same time, the US dollar shows persistent weakness against gold. The three-phase decline, especially the latest breakdown, suggests the dollar could fall further. As the dollar loses strength, gold gains value and investor confidence.
These combined signals create a strong bullish case for gold. Traders, investors, and institutions should watch these trends closely. The charts clearly show that gold is gaining momentum while the dollar fades. This shift may define the next stage of global financial markets.
The previous article on gold discussed a target of $6,000. The above analysis supports that outlook and suggests that the long-term breakout in the gold market and the continued decline in the dollar-to-gold ratio may drive gold toward that level.
Gold Predictors Premium Membership
Get exclusive short-term and swing trade ideas with precise entry levels, stop-loss, and target prices, including justification and analysis — all delivered directly via WhatsApp.
Our premium service includes deep technical analysis on gold and silver markets. We cover cycle analysis, price forecasting, and key timing levels.
Members also receive a weekly market letter with detailed analysis, commentary from our Chief Analyst, including actionable insights, trade timing, and direction forecasts for gold and silver.
Stay ahead of the market — join our premium community today.