


Gold Market Outlook: Cup-and-Handle Breakout and Relative Strength Reversal
Gold (XAUUSD) has broken through multi-decade resistance within its long-term ascending channel. The breakout confirms a powerful cup-and-handle formation that developed over decades of consolidation. Momentum accelerated once the price moved beyond key resistance, lifting gold into the upper section of the channel. At the same time, the gold-to-S&P 500 ratio is turning higher, signalling a structural shift in relative strength. These combined signals indicate that gold is entering a decisive phase, with the long-term bull trend positioned for extended gains.
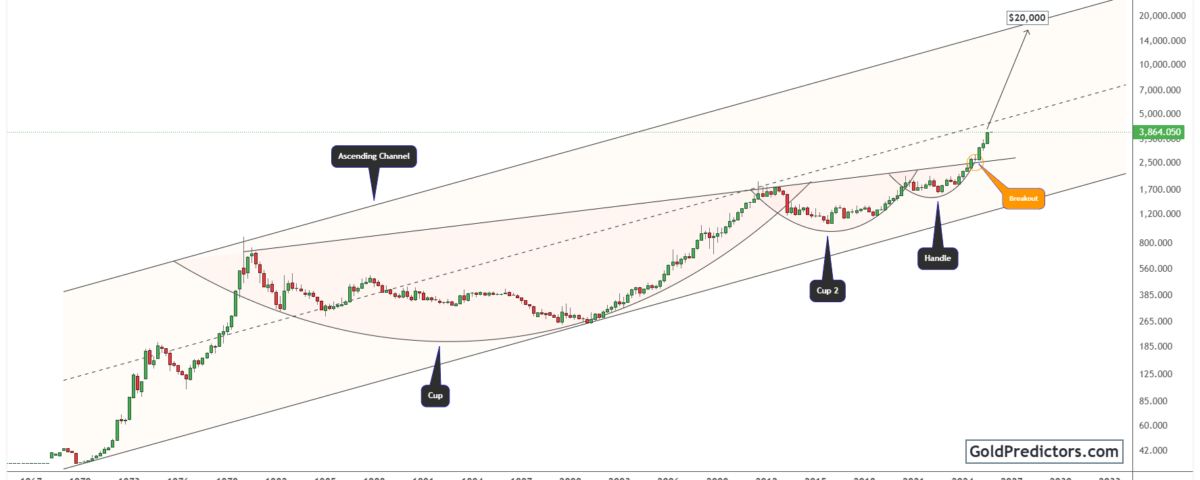
Gold Confirms Cup-and-Handle Breakout Inside Multi-Decade Ascending Channel
The gold chart below shows a well-defined ascending channel that has guided price movements for decades. Inside this channel, a broad cup-and-handle pattern developed, shaped by extended consolidation phases. Gold built a firm base between 1980 and 2000, then entered another prolonged consolidation phase from 2011 to 2020. These periods built strong foundations that supported the next stage of gold’s upward trend.
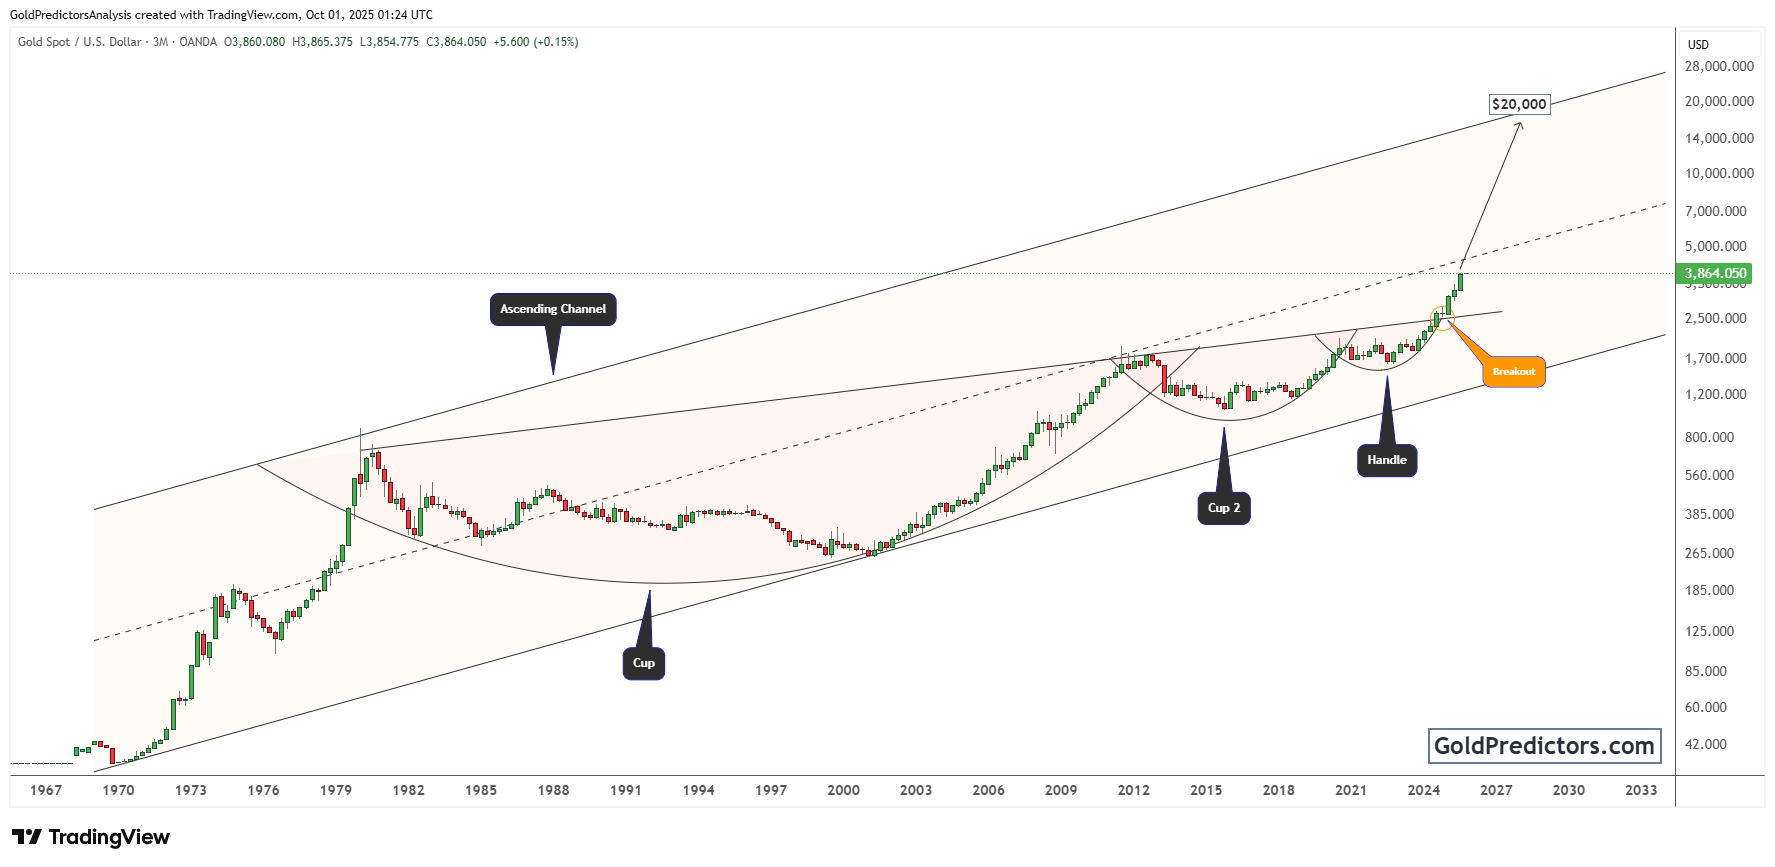
Moreover, the breakout above $2,075 confirmed the handle formation, marking the beginning of a new phase in the long-term bull trend. Once gold crossed this level, momentum accelerated sharply. Price has now moved above $3,800 and is holding firmly within the upper section of the ascending channel. Historical behaviour suggests that once these breakouts occur, they tend to lead to sustained rallies. Based on the channel projection, long-term targets suggest a potential rise toward $20,000 in the years ahead. However, this growth is likely to follow extended corrections from key resistance zones. Major technical levels to watch remain at $4,000, $6,000, and $10,000.
Consequently, gold has respected the channel’s upper and lower boundaries, establishing a clear framework for projecting future price direction. With price now holding in the upper range of the channel, the long-term bull trend remains strong. Each higher low and higher high reflects sustained momentum, while the breakout confirms that the rally remains intact. These combined signals suggest that the broader rally is positioned to advance further.
Gold-to-S&P 500 Ratio Points to Structural Shift and Potential Outperformance
The chart below shows the gold-to-S&P 500 ratio, offering a clear view of long-term shifts in relative market strength. Over the past decade, gold has underperformed equities, as reflected in the declining ratio. However, this trend appears to be reversing. The ratio chart shows a well-defined, rounded base, suggesting a structural shift in progress.
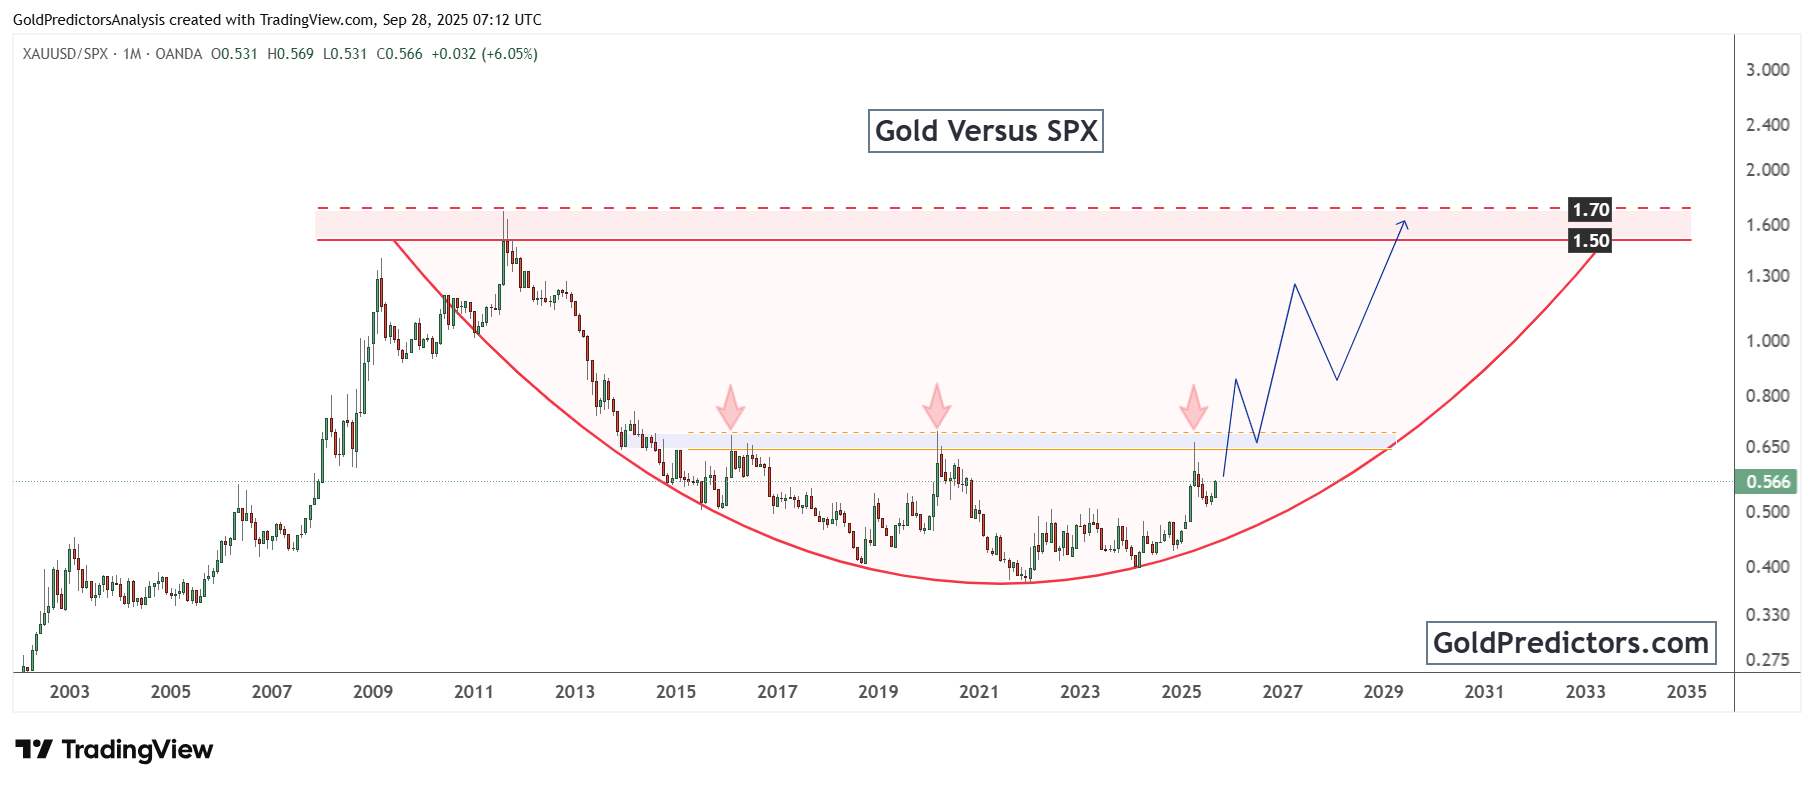
Although past attempts to clear the 0.65 level failed, current momentum suggests that a breakout may soon be achieved. If the ratio rises above 0.65 and sustains this level, it would confirm that gold is beginning to outperform equities. Furthermore, the ratio signals possible targets between 1.5 and 1.7, levels last observed at the 2011 peak when gold surpassed $1,900.
Consequently, this shift in relative strength suggests that gold may become more attractive than equities in the years to come. For institutional investors, this ratio provides a critical guide. In particular, a confirmed breakout would indicate that capital may rotate from equities into precious metals. This shift would strengthen gold’s position as both a reliable safe-haven and a growth asset during periods of uncertainty.
Long-Term Gold Outlook: Structural Strength and Market Leadership Ahead
Gold’s breakout from multi-decade patterns signals a powerful new phase in its long-term bull market. The price has held firmly within the upper section of its ascending channel, showing clear momentum. Each correction has created higher lows, while rallies have consistently produced higher highs. These signals confirm that gold’s structural uptrend remains firmly intact and positioned for further gains.
Moreover, the gold-to-S&P 500 ratio adds further support to this outlook. The rounded base and rising momentum suggest that gold may begin to outperform equities after lagging for years. A sustained move above the 0.65 level would confirm this shift. A breakout would highlight gold’s growing appeal not only as a hedge, but also as a stronger relative performer in the broader market landscape.
Overall, gold’s alignment of technical strength and supportive macroeconomic conditions highlights its long-term appeal. The breakout from multi-decade structures, coupled with a rising gold-to-S&P 500 ratio, signals that the metal is entering a decisive phase. With the structural trend firmly intact, gold remains positioned not only as a safe-haven asset but also as a potential market leader in the years ahead.
Gold Predictors Premium Membership
Get exclusive short-term and swing trade ideas with precise entry levels, stop-loss, and target prices, including justification and analysis — all delivered directly via WhatsApp.
Our premium service includes deep technical analysis on gold and silver markets. We cover cycle analysis, price forecasting, and key timing levels.
Members also receive a weekly market letter with detailed analysis, commentary from our Chief Analyst, including actionable insights, trade timing, and direction forecasts for gold and silver.
Stay ahead of the market — join our premium community today.


