


Gold Eyes $4,000 After Long-Term Breakout and Pattern Confirmation
Gold (XAUUSD) has broken through multi-year resistance, confirming a decisive long-term breakout. The price action shows a classic cup-and-handle formation with strong follow-through. Momentum continues to build as key resistance zones turn into support. Meanwhile, both trading volume and price structure reflect growing strength behind the move. Additionally, a rising Gold-to-S&P 500 ratio further strengthens the outlook. Capital is shifting from equities into gold, signaling growing demand for safety. These developments set the stage for a potential move toward the $4,000 target.
Gold Price Breaks Multi-Year Resistance as Classic Pattern Targets $4,000
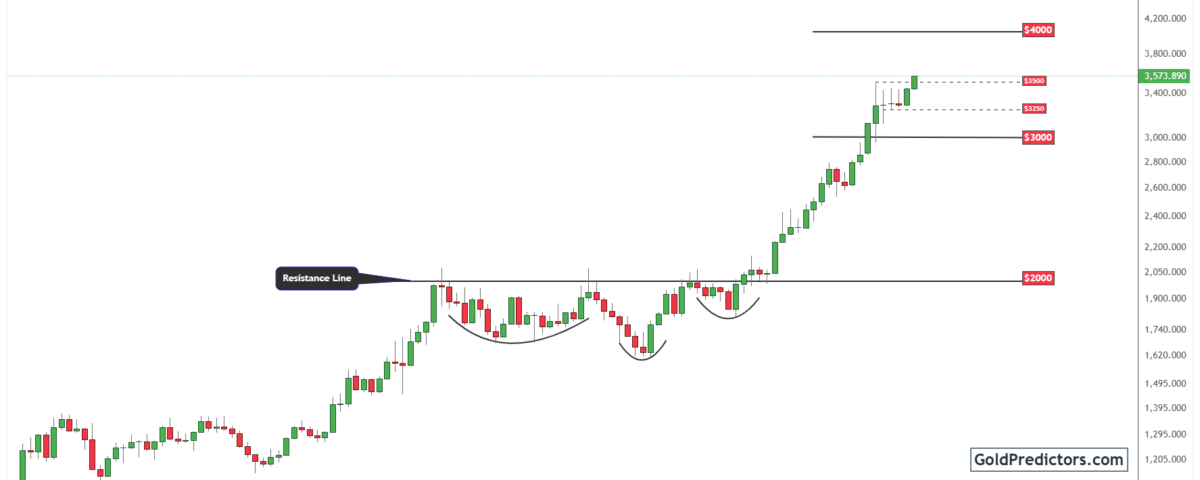
The gold chart below shows a clear breakout following a multi-year consolidation phase. During this prolonged period, gold formed a textbook cup-and-handle pattern, with the neckline acting as significant resistance over several years. Eventually, after several failed attempts, gold finally broke above this zone in 2024 and accelerated higher in 2025.
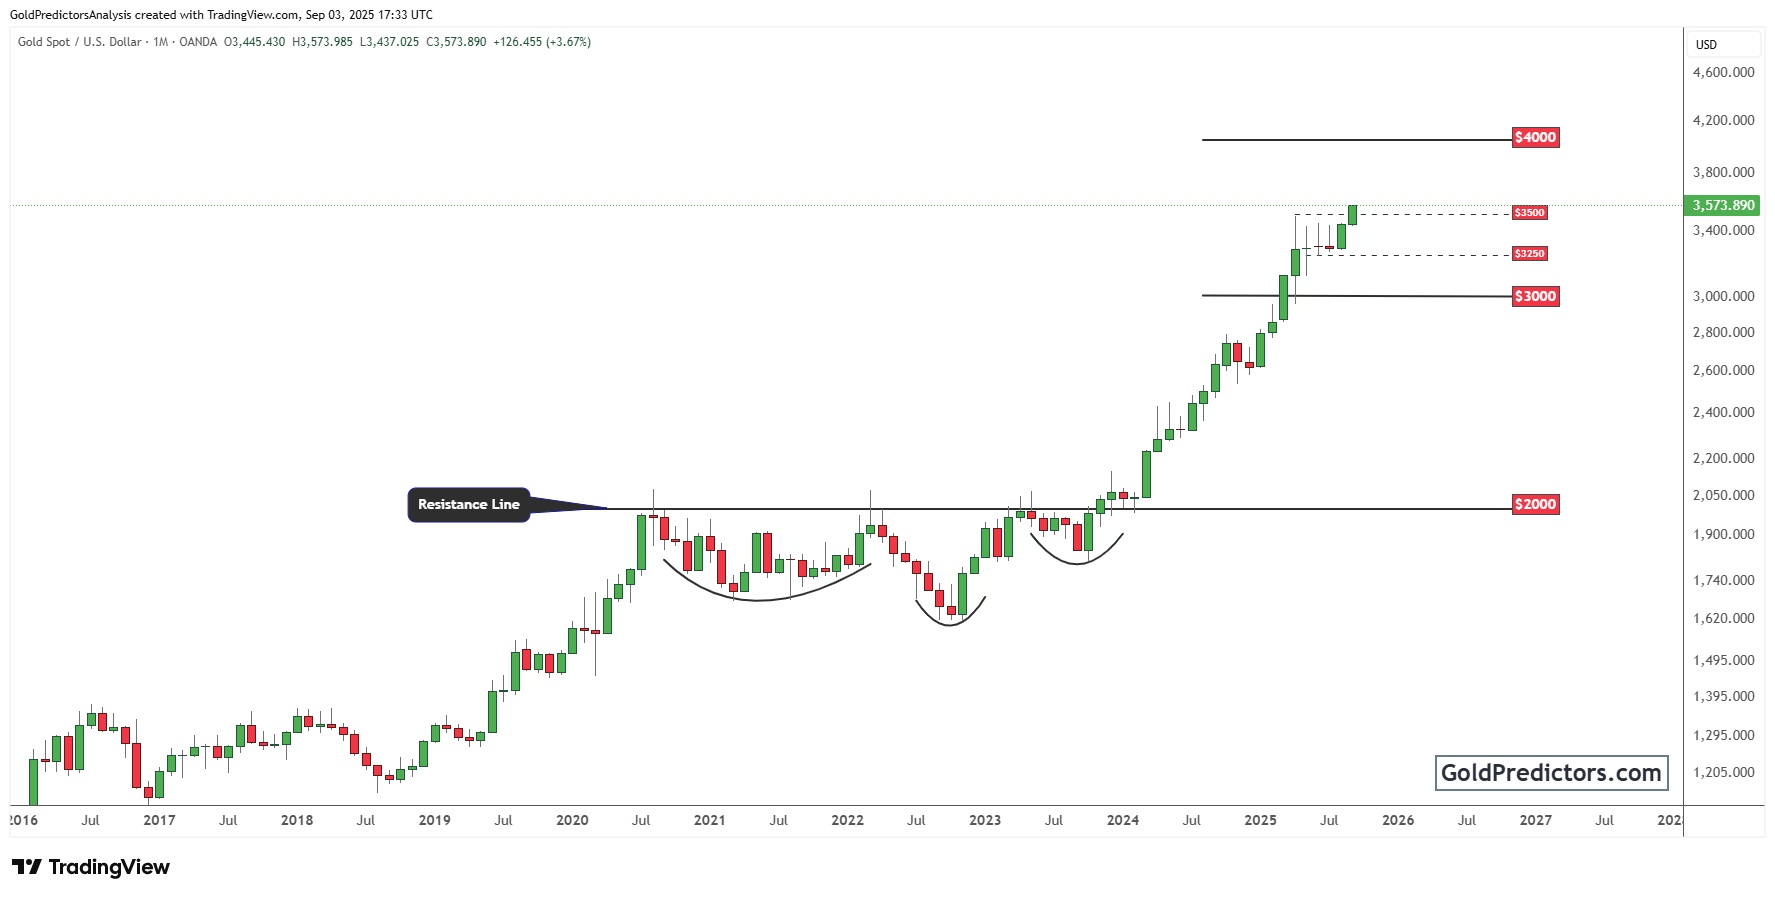
The breakout has pushed gold beyond a significant resistance zone highlighted on the chart. Consequently, this move confirms the bullish structure and sets the stage for the next primary psychological and technical target at $4,000. Moreover, if the rally continues, gold could move closer to this milestone in the near term, confirming its strong trajectory.
At the same time, a new support base has formed in the zone previously marked by resistance. These levels could offer buying opportunities on dips, strengthening the bullish case. Additionally, the structure exhibits a series of higher lows, supported by substantial volume. The breakout from the consolidation phase was decisive, reflecting a strong move toward a new long-term trend.
Gold Outperforms Equities as Gold-to-S&P 500 Ratio Breaks Key Triangle
The chart below shows the Gold-to-S&P 500 ratio, highlighting gold’s relative performance against the stock market. This ratio is a valuable indicator for identifying periods when gold is outperforming equities. A rising ratio indicates that investors are shifting funds from riskier assets into gold, signaling a defensive positioning.
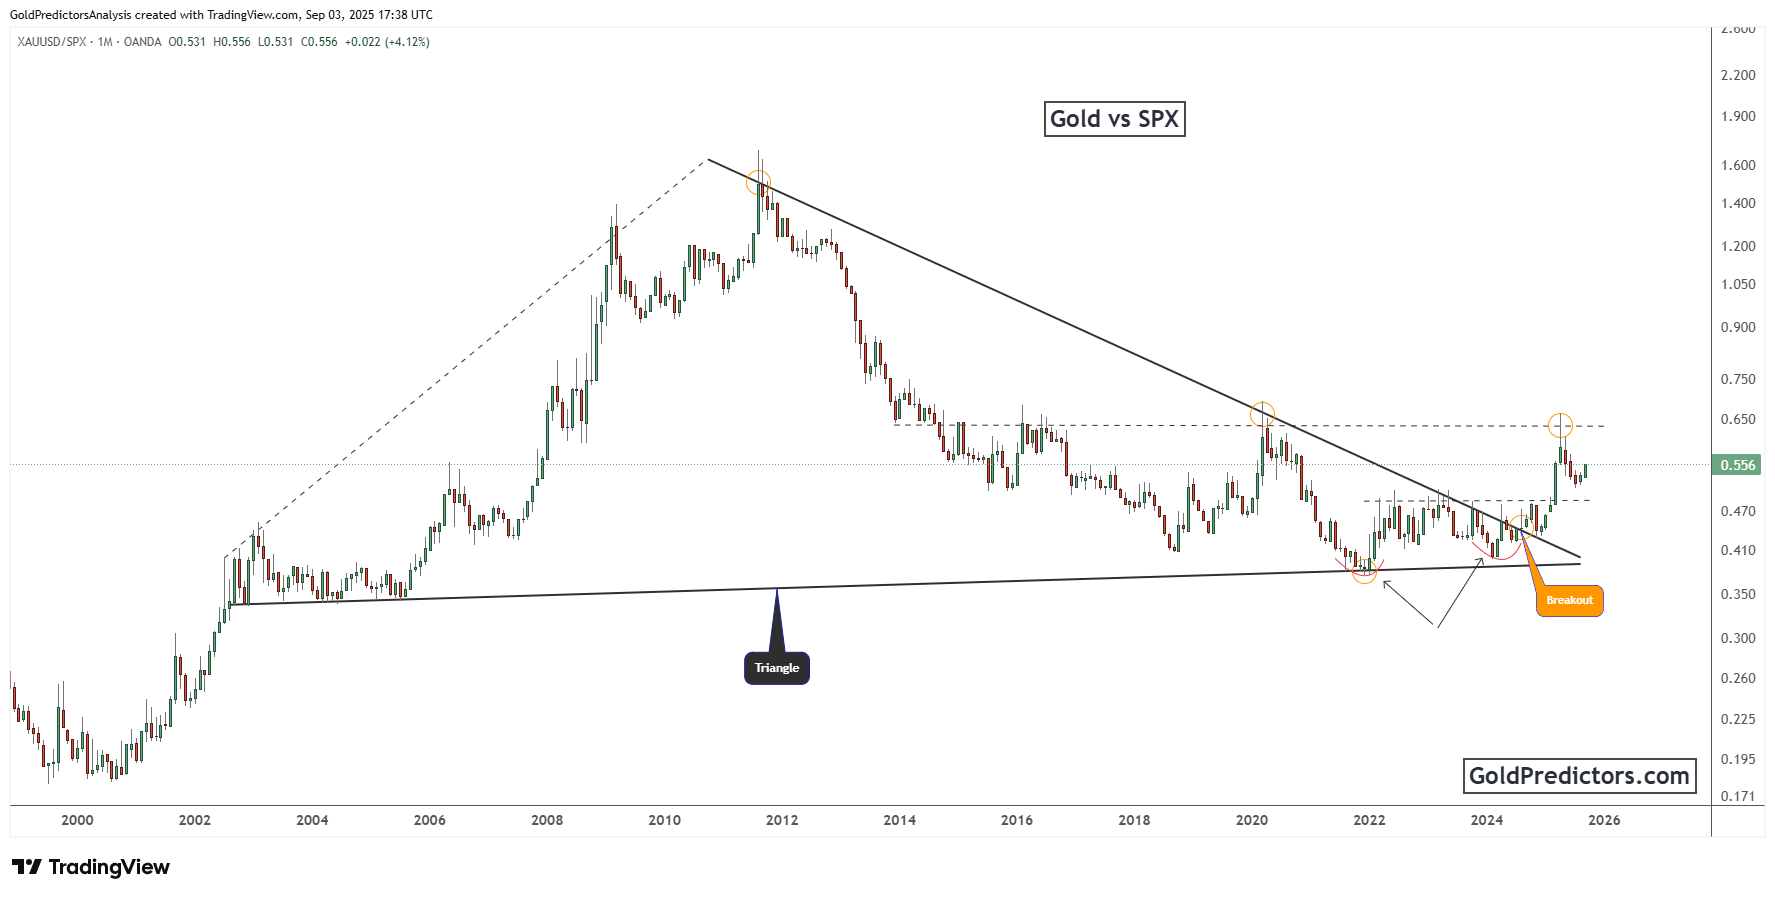
Between 2011 and 2023, the ratio traded within a broad descending triangle formation. During this period, multiple breakout attempts failed, confirming gold’s underperformance against equities. However, the ratio recently broke out with strength and has surged higher, marking the end of a prolonged consolidation. This move represents a structural change where gold is now consistently outperforming the broader stock market. Such behavior typically aligns with major macroeconomic shifts, including declining real yields, inflationary pressures, or rising geopolitical risks.
Moreover, price action over recent years has steadily prepared the ground for the breakout. Since 2019, the chart has recorded a sequence of higher lows that developed into a bullish wedge, setting the stage for the breakout. Notably, the recent retest of the breakout zone was successful, reinforcing market strength and supporting the case for a lasting trend reversal.
Bottom Line: Structural Breakout Targets $4,000 and Beyond
Gold has confirmed a long-awaited structural breakout, supported by both price action and volume. The successful move above multi-year resistance completes a textbook cup-and-handle formation. With momentum accelerating and a new support base in place, gold is now positioned to test higher levels, with $4,000 as the next key target.
Moreover, the breakout in the Gold-to-S&P 500 ratio further validates this outlook. For the first time in over a decade, gold is consistently outperforming equities. This shift signals a broader rotation into safe-haven assets, reflecting growing concerns about inflation, real yields, and geopolitical tensions.
Technically, the structure remains firmly bullish. Higher lows, a bullish wedge formation, and a successful retest of the breakout zone confirm continued strength. As long as price holds above recent support, gold is likely to maintain its upward trajectory and keep the $4,000 level clearly in sight.
Gold Predictors Premium Membership
Get exclusive short-term and swing trade ideas with precise entry levels, stop-loss, and target prices, including justification and analysis — all delivered directly via WhatsApp.
Our premium service includes deep technical analysis on gold and silver markets. We cover cycle analysis, price forecasting, and key timing levels.
Members also receive a weekly market letter with detailed analysis, commentary from our Chief Analyst, including actionable insights, trade timing, and direction forecasts for gold and silver.
Stay ahead of the market — join our premium community today.


