


Gold Enters Third Historic Bull Phase After Multi-Decade Breakout
Gold (XAUUSD) has entered its third primary bull phase after breaking out from a multi-decade resistance trendline. This breakout follows similar long-term rallies in the 1970s and 2000s, both of which led to sharp price gains. The recent move is forming along a parabolic curve, indicating accelerating momentum and strong investor interest. At the same time, the gold-to-S&P 500 ratio has also broken out of a decade-long triangle, signaling gold’s growing strength relative to equities. Together, these developments signal a structural shift that favors gold. This shift is fueled by weakening real yields, increasing economic uncertainty, and declining confidence in fiat currencies.
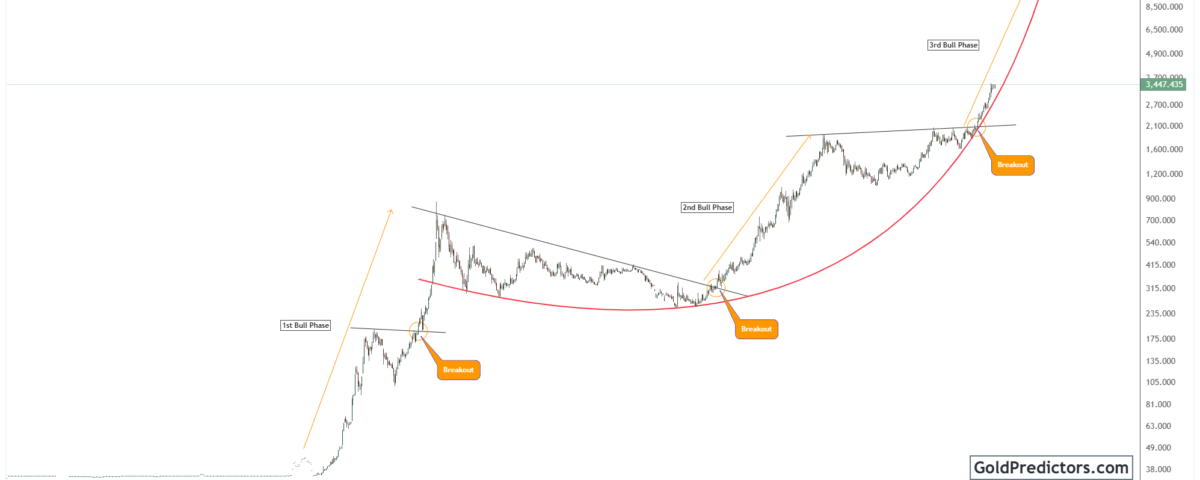
Gold Breaks Multi-Decade Trendline to Begin Third Major Bull Phase
The gold chart below shows three distinct bull phases over the last several decades on the long-term monthly timeframe. The first bull phase began in the late 1960s and surged sharply throughout the 1970s, reaching its peak in 1980. This move was triggered by inflation, dollar devaluation, and geopolitical risks. Following the initial breakout, gold entered a prolonged period of consolidation and correction.
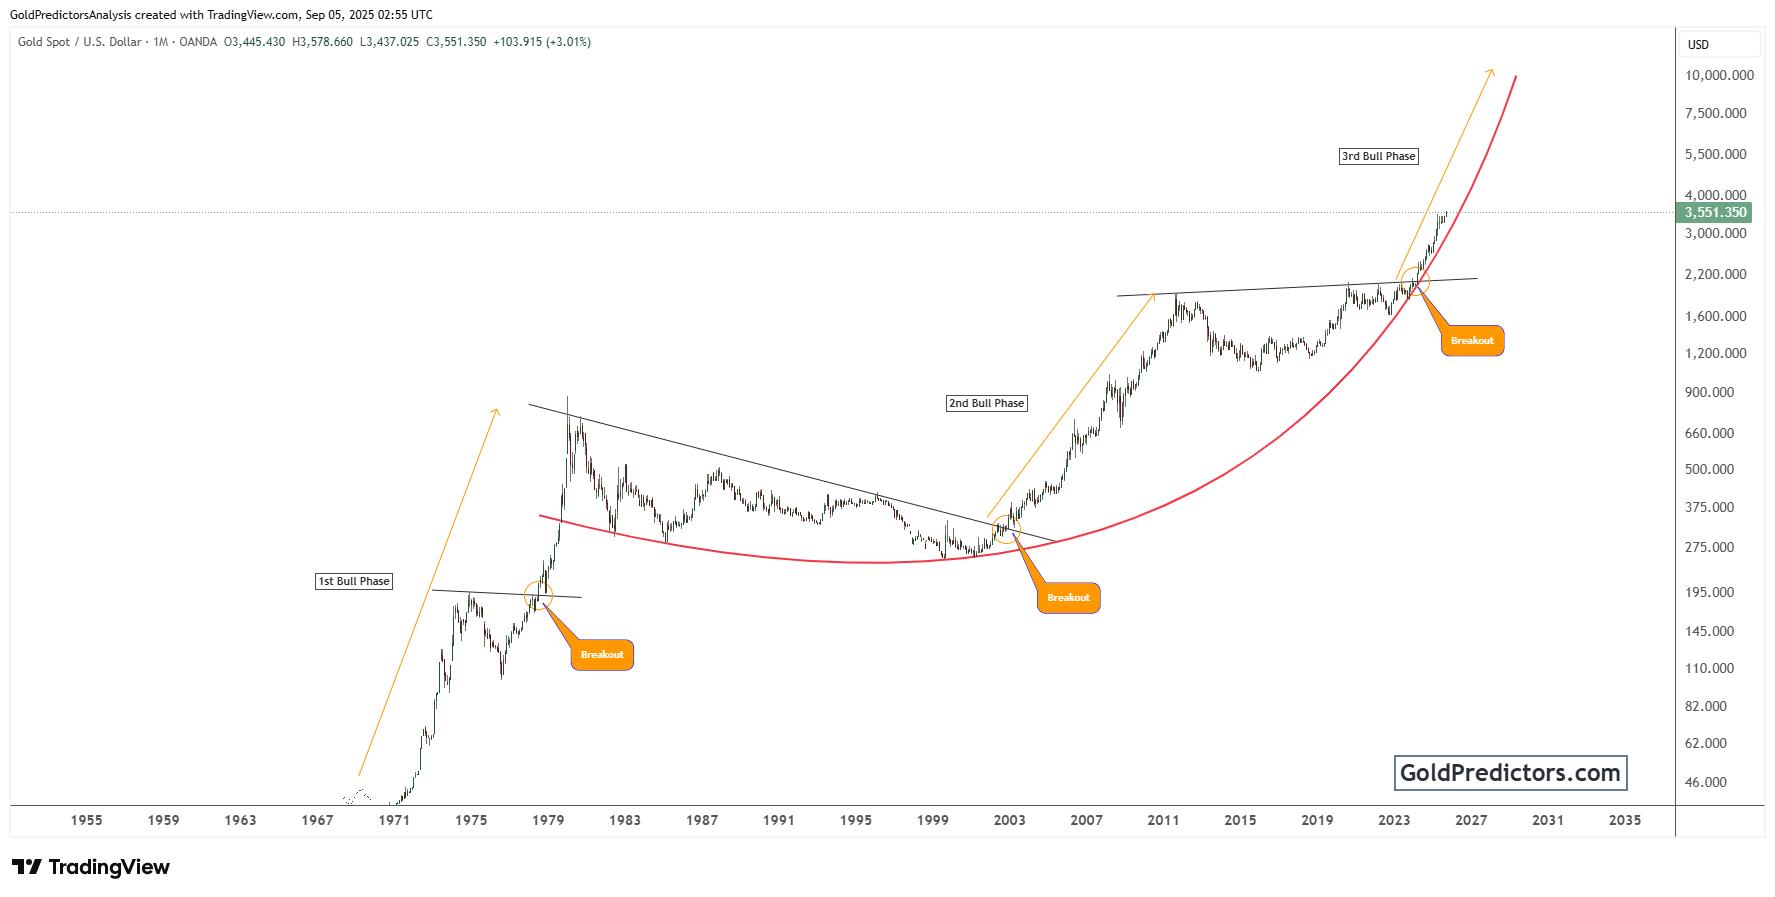
Similarly, the second primary bull phase began around 2001 following a breakout from a descending triangle. This breakout signaled the start of a powerful uptrend that lasted over a decade, eventually peaking near $1,900 in 2011. The pattern also revealed a classic rounded bottom formation, which is a strong reversal signal. Moreover, the rally was supported by the Federal Reserve’s easing and growing global financial instability following the 2008 crisis.
Now, in 2025, gold has completed a third breakout from a long-term resistance trendline that began forming after the 2011 high. Notably, the recent breakout has occurred along a parabolic red curve, suggesting a strong acceleration in momentum. As a result, the breakout confirms the beginning of the third bull phase, reinforcing the start of a potentially long-lasting uptrend. Consequently, this breakout signals the potential for significantly higher targets over the coming years. If the parabola remains intact, prices could extend beyond $6,000 or even $8,000.
Gold-to-S&P 500 Ratio Signals Outperformance with Triangle Breakout
The chart below shows a clear breakout in the gold-to-S&P 500 ratio, indicating growing strength in gold relative to equities. This ratio measures gold’s performance relative to equities, particularly the US stock market. The chart shows a symmetrical triangle that formed from 2011 to 2024. This pattern kept gold’s relative performance restricted for more than a decade.
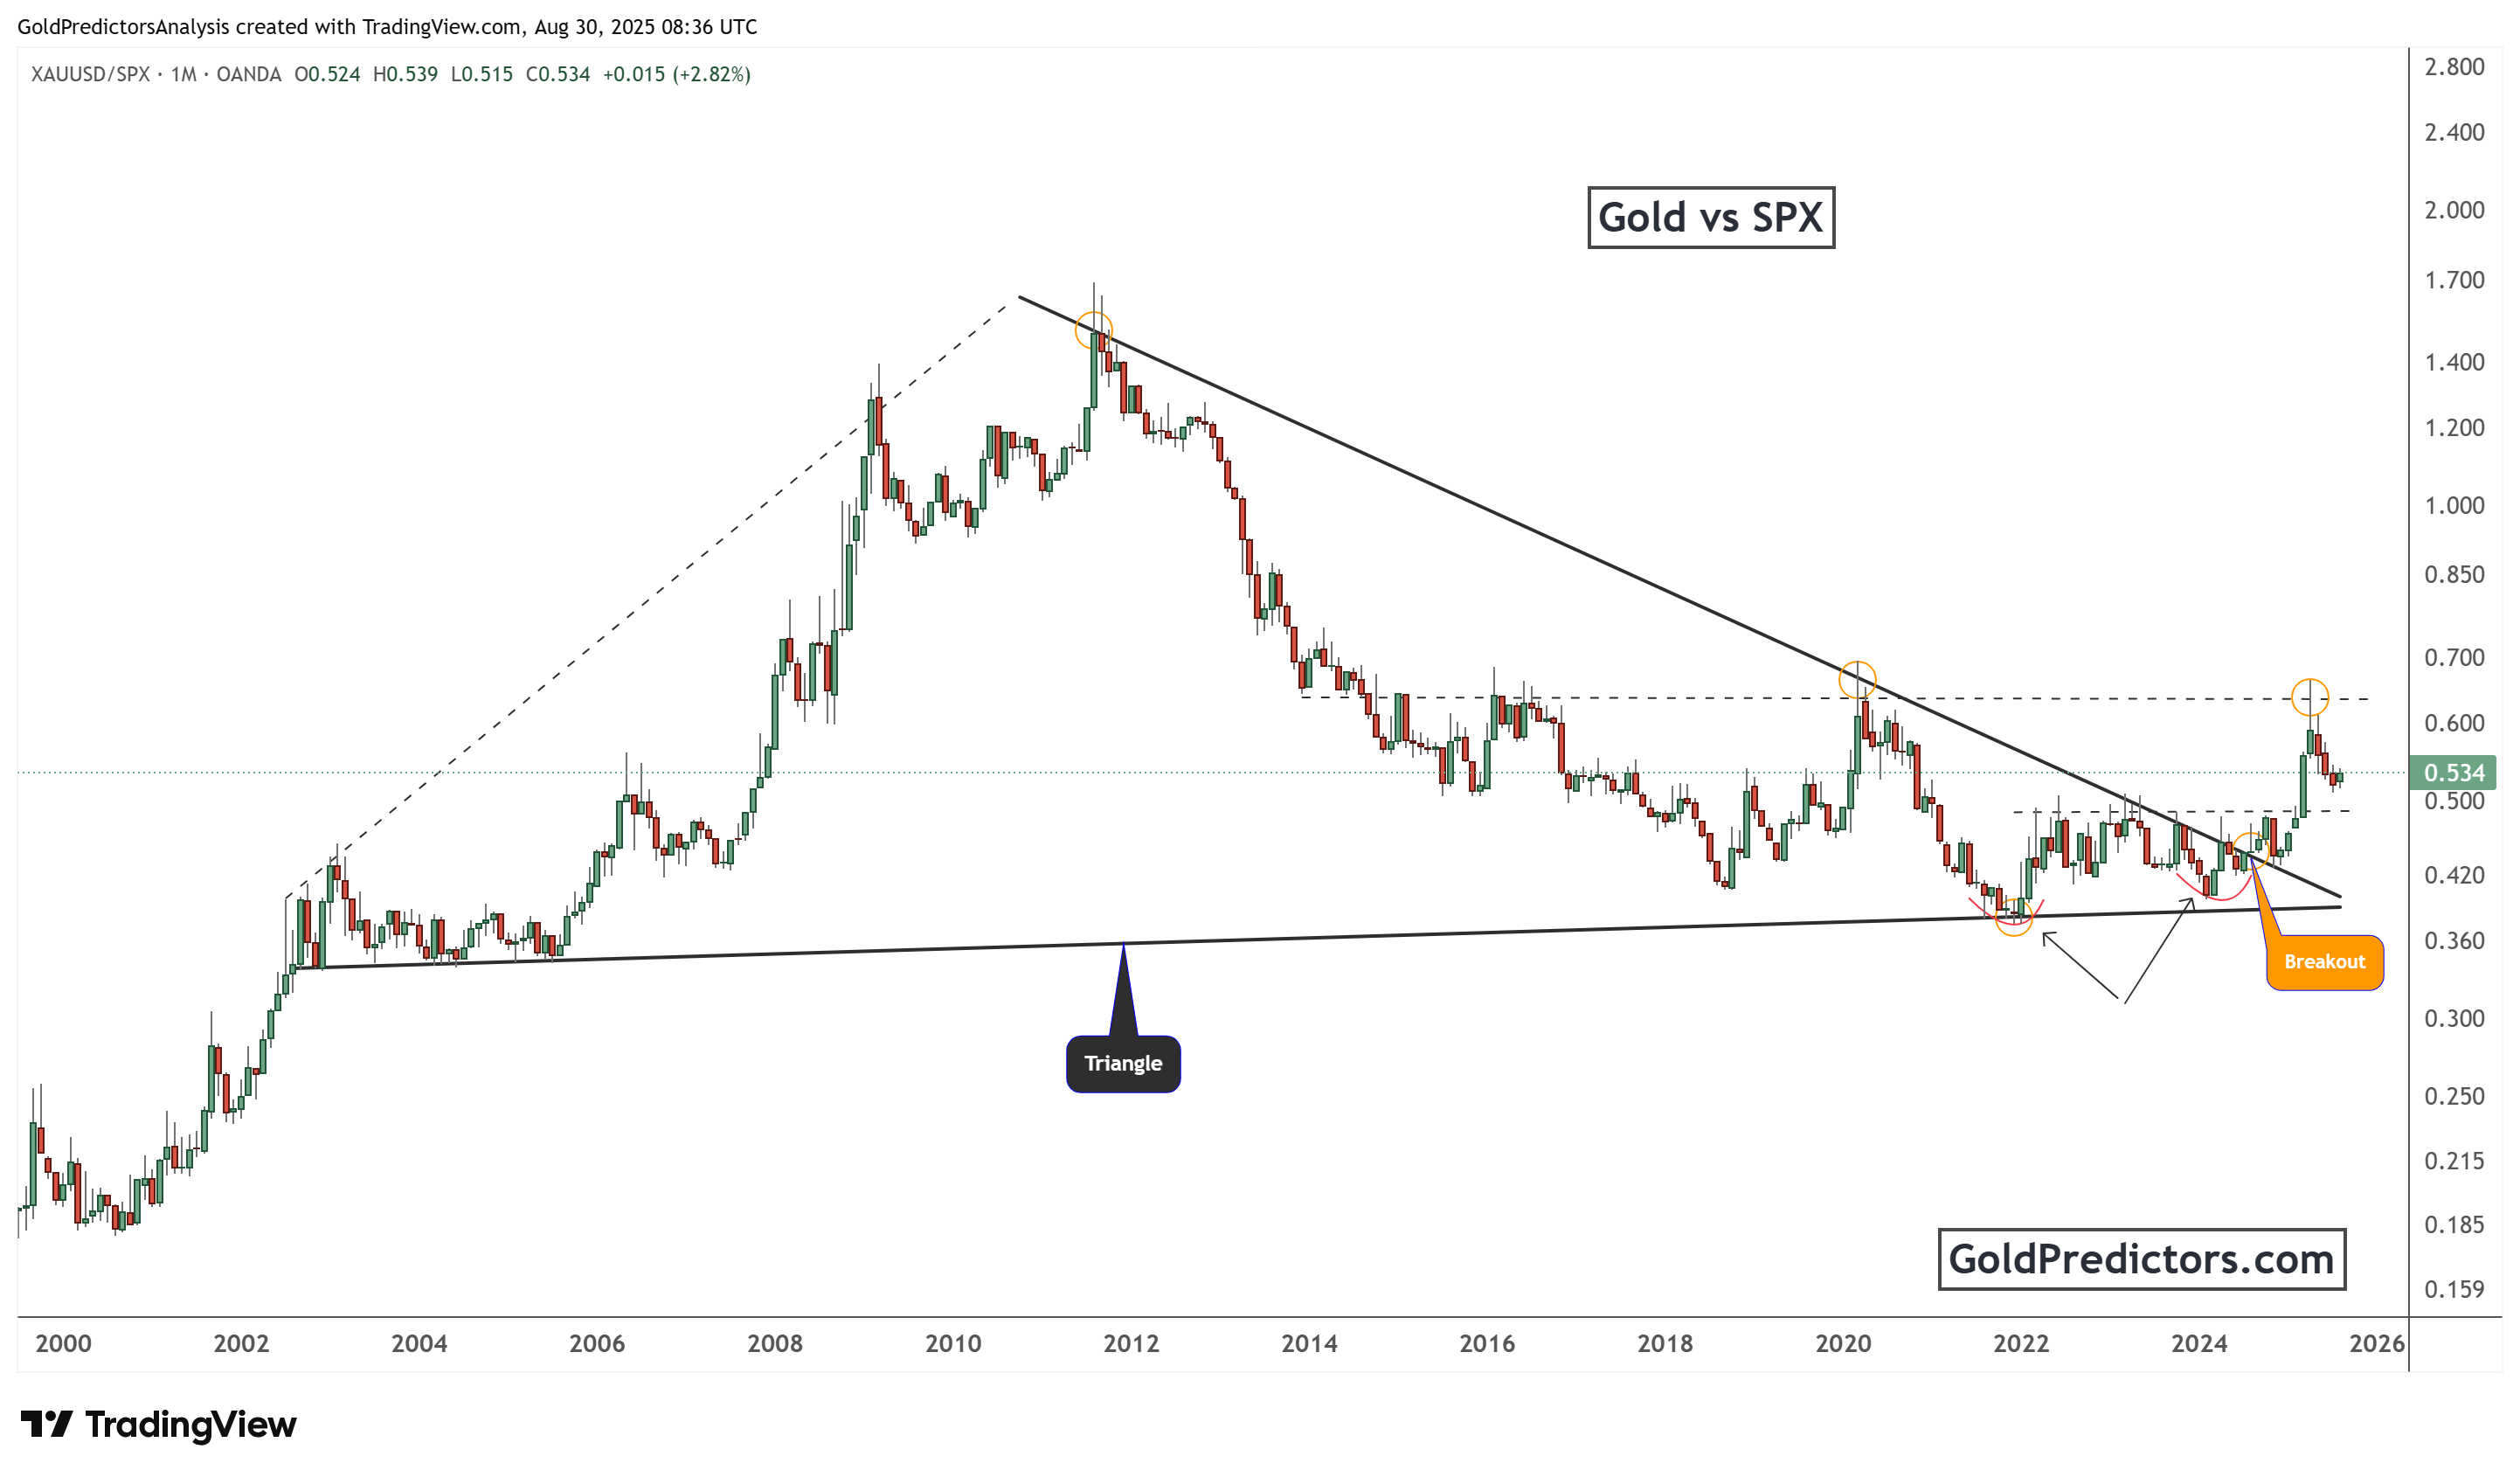
In early 2025, the ratio broke out of this triangle pattern to the upside. The breakout suggests that gold is once again outperforming equities. This breakout is significant, as it often reflects a broader shift of capital from risk assets into precious metals.
Repeated rejections at the 0.60–0.70 resistance zone have finally led to a convincing breakout. Currently, the ratio stands at 0.534, indicating room for further upside. Moreover, if the ratio retests previous highs near 1.5–2.0, it would confirm gold’s dominance in the investment landscape. Additionally, this relative breakout aligns with broader macroeconomic conditions. These include slowing global growth, declining real yields, and weakening confidence in fiat currencies and central bank independence.
Conclusion: Gold’s Parabolic Breakout Confirms New Long-Term Uptrend
Gold has confirmed a major technical breakout, marking the start of its third long-term bull phase. This breakout mirrors previous long-term rallies and confirms the beginning of a new upward phase following an extended consolidation. Moreover, the formation along a parabolic curve signals strong upward momentum and increasing investor confidence.
Additionally, the breakout in the gold-to-S&P 500 ratio reinforces this outlook. Gold is once again outperforming equities, which suggests a broader shift in market sentiment. The ratio has also broken through multiple resistance zones and may continue to rise if it retests its historical highs.
At the same time, broader macroeconomic trends support these technical signals. Slowing growth, falling real yields, and reduced confidence in fiat currencies continue to drive demand for gold. Taken together, these factors point to higher long-term targets and confirm that gold’s next major rally is in its early stages.
Gold Predictors Premium Membership
Get exclusive short-term and swing trade ideas with precise entry levels, stop-loss, and target prices, including justification and analysis — all delivered directly via WhatsApp.
Our premium service includes deep technical analysis on gold and silver markets. We cover cycle analysis, price forecasting, and key timing levels.
Members also receive a weekly market letter with detailed analysis, commentary from our Chief Analyst, including actionable insights, trade timing, and direction forecasts for gold and silver.
Stay ahead of the market — join our premium community today.


