


Gold Enters Major Bull Cycle After Breaking 40-Year Resistance
Gold (XAUUSD) has entered a decisive new phase in its market history. It has broken above a resistance line that has capped prices for more than four decades. This breakout signals a significant shift in momentum, opening the door to further gains. Historical patterns show that such moves often lead to strong multi-year rallies. At the same time, gold remains undervalued compared to U.S. equities, creating room for long-term outperformance. In combination with slow global growth, rising debt, and rising geopolitical risks, these conditions support the case for a powerful and lasting bull run.
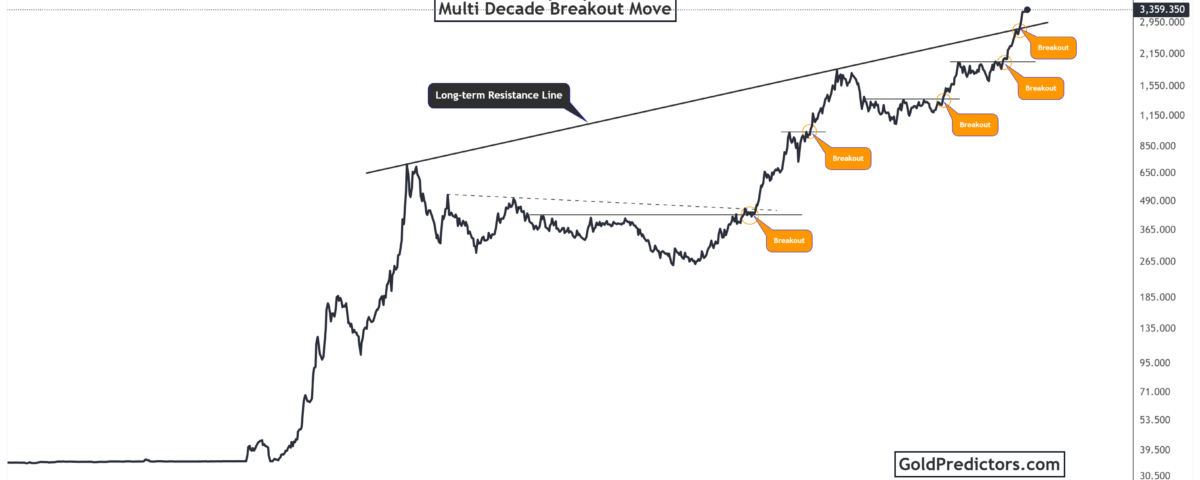
Gold’s Multi-Decade Breakout Signals Powerful Long-Term Bullish Trend
The gold chart below shows one of the most important technical developments in gold’s history. Gold has broken above a long-term resistance line that has capped its price for decades. This resistance line originated from the 1980 peak and has acted as a ceiling through multiple cycles. Each prior breakout attempt led to strong rallies, as seen in the early 2000s and the 2020 surge. Now, the latest breakout has driven prices beyond the $3,300 level, opening the door for further gains.
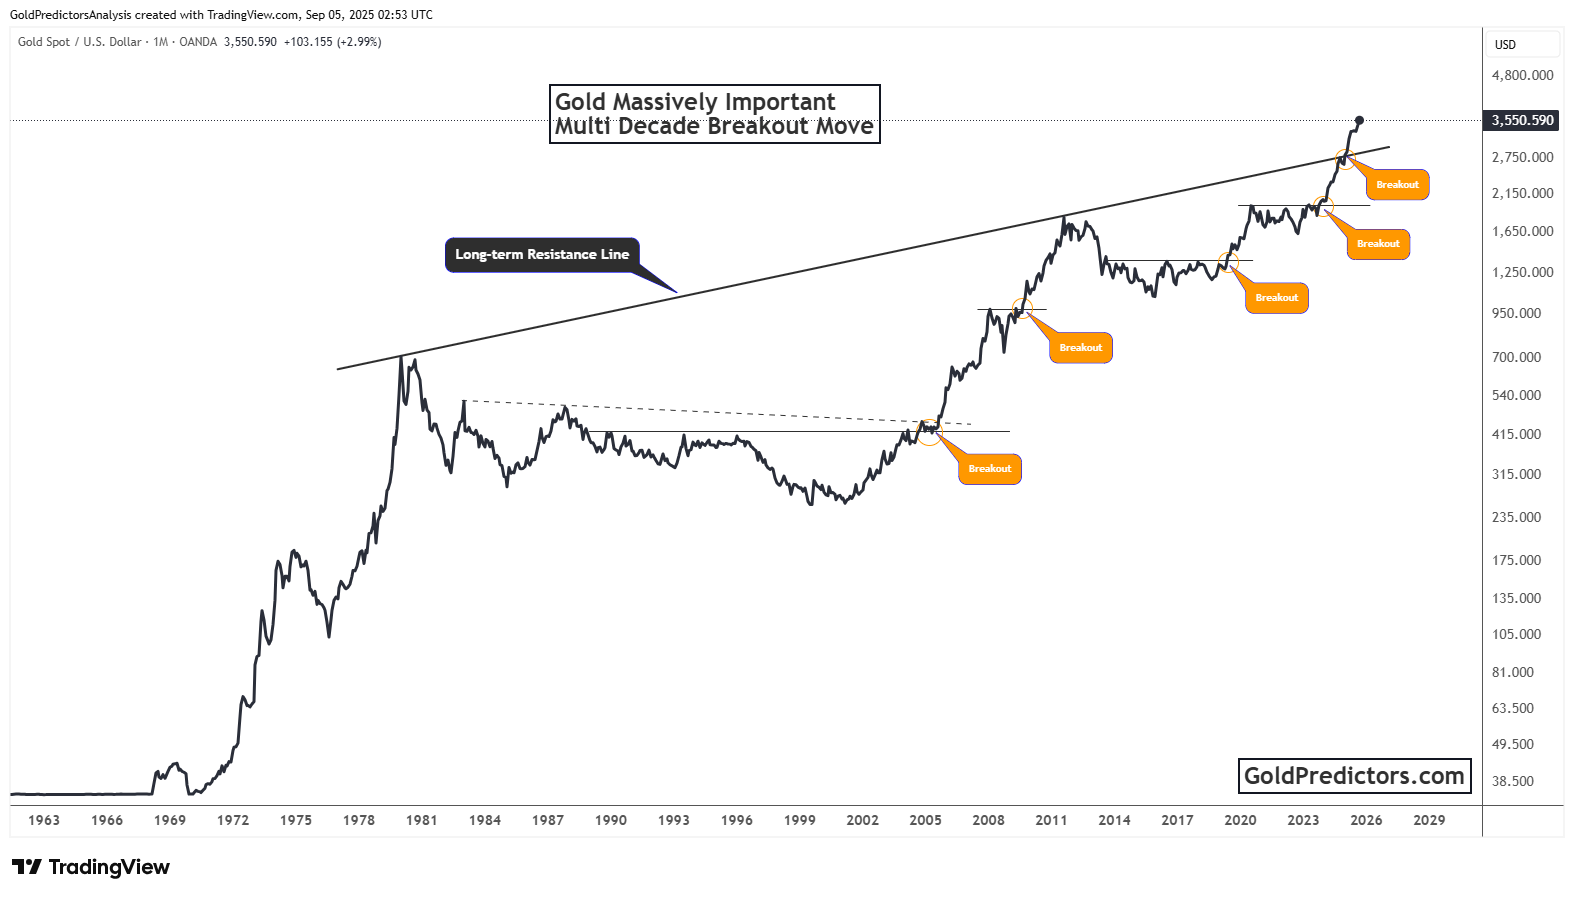
Historical analysis indicates that breakouts from long-term resistance lines in gold often lead to multi-year bull runs. In 2005, a decisive breakout from a 20-year downtrend fueled a climb from sub-$500 levels to above $1,900 in six years. Similarly, the 2019 breakout fueled a surge to above $2,000 in just over a year. The current move appears even more significant, as it is breaking the highest resistance in gold’s recorded history.
The chart also marks previous breakout points, each of which confirmed the underlying bullish trend’s strength. With gold now holding above its breakout zone, technical momentum supports the case for a sustained move toward higher price targets. The absence of significant resistance levels leaves the path open for continued gains. If momentum persists, gold could target levels closer to $4,000 and beyond.
Gold’s Historic Undervaluation Versus Equities Suggests Strong Outperformance Ahead
The chart below shows gold’s performance against U.S. equities using a long-term gold-to-stocks comparison. This ratio highlights periods when gold was historically cheap or expensive relative to stocks. It also reveals a repeating long-term cycle. In times of economic stress or high inflation, gold tends to outperform equities. During sustained equity bull markets, its relative value usually falls.
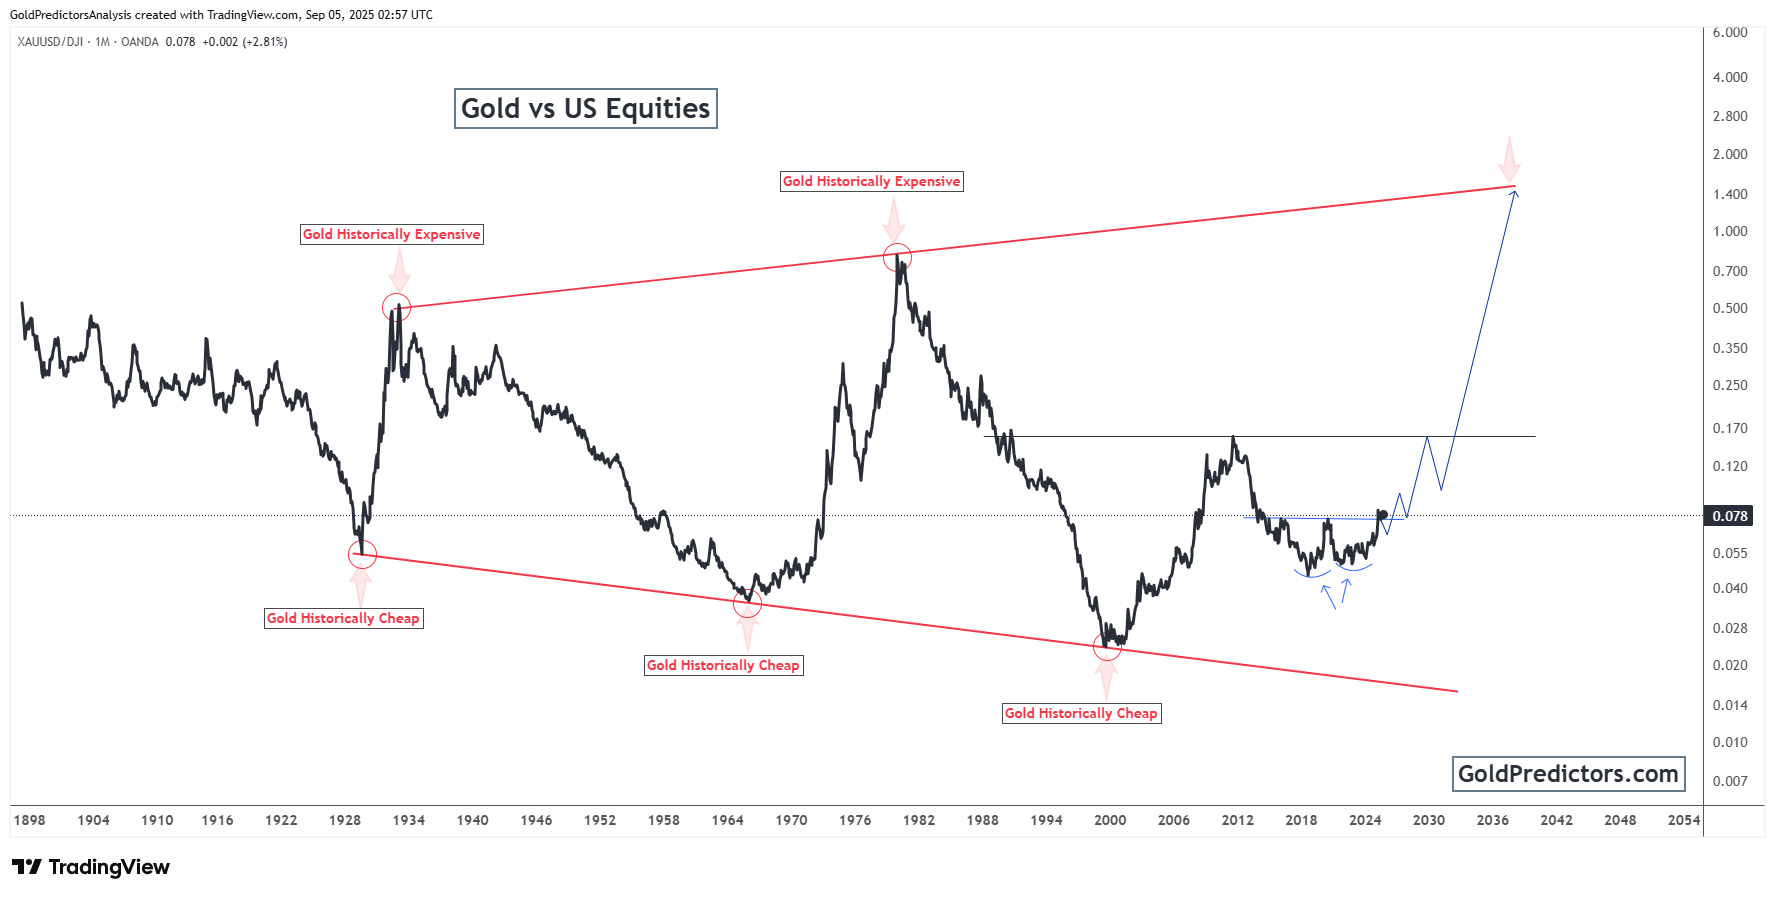
Historically, gold traded at high levels compared to stocks in the early 1930s, 1980, and 2011. Each period is aligned with significant economic or geopolitical crises. Conversely, gold traded at undervalued levels compared to stocks in the mid-1960s, late 1990s, and early 2020s. The current ratio sits near historical lows, suggesting that gold remains undervalued compared to equities.
The chart signals the potential for significant growth in the gold-to-equities ratio in the coming years. If history repeats, gold could significantly outperform stocks. This would push it back to historically expensive levels and trigger a sustained multi-year rally. The macroeconomic backdrop supports this outlook. It is characterized by weak global growth, rising debt levels, and persistent geopolitical tensions. This favorable pricing level makes gold an attractive option for investors seeking protection against volatility and inflation. Past market cycles suggest that such upward trends typically persist for many years.
Conclusion: Gold Gearing Up for a Major Bull Market Ahead
Gold’s technical breakout marks a major turning point for the precious metal. It has surpassed a multi-decade resistance that capped prices for over forty years. Historically, such breakouts have triggered strong, sustained rallies. With no major resistance levels ahead, gold now has room to reach new all-time highs. The current technical setup strongly supports this bullish outlook.
Long-term comparisons with U.S. equities further reinforce the case. Gold remains undervalued relative to stocks based on historical ratios. Similar conditions in the past have often led to extended periods of gold outperforming equities. Today’s backdrop—marked by weak global growth, rising debt, and ongoing geopolitical risks—adds further support to this view.
Together, these trends present a compelling opportunity for investors. Gold’s current price level offers a strong hedge against inflation and market volatility. Historical cycles show that once gold enters a major uptrend, it can last for years. With both technical and macro conditions aligned, gold appears to be entering a prolonged bullish phase.
Gold Predictors Premium Membership
Get exclusive short-term and swing trade ideas with precise entry levels, stop-loss, and target prices, including justification and analysis — all delivered directly via WhatsApp.
Our premium service includes deep technical analysis on gold and silver markets. We cover cycle analysis, price forecasting, and key timing levels.
Members also receive a weekly market letter with detailed analysis, commentary from our Chief Analyst, including actionable insights, trade timing, and direction forecasts for gold and silver.
Stay ahead of the market — join our premium community today.


