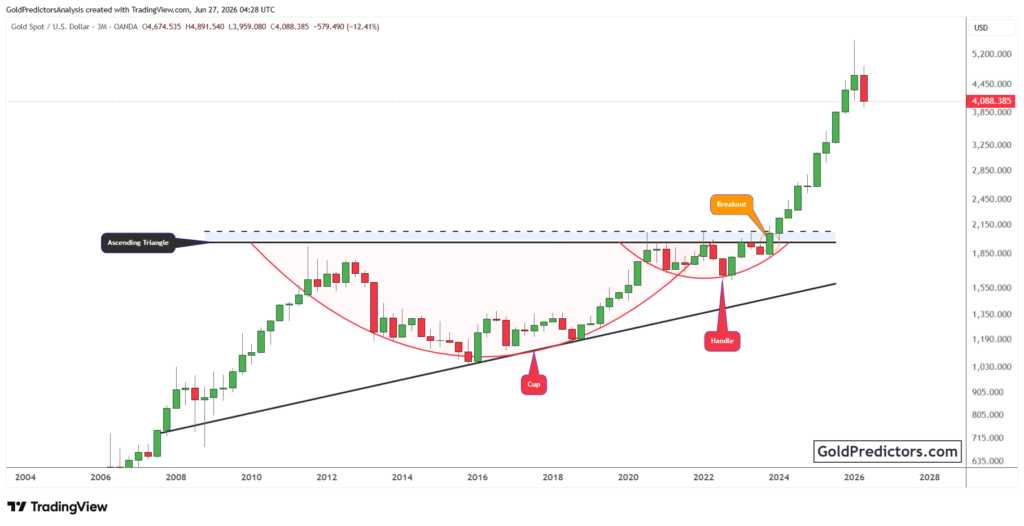
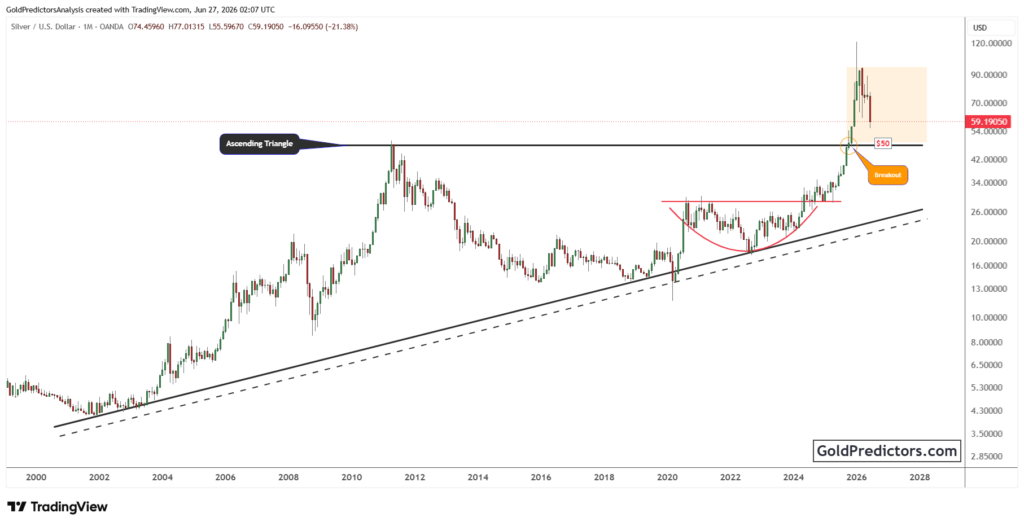
Gold Breaks Multi-Year Base as Tech-to-Gold Ratio Signals Leadership Shift
Gold (XAUUSD) continues to hold firm after completing a major breakout from a multi-year base. Price established a firm base around the $2,000 mark before rotating into a higher price range. Successive moves through key psychological levels signaled broad acceptance of higher prices. Recent action shows gold holding firm near recent highs, with pauses developing as brief consolidations rather than reversals. Meanwhile, the technology-to-gold ratio is turning lower, signaling a shift in relative momentum toward gold. This alignment keeps the broader technical and macro framework favorable, despite the potential for near-term consolidation.
Gold Remains Above Key Levels Following Major Breakout Sequence
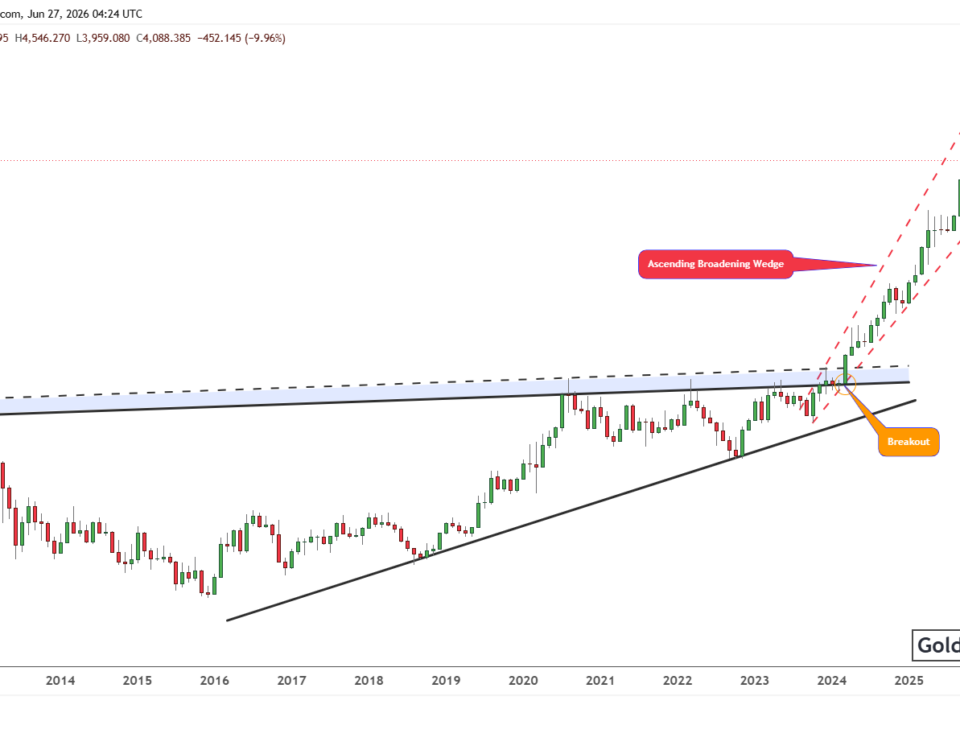
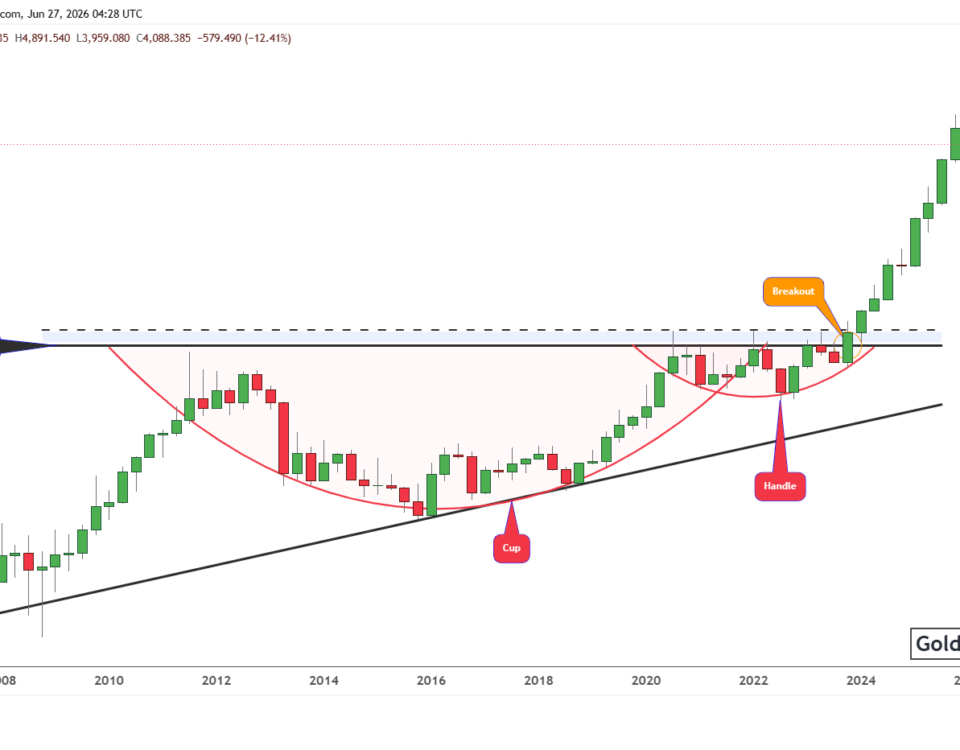
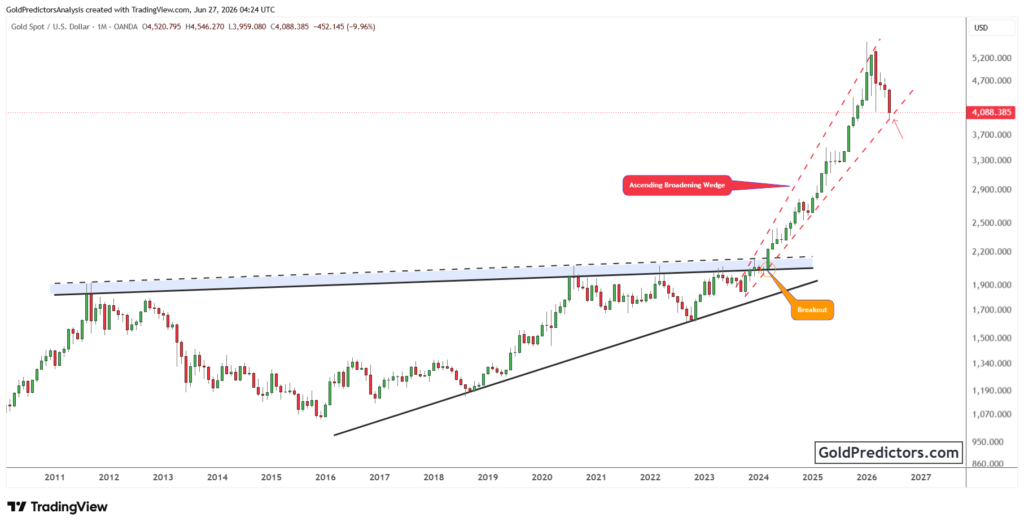
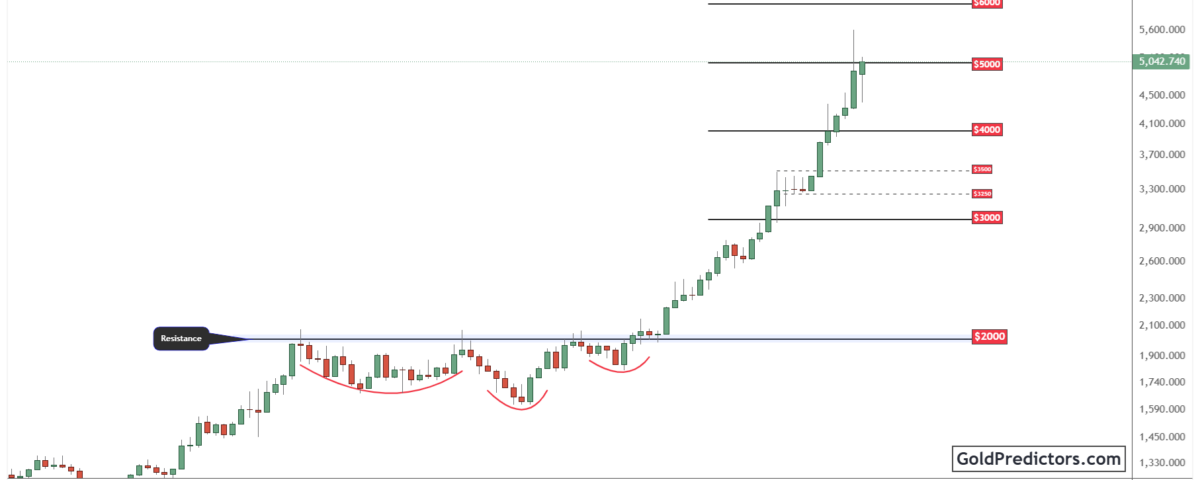
The gold chart below shows a well-defined multi-year base that developed between 2020 and 2024. For an extended period, price struggled near the $2,000 zone, which capped advances and triggered repeated pullbacks. Instead of breaking down, gold formed a broad base with rounded corrections, pointing to gradual supply absorption rather than selling pressure. This prolonged consolidation marked a key accumulation phase. After price finally cleared this resistance, upside momentum strengthened and the move transitioned into a sustained uptrend.
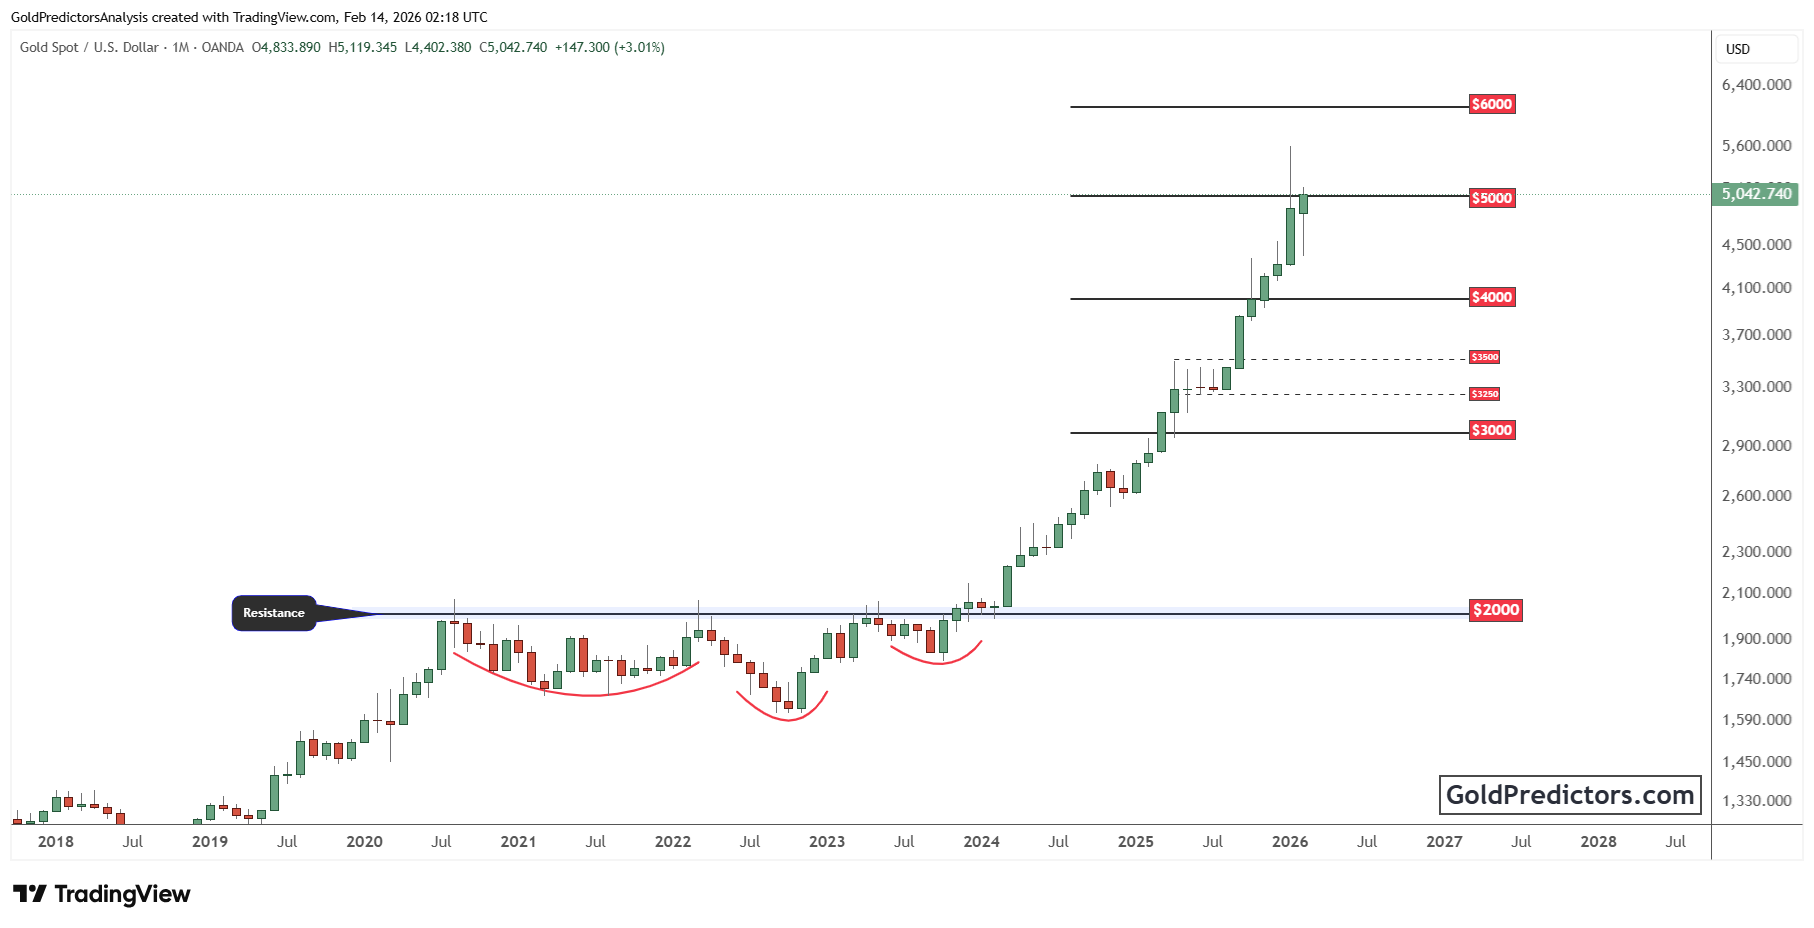
Gold then rallied through a series of major psychological levels. The chart highlights these zones near $3,000, $4,000, and $5,000, where price briefly paused before resuming its climb. Each level acted as a short consolidation area rather than a lasting barrier. The latest push carried gold toward the $5,000 region, where the price is currently holding. Recent price action points to positive momentum, though corrective phases remain possible.
Additionally, further support is visible around the $3,500 and $3,250 zones. These areas could help steady price action if a corrective phase develops. On the upside, the next major resistance sits near $6,000. Reaching this level would depend on sustained macro pressure, steady demand, and a supportive policy backdrop. Despite the strong advance so far, the broader structure remains intact, and the breakout sequence continues to frame a bullish long-term outlook.
Tech-to-Gold Ratio Turns Lower After Decade-Long Uptrend
The chart below shows the technology-versus-gold ratio, which helps assess relative performance between growth assets and hard assets. The ratio traded within an ascending channel for more than a decade. This structure reflected technology’s leadership during periods of economic expansion, strong liquidity, and rising corporate earnings.
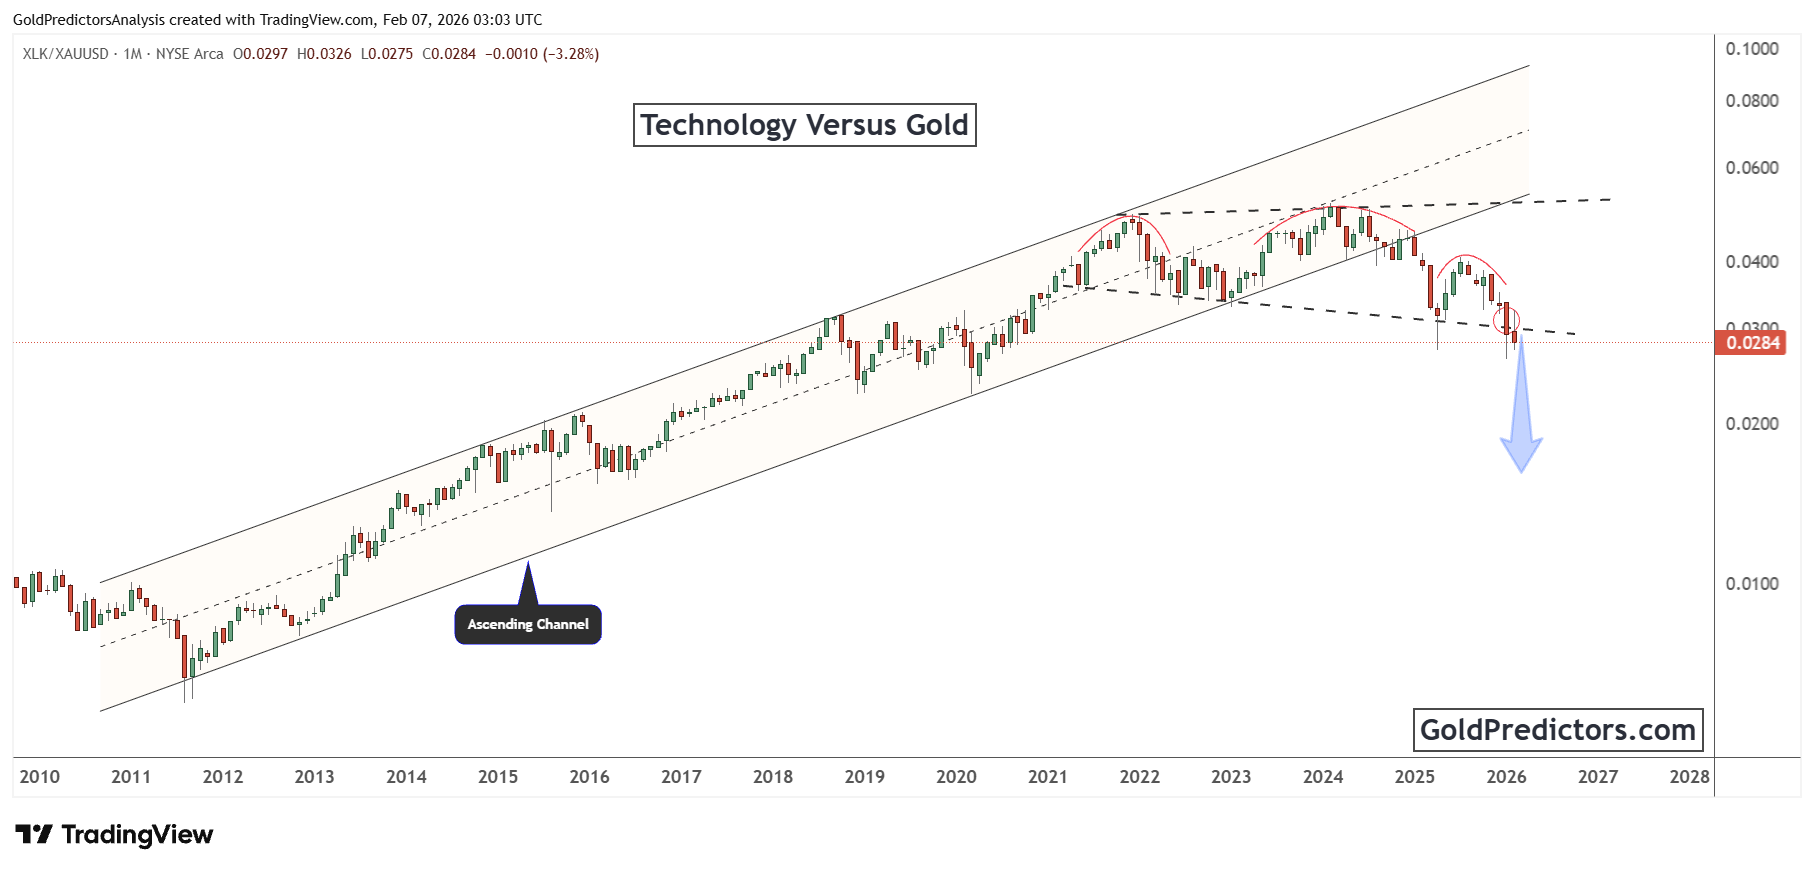
In 2025, price confirmed a decisive breakdown from the channel structure. The ratio formed multiple rounded tops near the upper boundary, followed by repeated failed recovery attempts. Momentum weakened as the trend turned lower, with consistent closes below long-term channel support. This move signals a meaningful shift in the broader structure and in relative market strength.
The latest monthly candles point to persistent downside pressure, with the ratio slipping below the dashed trendline and continuing to weaken. This reflects a loss of relative strength and leaves room for additional downside as the broader trend turns lower. The move suggests that technology may continue to underperform gold as the macro cycle evolves. Policy uncertainty, growing questions around AI-led growth, and rising demand for defensive exposure are driving this shift. These dynamics continue to favor tangible assets over growth-sensitive sectors.
Conclusion: Gold Supported by Structural Breakout and Relative Strength Shift
Gold remains in a clear long-term uptrend after breaking above multi-year resistance. Price has moved into higher ranges and continues to hold above key levels, signaling steady demand during ongoing macro and policy uncertainty. Former resistance zones have become support areas, while pullbacks remain controlled and corrective phases remain shallow. As long as gold holds above its major breakout zones, the bullish structure remains intact and favors further upside following periods of consolidation.
At the same time, the technology-versus-gold ratio has broken below its decade-long channel, pointing to a clear shift in market leadership toward hard assets. This move reflects growing relative pressure on technology while gold gains prominence as capital seeks defensive exposure. If this trend continues, gold is likely to maintain its advantage over time, with periodic pullbacks serving as pauses within a broader bullish structure.
These developments suggest that gold stands to benefit from evolving macro trends. Capital is rotating toward defensive assets as relative strength in growth sectors fades, thereby increasing demand for gold within the broader allocation landscape. If macroeconomic pressures and policy uncertainty persist, gold is likely to remain well supported and positioned to extend its advance into higher price territory over time.
Gold Predictors Premium Membership
Get exclusive short-term and swing trade ideas with precise entry levels, stop-loss, and target prices, including justification and analysis — all delivered directly via WhatsApp.
Our premium service includes deep technical analysis on gold and silver markets. We cover cycle analysis, price forecasting, and key timing levels.
Members also receive a weekly market letter with detailed analysis, commentary from our Chief Analyst, including actionable insights, trade timing, and direction forecasts for gold and silver.
Stay ahead of the market — join our premium community today.