


Gold and GDX Break Multi-Decade Patterns, Signaling Explosive Bull Run
Gold (XAUUSD) has confirmed a major technical breakout, extending its historic bull market into a new phase. The metal has cleared multi-decade resistance levels, following years of consolidation within long-term triangle patterns. This breakout signals renewed momentum and closely mirrors the triangle setup from the previous bull cycle. At the same time, the GDX/gold ratio has also broken key resistance, confirming strength in the mining sector. Together, these breakouts point to a structural shift in the precious metals market, with gold and miners both entering more aggressive upside phases.
Gold Enters New Bull Phase after Multi-Decade Triangle Breakouts
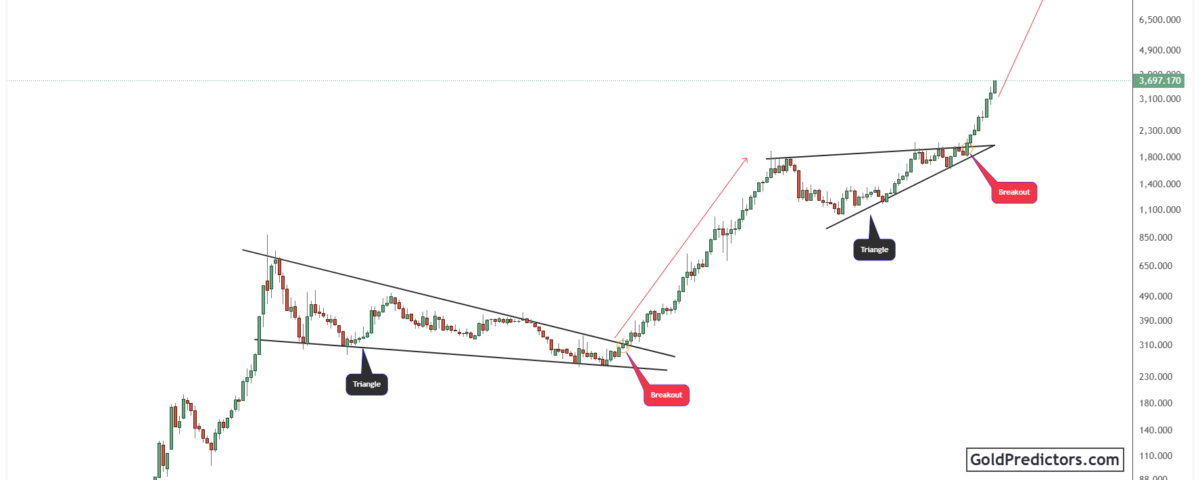
The gold chart below shows a breakout sequence from major long-term triangles, validating gold’s entry into a renewed bull market phase. One of the key triangle patterns was developed between 1980 and 2002, reflecting a prolonged period of consolidation. This consolidation phase spanned over two decades, creating a broad falling triangle structure. Eventually, after multiple failed attempts, gold finally broke above resistance in the early 2000s. That breakout triggered a powerful rally, pushing prices to a new high near $1,900 by 2011.
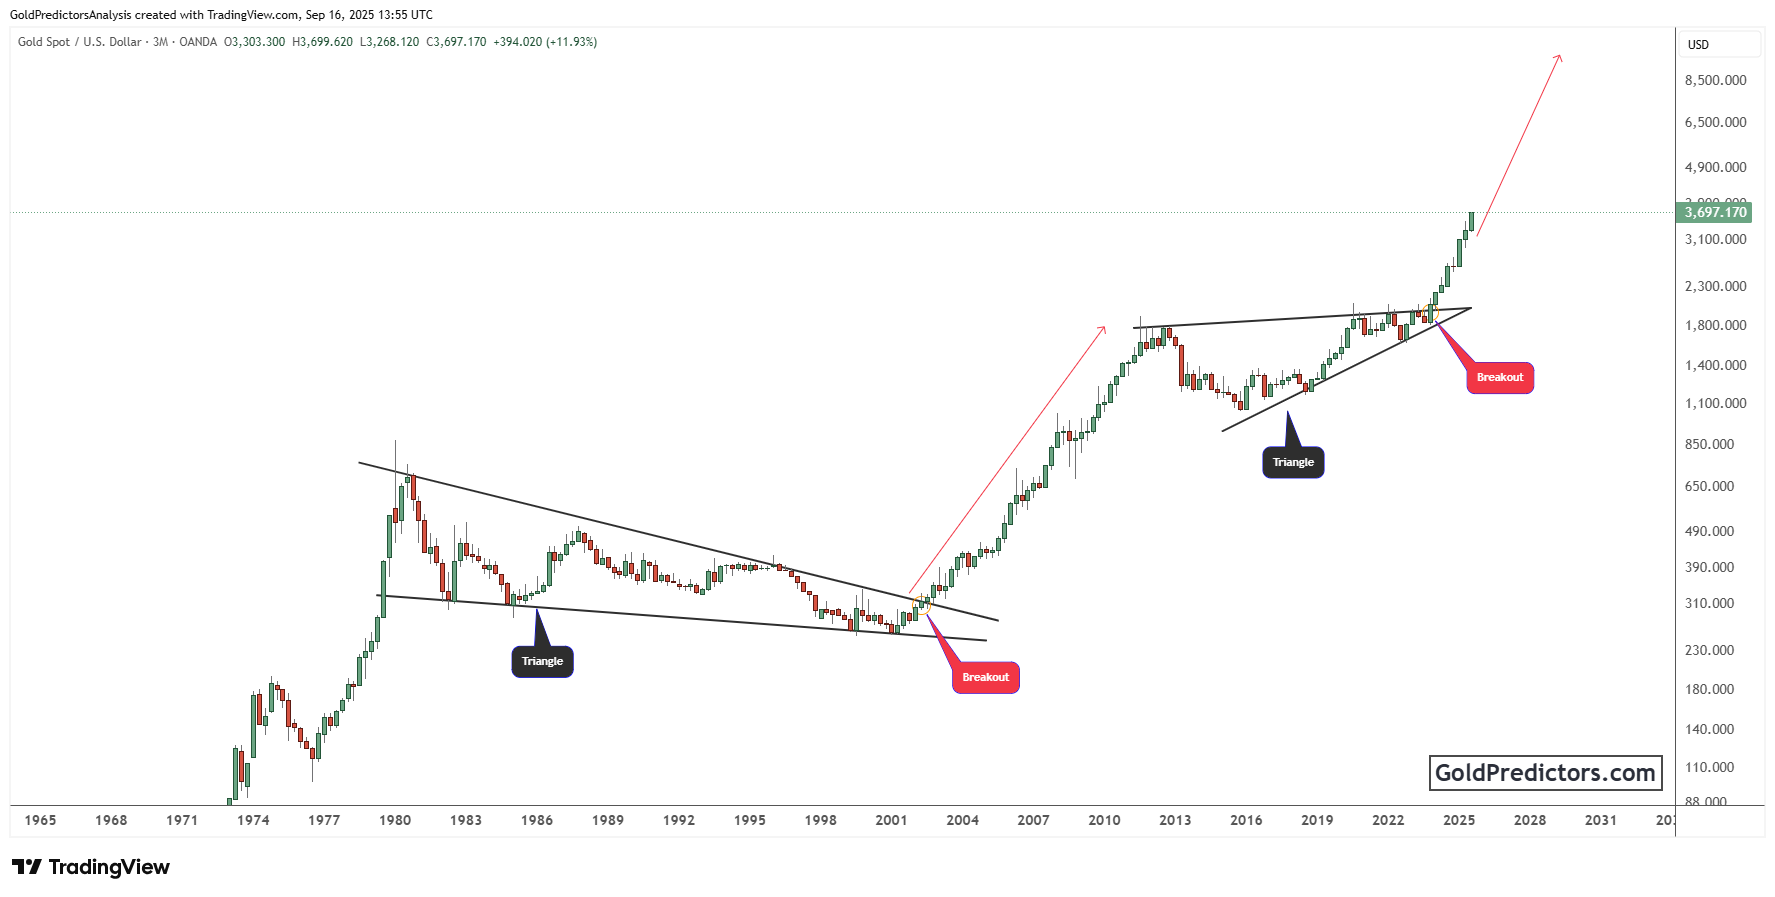
Following that surge, gold entered another long consolidation phase. From 2013 to 2023, prices moved within a long-term triangle pattern. This pattern maintained strong support, while resistance around $2,075 consistently limited upward progress. Over time, this base strengthened, signalling increased buying interest. In late 2024, gold broke firmly above the triangle’s upper boundary, signalling the beginning of a sustained bullish trend.
Consequently, the $2,075 breakout zone has now flipped into firm support, reinforcing the foundation for gold’s ongoing rally to $4,000. This move aligns with earlier bull cycles, and long-term projections now stretch toward the $6,000–$8,000 range. Structurally, it mirrors the momentum and setup seen between 2002 and 2011.
GDX Outperformance Signals Strength in Gold Mining Sector
The chart below shows GDX gaining strength relative to gold, reinforcing gold’s positive long-term outlook. Since 2011, the GDX/gold ratio has been trading beneath a key descending trendline, showing prolonged weakness. Throughout this period, the trendline acted as persistent resistance, causing mining stocks to lag behind gold over an extended period. Over time, the ratio entered a horizontal consolidation box starting in 2013, creating a multi-year base.
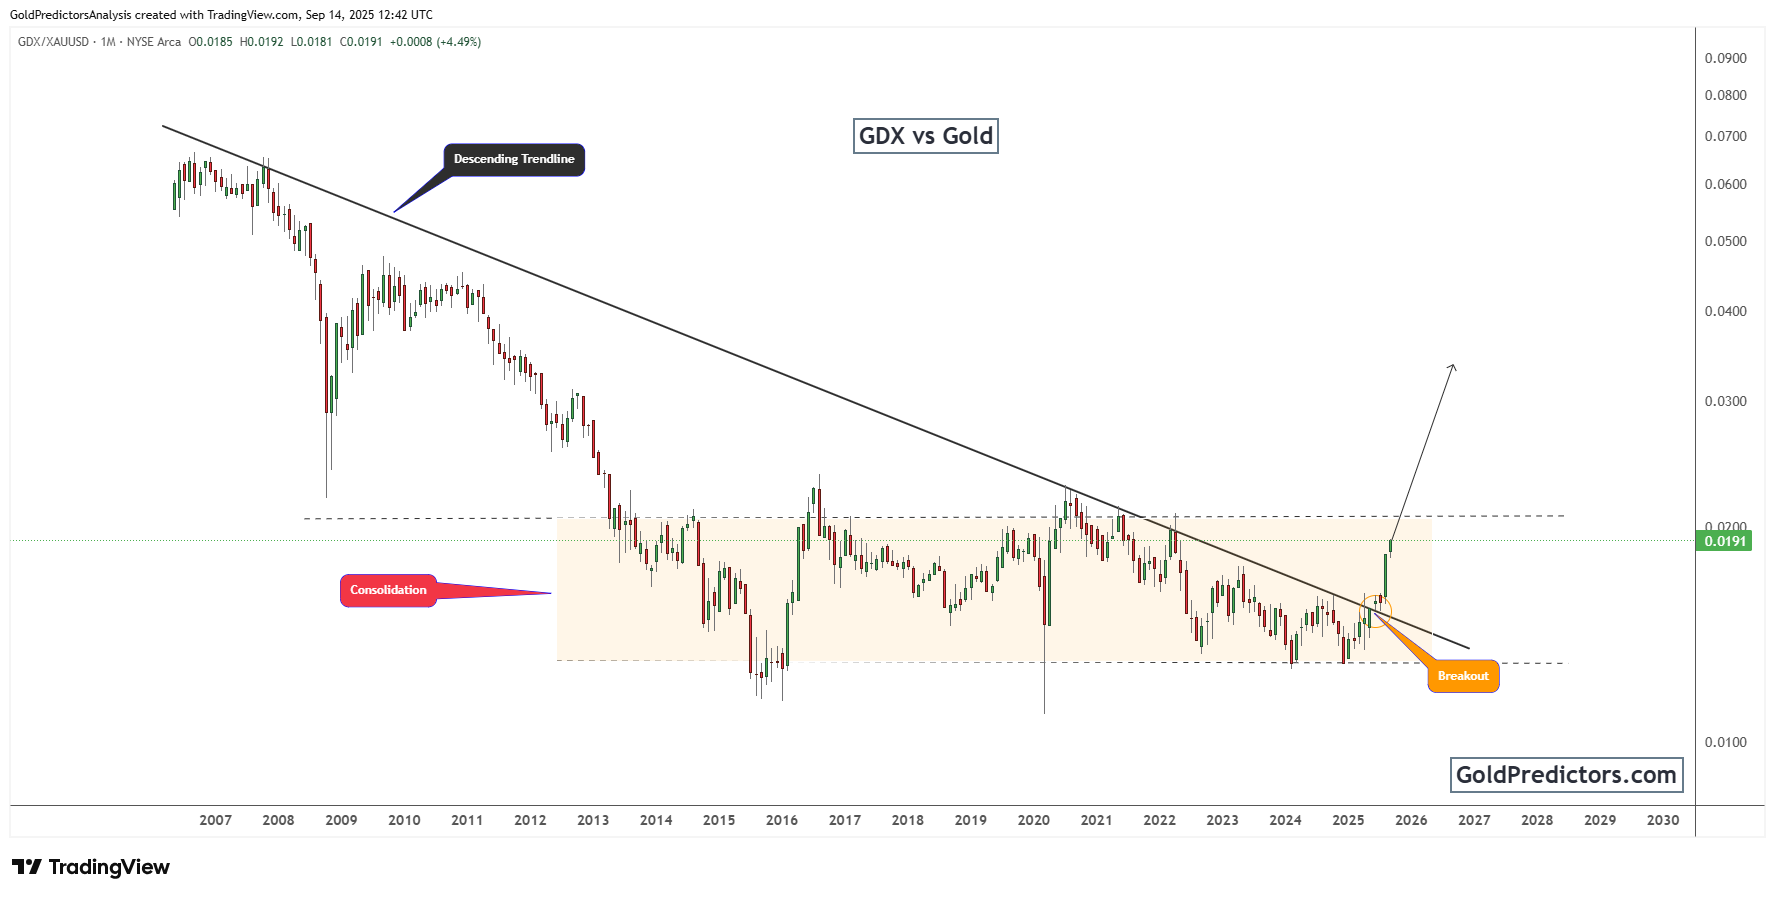
However, recent price action shows that the ratio has broken above both the descending trendline and the consolidation range. This breakout suggests a significant trend reversal is underway. Although mining stocks tend to follow gold initially, they now seem ready to gain ground more rapidly. Historically, strong GDX performance relative to gold often signals renewed sector positioning and growing market confidence.
Notably, GDX tends to validate gold’s sustained uptrends, which makes this breakout more meaningful. The move also suggests that investor confidence in the mining sector is returning. Furthermore, it indicates that the broader precious metals complex is entering a more aggressive phase of its bull cycle. If this trend continues, and the ratio keeps rising, mining equities may begin to amplify gold’s upside, bringing institutional capital back to the sector.
Gold Outlook: Technical Breakouts Confirm Major Shift in Precious Metals
Gold has broken out from a multi-decade triangle structure, confirming a long-term trend reversal. The $2,075 resistance level has flipped into strong support. This development reinforces the ongoing rally above $4,000 and opens the door to higher targets in the $6,000–$8,000 range. Interestingly, the breakout mirrors the early 2000s setup, where a similar pattern led to a sharp multi-year advance.
At the same time, the GDX/gold ratio has broken out of its own long-term base. This breakout signals renewed strength in the mining sector. Historically, such moves indicate growing investor confidence and fresh capital rotation into miners. The rising ratio indicates that mining stocks could start to outperform gold in the near term.
Taken together, these breakouts signal a significant trend change across the precious metals space. Currently, gold is leading with strong technical momentum, while mining equities are beginning to catch up. If these trends hold, the sector could be entering one of its strongest bull phases in decades. Looking ahead, the breakout will gain further credibility if supported by rising volume, momentum, and macro trends.
Gold Predictors Premium Membership
Get exclusive short-term and swing trade ideas with precise entry levels, stop-loss, and target prices, including justification and analysis — all delivered directly via WhatsApp.
Our premium service includes deep technical analysis on gold and silver markets. We cover cycle analysis, price forecasting, and key timing levels.
Members also receive a weekly market letter with detailed analysis, commentary from our Chief Analyst, including actionable insights, trade timing, and direction forecasts for gold and silver.
Stay ahead of the market — join our premium community today.


